The reconstruction of 2,631 draft metagenome-assembled genomes from the global oceans (original) (raw)
Background & Summary
The global oceans are a vast environment in which many key biogeochemical cycles are performed by microorganisms, specifically the Bacteria and Archaea1,2. Assessing the role of individual microorganisms has been confounded due to limitations in growing and maintaining ‘wild’ organisms in the laboratory environment3. The advent of ‘-omic’ techniques, metagenomics, metatranscriptomics, metaproteomics, and metabolomics, has provided an avenue for exploring microbial diversity and function by skipping the necessity of culturing organisms, thus allowing researchers to study organisms for which growth conditions cannot be replicated. Specifically, the application of metagenomics, the sampling and sequencing of genetic material directly from environment, provides an avenue for reconstructing the genomic sequences of environmental Bacteria and Archaea4–7.
Through the Tara Oceans Expedition (2003–2010), thousands of samples were collected of marine life8, including more than 200 metagenomic samples targeting the viral and microbial components of the marine ecosystem from around the globe9,10. Several studies have started the process of reconstructing microbial genomes from these metagenomics samples, utilizing samples from the Mediterranean11 and the bacterial size fraction (0.2–3 μm)12. Here, we present >2,000 additional draft genomes from the Bacteria and Archaea estimated to be >50% complete reconstructed from 102 billion metagenomic sequences generated from multiple size fractions and depths at the 61 stations sampled during the Tara Oceans circumnavigation of the globe. Phylogenomic analysis suggests that this set of draft genomes includes highly sought after genomes that lack cultured representatives, such as: Group II (149) and Group III (12) Euryarchaeota, the Candidate Phyla Radiation (30), the SAR324 (18), the Pelagibacteraceae (32), and the Marinimicrobia (111).
We envision that these draft genomes will provide a resource for downstream analysis acting as references for metatranscriptomic13 and metaproteomic14 projects, providing the data necessary for large-scale comparative genomics within globally vital phylogenetic groups15, and allowing for the exploration of novel microbial metabolisms16. Non-redundant draft metagenome-assembled genomes have been deposited into the National Center for Biotechnology Information (NCBI) database and assembly data, including contigs used for binning, have been submitted to the public data repository figshare to allow for the further examination of metagenomic information that was not incorporated in to the draft genomes.
Methods
These methods have been described in part previously16, but have now been applied to full dataset discussed below (Supplementary Fig. 1).
Gathering metagenomics sequences & assembly
An example of the methodology used to assemble the Tara Oceans metagenomes is available on Protocols.io (https://doi.org/10.17504/protocols.io.hfqb3mw). All metagenomic sequences generated for 234 samples collected from 61 stations during the Tara Oceans expedition were accessed from the European Molecular Biology Laboratory-European Bioinformatics Institute (EMBL-EBI)9,10. Generally, samples were collected from multiple size fractions, commonly ‘viral’ (<0.22 μm), ‘girus’ (0.22–0.8 μm), ‘bacterial’ (0.22–1.6 μm), and ‘protistan’ (0.8–5.0 μm), at multiple depths, commonly at the surface (~5-m), deep chlorophyll maximum (DCM), and mesopelagic, from each station. Samples represent the filters from which DNA was extracted and sequenced (e.g., Station TARA007, girus filter fraction, surface depth), and multiple samples can belong to one station. The 61 stations were grouped in to 10 oceanic provinces as depicted in Fig. 1. Each sample was assembled individually using Megahit17 (v.1.0.3; parameters: --preset meta-sensitive). It should be noted that in several instances the size of samples from the South Pacific caused the Megahit assembly to fail; these samples were split to allow assembly and are noted in Table 1. Each of the 234 samples were assembled individually in an effort to avoid unresolvable assembly branches (commonly referred to as bubbles) caused by strain heterogeneity in closely related organisms. Strain heterogeneity from endemic organisms at different stations may cause breakages in the assembly, such that treating each sample individually increases the threshold at which organisms with limited strain heterogeneity may be successfully recovered. However, this assembly procedure does not resolve issues with abundant organisms with high degrees of strain heterogeneity within a single sample.
Figure 1: A map depicting the approximate locations of the Tara Oceans sampling stations from which metagenomics data was collected.
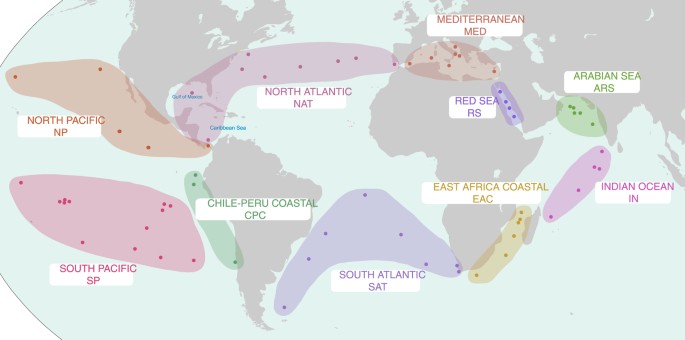
Stations are grouped in to larger provinces based on Longhurst Provinces and site proximity. Province abbreviations are used for draft genome IDs. The map in Fig. 1 were modified under a CC BY-SA 3.0 license from ‘Oceans and Seas boundaries map’ by Pinpin.
Table 1 Statistics for the primary contigs generated for each of the 234 sample fractions (Table1_ReadsPrimaryContigs.xlsx, Data Citation 2)
In total, over 102 billion paired-end reads were assembled into >562 million contigs (Table 1 (available online only); referred to as primary contigs). Primary contigs <2 kb in length were not used in downstream analysis. All primary contigs ≥2 kb in length from a province were processed using CD-HIT-EST18 (v4.6; parameter: -c 0.99) to reduce the computational load required for the secondary assembly by combining contigs with ≥99% semi-global identity. Primary contigs from the same oceanographic province were co-assembled using Minimus219 (Fig. 1; AMOS v3.1.0; parameters: -D OVERLAP=100 MINID=95). Combining the Minimus2 generated contigs and the primary contigs that did not assemble with Minimus2, approximately 7.2 million contigs were generated for downstream analysis (Table 2; referred to as secondary contigs).
Table 2 Statistics for each province on the number secondary contigs generated, the number of contigs binned and corresponding length cutoff, and the number of draft genomes reconstructed.
Binning
An example of the methodology used to bin the Tara Oceans metagenomes is available on Protocols.io (https://doi.org/10.17504/protocols.io.iwgcfbw). Metagenomic reads from each sample in a oceanic province were recruited against the set of secondary contigs generated from that same province using Bowtie220 (v4.1.2; default parameters). Binning was performed using a custom BinSanity21 workflow. Coverage was determined using BinSanity-profile, which incorporates featureCounts22 to determine a reads·bp−1 coverage value for each contig from each sample. Coverage values were multiplied by 100 and log normalized (parameter: --transform scale). Then due to computational limitations imposed during the BinSanity binning method, the secondary contigs from each province were size selected (≥4–14 kb cutoffs) to choose approximately 100,000 contigs for binning (Table 2). Approximately 6 million secondary contigs remain un-binned and are available for analysis. Coverage values were only determined for contigs and samples from the same province to prevent instances where organisms with low abundance (or no abundance) values in different oceanic regions could lead to the convergence of unrelated contigs during the binning step and result in failure to resolve quality bins.
The binning using BinSanity was performed iteratively six times, with changes to the preference value after the first three iterations and a set parameter for iterations 4–6 in order to influence the degree of clustering (v0.2.5.5; parameters: -p [(1) −10, (2) −5, (3) −3, (4–6) −3] -m 4,000 -v 400 -d 0.95). Bins with high contamination (>10% contamination; see below) and low completion (<50% complete; see below) generated with BinSanity (using only coverage) were processed with the BinSanity-refinement script utilizing a set preference value (parameter: -p −25 -kmer 4). After the six iteration with BinSanity, bins with high contamination were processed two more times with BinSanity-refinement using variable preference values (parameter: -p [(6) −10, (7) −3]). After each BinSanity and BinSanity-refinement step, bins were assessed using CheckM23 (v1.0.3; parameters: lineage_wf) for completion and contamination estimates, which were used as cutoffs for inclusion in the final dataset (SupplementalTable1.xlsx, Data Citation 2). Bins were reassigned as a draft genome if: >90% complete with <10% contamination, 80–90% complete with <5% contamination, or 50–80% complete with <2% contamination. Bins that did not meet these criteria were combined for the next iteration of binning, except after the six iteration (see above). In total, 2,631 draft genomes were generated, with 1,491 of the genomes >70% complete, and 420 genomes meeting a high-quality threshold of >90% complete and <5% contamination (Supplementary Table 1). Genomes were provided identifiers with the format T ara Oceans Binned Genome (TOBG)—Province Abbreviation—Numeric ID (e.g., TOBG_NAT-221).
An additional 15,557 bins were generated containing at least five contigs that did not meet the criteria for reclassification as a draft genome. These bins may offer pertinent information for different downstream analyses. Bins of interest with high completion and high contamination can be manually assessed using tools, such as Anvi’o24, to generate a more accurate draft genome. For bins with <50% completion, it may be possible to combine two or more bins to generate a draft genome. And for bins with minimal or no phylogenetic markers assessment may reveal that they represent viral, episomal, or eukaryotic DNA sequences.
Phylogenetic assignment
A multi-pronged approach was used to provide a phylogenetic assignment to all of the draft genomes. All of the secondary contigs had putative coding DNA sequences (CDSs) predicted using Prodigal25 (v2.6.2; -m -p meta). Contigs assigned to draft genomes and 7,041 complete and partial reference genomes (SupplementalTable2.xlsx, Data Citation 2) accessed from NCBI GenBank26 were searched for phylogenetic markers. Protein phylogenetic markers were detected using hidden Markov models (HMMs) collected from the Pfam database27 (Accessed March 2017) and identified using HMMER28 (v3.1b2; parameters: hmmsearch -E 1e-10). Two sets of single-copy markers recalcitrant to horizontal gene transfer were identified and used to construct phylogenetic trees; a set of 16 generally syntenic markers identified in Hug, et al.29 and an alternative set of 25 markers, for which 24 of the markers do not overlap in the Hug, et al. set (SupplementalTable3.xlsx, Data Citation 2). As the Hug, et al. marker set is syntenic, incomplete draft genomes may lack some or all of these markers. In order to accurately assign phylogeny to draft genomes without sufficient markers to be included with the Hug, et al. set, the alternative marker set consisted of additional single-copy phylogenetic markers30 present in a majority of the reference genomes. Draft and reference genomes were required to possess ≥10 and ≥15 markers for the Hug, et al. and alternative marker sets, respectively, to be included in downstream analysis. If multiple copies of the same marker were detected, neither copy was considered for further analysis. Each marker was aligned using MUSCLE31 (v3.8.31; parameter: -maxiters 8), trimmed using trimAL32 (v.1.2rev59; parameter: -automated1), and manually assessed. Alignments for each set of markers were concatenated. A maximum likelihood tree using the LGGAMMA model was generated using FastTree33 (v.2.1.10; parameters: -lg -gamma; SupplementalInformation1-HugTree.newick.txt, SupplementalInformation2-AltTree.newick.txt, Data Citation 2). Phylogenies were determined manually for 2,009 and 95 draft genomes for the Hug, et al. and alternative marker sets, respectively, based on the location of each draft genome on the respective trees (Supplementary Table 2). A simplified phylogenetic tree of the Hug, et al. phylogenetic marker set was constructed using the same parameters with only the alignments of the draft genomes for Fig. 2.
Figure 2: A maximum likelihood tree of the TOBG draft genomes based on 16 concatenated single-copy phylogenetic markers.
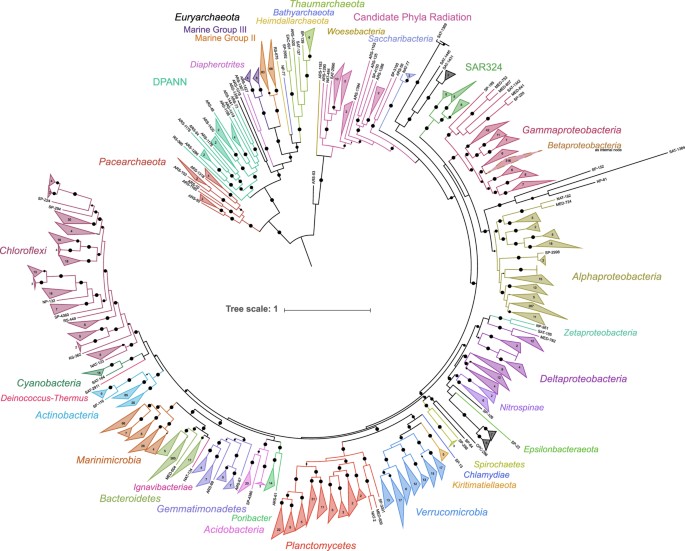
Bootstrap values >0.75 are shown. Circle size representing the bootstrap value is scaled from 0.75–1.0. Nodes where the average branch length distance is <0.5 were collapsed and the number of draft genomes in each node are provided. The image was generated using the Interactive Tree of Life (iTOL; http://itol.embl.de/).
16S rRNA genes were predicted from draft genomes using RNAmmer34 (v1.2; parameters: -S bac -m ssu). 276 16S rRNA genes were detected and aligned using the SINA web portal aligner35 (https://www.arb-silva.de/aligner/). Aligned 16S rRNA gene sequences were added to the non-redundant 16S rRNA gene database (SSURef128 NR99) in ARB36 (v6.0.3) using the Parsimony (Quick) tool (default parameters). Each 16S rRNA gene sequence from a draft genome was assigned a putative phylogeny based on placement on the SSURef128 NR99 guide tree (Supplementary Table 2; SupplementalTable4.xlsx, Data Citation 2).
For the draft genomes, 81.3% were manually assigned a phylogeny based on the Hug, et al. marker set (2,009 draft genomes), the alternative marker set (95 draft genomes), or the 16S rRNA gene tree (35 draft genomes). The remaining 492 draft genomes were provided a putative phylogeny based on CheckM (Supplementary Table 2; SupplementalTable4.xlsx, Data Citation 2).
Relative abundance
Several of the size fractions used to reconstruct bacterial and archaeal draft genomes were specifically designed to target different biological entities, such as double-stranded DNA viruses, giant viruses (giruses), and protists. In order to estimate the relative abundance of the draft genomes compared to only the total bacterial and archaeal community, a set of 100 previously identified HMMs for predominantly single-copy bacterial and archaeal markers37,38 were searched against the putative CDS of the secondary contigs from each province using HMMER (parameters: hmmsearch --cut_tc). From each province, the set of CDS identified by the marker HMMs could be used to approximate the total bacterial and archaeal community. Markers belonging to the draft genomes were identified. Based on the metagenomic reads recruited to the secondary contigs for each sample, the number of reads aligned to each marker in a sample was determined using BEDTools39 (v2.17.0; multicov default parameters). A length-normalized estimate of relative abundance for each draft genome in each sample in a province was determined using the following equation:
∑ Reads bp - 1 TOBG markers ∑ Reads bp - 1 all province markers ×100
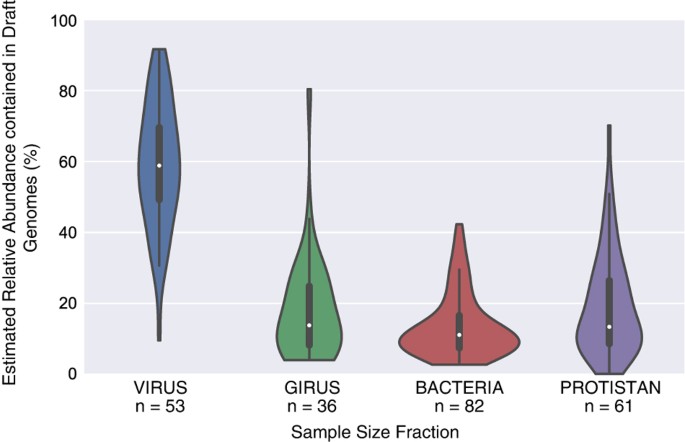
The relative abundance estimates of draft genomes indicate that the genomes generated for this study constitute only a small percentage of the total bacterial and archaeal abundance in each sample (Fig. 3; SupplementalTable5.xlsx, Data Citation 2). The draft genomes account for a higher percentage of the viral size fraction compared to other size fractions, accounting for ~60% of the total bacterial and archaeal community in that size fraction. This is likely due to the fact that the number of microbial organisms capable of passing through a 0.22 μm filter is limited and the overall microbial community in these samples is less complex, possibly resulting in increases in assembly efficiency and/or binning performance. On average, the draft genomes in the girus, bacterial, and protistan size fractions account for 14–19% of the total bacterial and archaeal communities. As such, the application of alternative binning methods to this same dataset should generate additional draft genomes40.
Figure 3: Violin plots illustrating the fraction of the estimated total bacterial and archaeal community represented by the draft genomes for samples from the different size fractions.
Data Records
This project has been deposited at DDBJ/ENA/GenBank under the BioProject accession no. PRJNA391943 with the Whole Genome Shotgun project deposited under the accessions NYSJ00000000-NZZZ00000000 and PAAA00000000-PCDB00000000 (Data Citation 1). NCBI Assembly accession IDs for the 2,281 newly described draft genomes are listed in the ISA-Tab metadata record accompanying this Data Descriptor. Assembly sequence for the 324 genomes determined to be duplicates can be found in the TOBG-BINS.tar.gz files (Data Citation 2). Additional data is available through figshare, including copies of all draft genomes, all primary contigs, all secondary contigs, read count data for each secondary contig from each sample, and Supplementary Information and tables (Data Citation 2). The set of 100 HMMs for predominantly single-copy bacterial and archaeal markers from Albertsen, et al.37 is available on GitHub (https://github.com/MadsAlbertsen/multi-metagenome/blob/master/R.data.generation/essential.hmm).
Technical Validation
Inclusion in this dataset requires that specific thresholds be achieved during the procedure discussed in the manuscript. Additional technical validation should be applied by researchers to confirm the accuracy of draft genomes used for specific downstream purposes.
Usage Notes
The TOBG genomes have been generated using an automated process without manual assessment, as such, all downstream research should independently assess the accuracy of genes, contigs, and phylogenetic assignments for organisms of interest. Several of the draft genomes generated through this methodology appear to be identical, based on the Hug marker set phylogenomic tree, to genomes generated by Tully, et al.11 and Delmont, et al.12, these genomes have been identified (Supplementary Table 1) and in most cases duplicate genomes were not submitted to NCBI. In total, 186 draft genomes from this dataset, 68 from Tully, et al.11 and 118 from Delmont, et al.12, were determined to be identical to the previous work and not submitted to NCBI. However, draft genomes from this study that were estimated to be more complete than available through Delmont, et al.12 were submitted (_n_=198) to NCBI. In providing official nomenclature for submission to NCBI, priority was given to the Hug marker assignment, followed by the 16S rRNA assignment, then alternative marker assignment, and, finally, the CheckM assignment.
Additional information
How to cite this article: Tully, B. J. et al. The reconstruction of 2,631 draft metagenome-assembled genomes from the global oceans. Sci. Data 5:170203 doi:10.1038/sdata.2017.203 (2018).
Publisher’s note: Springer Nature remains neutral with regard to jurisdictional claims in published maps and institutional affiliations.
References
References
- Moran, M. A. The global ocean microbiome. Science 350, aac8455 (2015).
Article Google Scholar - Falkowski, P. G., Fenchel, T. & DeLong, E. F. The Microbial Engines That Drive Earth's Biogeochemical Cycles. Science 320, 1034–1039 (2008).
Article CAS ADS Google Scholar - Staley, J. T. & Konopka, A. Measurement of in situ activities of nonphotosynthetic microorganisms in aquatic and terrestrial habitats. Annual Reviews in Microbiology 39, 321–346 (1985).
Article CAS Google Scholar - Tyson, G. W. et al. Community structure and metabolism through reconstruction of microbial genomes from the environment. Nature 428, 37–43 (2004).
Article CAS ADS Google Scholar - Seitz, K. W., Lazar, C. S., Hinrichs, K.-U., Teske, A. P. & Baker, B. J. Genomic reconstruction of a novel, deeply branched sediment archaeal phylum with pathways for acetogenesis and sulfur reduction. ISME J 10, 1696–1705 (2016).
Article CAS Google Scholar - Anantharaman, K. et al. Thousands of microbial genomes shed light on interconnected biogeochemical processes in an aquifer system. Nature Communications 7, 13219 (2016).
Article CAS ADS Google Scholar - Hugerth, L. W. et al. Metagenome-assembled genomes uncover a global brackish microbiome. Genome Biol. 16, 1–18 (2015).
Article Google Scholar - Karsenti, E. et al. A Holistic Approach to Marine Eco-Systems Biology. Plos Biol 9, e1001177–5 (2011).
Article CAS Google Scholar - Pesant, S. et al. Open science resources for the discovery and analysis of Tara Oceans data. Sci. Data 2, 150023–16 (2015).
Article CAS Google Scholar - Sunagawa, S. et al. Ocean plankton. Structure and function of the global ocean microbiome. Science 348, 1261359 (2015).
Article Google Scholar - Tully, B. J., Sachdeva, R., Graham, E. D. & Heidelberg, J. F. 290 metagenome-assembled genomes from the Mediterranean Sea: a resource for marine microbiology. PeerJ 5, e3558–15 (2017).
Article Google Scholar - Delmont, T. O. et al. Nitrogen-Fixing Populations Of Planctomycetes And Proteobacteria Are Abundant In The Surface Ocean. bioRxiv 129791, 1–16 (2017).
Google Scholar - Gifford, S. M., Sharma, S., Booth, M. & Moran, M. A. Expression patterns reveal niche diversification in a marine microbial assemblage. ISME J 7, 281–298 (2012).
Article Google Scholar - Saito, M. A. et al. Multiple nutrient stresses at intersecting Pacific Ocean biomes detected by protein biomarkers. Science 345, 1173–1177 (2014).
Article CAS ADS Google Scholar - Farrant, G. K. et al. Delineating ecologically significant taxonomic units from global patterns of marine picocyanobacteria. Proc. Natl. Acad. Sci. USA 201524865–10 (2016).
- Graham, E. D., Heidelberg, J. F. & Tully, B. Undocumented Potential For Primary Productivity In A Globally-Distributed Bacterial Photoautotroph. bioRxiv 140715, 1–17 (2017).
Google Scholar - Li, D. et al. MEGAHIT v1.0: A fast and scalable metagenome assembler driven by advanced methodologies and community practices. Methods 102, 3–11 (2016).
Article CAS Google Scholar - Fu, L., Niu, B., Zhu, Z., Wu, S. & Li, W. CD-HIT: accelerated for clustering the next-generation sequencing data. Bioinformatics 28, 3150–3152 (2012).
Article CAS Google Scholar - Treangen, T. J., Sommer, D. D., Angly, F. E., Koren, S. & Pop, M. Next generation sequence assembly with AMOS. Curr Protoc Bioinformatics Chapter 11, Unit 11.8 (2011).
PubMed Google Scholar - Langmead, B. & Salzberg, S. L. Fast gapped-read alignment with Bowtie 2. Nat Meth 9, 357–359 (2012).
Article CAS Google Scholar - Graham, E. D., Heidelberg, J. F. & Tully, B. J. BinSanity: unsupervised clustering of environmental microbial assemblies using coverage and affinity propagation. PeerJ 5, e3035–19 (2017).
Article Google Scholar - Liao, Y., Smyth, G. K. & Shi, W. featureCounts: an efficient general purpose program for assigning sequence reads to genomic features. Bioinformatics 30, 923–930 (2014).
Article CAS Google Scholar - Parks, D. H., Imelfort, M., Skennerton, C. T., Hugenholtz, P. & Tyson, G. W. CheckM: assessing the quality of microbial genomes recovered from isolates, single cells, and metagenomes. Genome Res. 25, 1043–1055 (2015).
Article CAS Google Scholar - Eren, A. M. et al. Anvi‘o: an advanced analysis and visualization platform for ’omics data. PeerJ 3, e1319 (2015).
Article Google Scholar - Hyatt, D., LoCascio, P. F., Hauser, L. J. & Uberbacher, E. C. Gene and translation initiation site prediction in metagenomic sequences. Bioinformatics 28, 2223–2230 (2012).
Article CAS Google Scholar - Benson, D. A. et al. GenBank. Nucleic Acids Res. 28, 15–18 (2000).
Article CAS Google Scholar - Bateman, A. et al. The Pfam Protein Families Database. Nucleic Acids Res. 30, 276–280 (2002).
Article CAS Google Scholar - Finn, R. D., Clements, J. & Eddy, S. R. HMMER web server: interactive sequence similarity searching. Nucleic Acids Res. 39, W29–W37 (2011).
Article CAS Google Scholar - Hug, L. A. et al. A new view of the tree of life. Nature Microbiology 1, 16048 (2016).
Article CAS ADS Google Scholar - Santos, S. R. & Ochman, H. Identification and phylogenetic sorting of bacterial lineages with universally conserved genes and proteins. Environ. Microbiol. 6, 754–759 (2004).
Article CAS Google Scholar - Edgar, R. C. MUSCLE: multiple sequence alignment with high accuracy and high throughput. Nucleic Acids Res. 32, 1792–1797 (2004).
Article CAS Google Scholar - Capella-Gutiérrez, S., Silla-Martínez, J. M. & Gabaldón, T. trimAl: a tool for automated alignment trimming in large-scale phylogenetic analyses. Bioinformatics 25, 1972–1973 (2009).
Article Google Scholar - Price, M. N., Dehal, P. S. & Arkin, A. P. FastTree 2--approximately maximum-likelihood trees for large alignments. PLoS ONE 5, e9490 (2010).
Article ADS Google Scholar - Lagesen, K. et al. RNAmmer: consistent and rapid annotation of ribosomal RNA genes. Nucleic Acids Res. 35, 3100–3108 (2007).
Article CAS ADS Google Scholar - Pruesse, E., Peplies, J. & Glöckner, F. O. SINA: accurate high-throughput multiple sequence alignment of ribosomal RNA genes. Bioinformatics 28, 1823–1829 (2012).
Article CAS Google Scholar - Ludwig, W. et al. ARB: a software environment for sequence data. Nucleic Acids Res. 32, 1363–1371 (2004).
Article CAS Google Scholar - Albertsen, M. et al. Genome sequences of rare, uncultured bacteria obtained by differential coverage binning of multiple metagenomes. Nat Biotechnol 31, 533–538 (2013).
Article CAS Google Scholar - Tully, B. J. & Heidelberg, J. F. Potential Mechanisms for Microbial Energy Acquisition in Oxic Deep-Sea Sediments. Appl. Environ. Microbiol. 82, 4232–4243 (2016).
Article CAS Google Scholar - Quinlan, A. R. & Hall, I. M. BEDTools: a flexible suite of utilities for comparing genomic features. Bioinformatics 26, 841–842 (2010).
Article CAS Google Scholar - Sieber, C. M. K. et al. Recovery of genomes from metagenomes via a dereplication, aggregation, and scoring strategy. bioRxiv 107789, 1–24 (2017).
Google Scholar
Data Citations
- Tully, B. J. NCBI BioProject PRJNA391943 (2017)
- Tully, B. J. Figshare https://doi.org/10.6084/m9.figshare.5188273 (2017)
Acknowledgements
Funding was provided by the Center for Dark Energy Biosphere Investigations (C-DEBI) to B.J.T. and J.F.H. (OCE-0939654). As we have stated before, this project would have not been possible if not for the diligent commitment by the Tara Oceans consortium to allow for the open access of the data collected during the expedition. We only hope that this small dataset can be used by the scientific community at-large to increase the impact of this transformational research project. This is C-DEBI Contribution 407.
Author information
Authors and Affiliations
- Center for Dark Energy Biosphere Investigations, University of Southern California, Los Angeles, 90089, CA, USA
Benjamin J. Tully & John F. Heidelberg - Department of Biological Sciences, University of Southern California, Los Angeles, 90089, CA, USA
Elaina D. Graham & John F. Heidelberg
Authors
- Benjamin J. Tully
You can also search for this author inPubMed Google Scholar - Elaina D. Graham
You can also search for this author inPubMed Google Scholar - John F. Heidelberg
You can also search for this author inPubMed Google Scholar
Contributions
B.J.T. conceived of and designed the methodology, performed the analysis, wrote the paper, and prepared the figure and tables. E.D.G. performed the analysis and reviewed drafts of the paper. J.H.F. provided funding and resources to perform the analysis and reviewed drafts of the paper.
Corresponding author
Correspondence toBenjamin J. Tully.
Ethics declarations
Competing interests
The authors declare no competing financial interests.
ISA-Tab metadata
Supplementary information
Rights and permissions
Open Access This article is licensed under a Creative Commons Attribution 4.0 International License, which permits use, sharing, adaptation, distribution and reproduction in any medium or format, as long as you give appropriate credit to the original author(s) and the source, provide a link to the Creative Commons license, and indicate if changes were made. The images or other third party material in this article are included in the article’s Creative Commons license, unless indicated otherwise in a credit line to the material. If material is not included in the article’s Creative Commons license and your intended use is not permitted by statutory regulation or exceeds the permitted use, you will need to obtain permission directly from the copyright holder. To view a copy of this license, visit http://creativecommons.org/licenses/by/4.0/ The Creative Commons Public Domain Dedication waiver http://creativecommons.org/publicdomain/zero/1.0/ applies to the metadata files made available in this article.
About this article
Cite this article
Tully, B., Graham, E. & Heidelberg, J. The reconstruction of 2,631 draft metagenome-assembled genomes from the global oceans.Sci Data 5, 170203 (2018). https://doi.org/10.1038/sdata.2017.203
- Received: 17 July 2017
- Accepted: 13 November 2017
- Published: 16 January 2018
- DOI: https://doi.org/10.1038/sdata.2017.203