Comprehensive analysis of human subtelomeres with combined binary ratio labelling fluorescence in situ hybridisation (original) (raw)
Introduction
The extremely gene-rich human subtelomeric chromosome regions are unusually dynamic and contain variable patchworks of multichromosomal sequence blocks with extensive homologies, making interindividual variation in subtelomeres a source of genomic and phenotypic diversity.1 Submicroscopic subtelomeric chromosomal rearrangements represent a significant cause of unexplained mental retardation and are also described increasingly in neoplasias as well as in couples with recurrent spontaneous abortions.2,3,4 Thus, a comprehensive analysis of all 43 euchromatic subtelomeric regions in humans will facilitate theclinical diagnosis of considerable numbers of patients and phenotypes.
Due to the high number of relevant regions per patient and the large number of potential carriers, the development of accurate and efficient methods for subtelomere screening is called for. Among the methods used for the detection of unbalanced subtelomeric chromosome abnormalities are variable number of tandem repeat (VNTR) typing,5 modified comparative genomic hybridisation (CGH)6 and array-based CGH,7 short tandem repeat (STRP) typing,8 recently also in the form of automated fluorescent genotyping,9 as well as multiplex amplifiable probe hybridisation (MAPH).10 However, the most widely used method is fluorescence in situ hybridisation (FISH) which, in contrast to the techniques mentioned above, is additionally able to detect balanced aberrations. Their detection is important in neoplasia3 as well as for the identification of phenotypically normal carriers and diseaseassociated balanced chromosome rearrangements (DBCRs).
To date, most screenings for subtelomeric aberrations are performed with commercially available kits, which require 15–23 parallel hybridisations per patient. It would be advantageous for many clinical diagnostic situations to be able to perform a complete survey on fewer metaphases, for example, for cases with low mitotic indices, heterogeneous cell populations (such as in neoplasia) or small samples (such as blood samples from infants). Thus, the most promising approaches regarding versatility and methodology are multicolour FISH methods.
Our goal was the development of a sensitive and efficient subtelomeric multicolour FISH method capable of differentiating all 41 probes necessary for a comprehensive analysis of all subtelomeric regions. Every type of chromosomal aberration known for the subtelomeres, including pericentric inversions, should be detectable, even in the case of very distal breakpoints, in only two hybridisations per patient. In order to accommodate 41 probes in two hybridisations, we employed the COBRA (COmbined Binary RAtio labelling) principle. COBRA is a robust multicolour FISH technique that combines ratio and combinatorial labelling to attain especially high multiplicities, for example, up to 48 colours with only five spectrally separated fluorochromes.11,12 It has been used successfully in tumour and clinical cytogenetics as well as for differentially labelling all mouse chromosomes.13,14,15
Here, we show that Subtelomere COBRA FISH (S-COBRA FISH) allows colour discrimination of all euchromatic human short- and long-arm subtelomeric regions in only two hybridisations with four fluorochromes. We demonstrate the reliable detection of all types of intra- and interchromosomal subtelomeric rearrangements, allowing an extremely comprehensive analysis of these chromosome regions.
Material and methods
Probands
Metaphase preparations of six probands that had previously been determined to have no subtelomeric chromosome aberrations were used as negative controls.
As positive controls, metaphase preparations of 10 probands with subtelomeric chromosome rearrangements were used (Table 3). Six cases were analysed as blind studies: in four of them neither the type of aberration nor the affected chromosome region(s) were known. In two of these cases, chromosome material of unknown origin had been demonstrated and was to be identified by S-COBRA FISH. In the remaining four cases, the subtelomeric aberration was known beforehand.
Table 3 Cases successfully analysed by S-COBRA FISH
Patient 1 was ascertained due to growth retardation and hypoplastic patellae. The subtelomeric chromosome aberration was originally identified using the Chromoprobe MultiprobeT kit (Cytocell, Banbury, UK), as is the case for patients 4 and 6.
Patient 2a presented with severely delayed language development, hypoacousia and craniofacial dysmorphism (manuscript in preparation). Patient 2b is his normal mother.
Patient 3 was born after a normal pregnancy in gestational week 39 with a birth weight of 2060 g, a length of 47 cm and a head circumference of 34 cm. His motor development was slightly delayed (sitting with 2 years, walking with 2½ years). His language development was severely delayed with no talking at an age of 3 years. At an age of 6½ years his language is still partly unintelligible in spite of speech therapy. Further findings included a high forehead, broad root of the nose, epicanthal folds, hypotelorism, deep-set ears and clinodactyly. Cytogenetic investigations detected additional material in the terminal long-arm region of one chromosome 4 that could not be identified by CGH or multi-colour FISH.
Patient 4 presented with mental retardation and dysmorphic features.
Patient 5 was ascertained because of two children with multiple congenital aberrations and mental retardation. The birth measurements of the older child, a girl, were 2350 g, 46 cm (length) and 34 cm (head circumference). At the age of 17 months, her height was 71 cm (<third centile), her weight 7000 g and the head circumference 44.5 cm (third centile). The mental and statomotoric development was delayed with no unassisted sitting at the age of 17 months. Further findings included a unilateral cleft lip and median cleft palate, slight epicanthi, broad nasal root, dysplastic ears, small mouth, bilateral camptodactyly of third to fifth fingers and hypoplastic outer labia. Findings in the son included a broad nasal root, low-set ears, retrognathia, sandal creases and slight hypospadia. The subtelomeric aberration was tentatively diagnosed using the Vysis ToTelVysion kit and confirmed by S-COBRA FISH.
Patient 6 presented with microcephaly, short upper arms and anaemia.
Patient 7 was originally ascertained with a suspected Prader–Willi syndrome due to adipositas, developmental retardation and seizures. Prader–Willi syndrome was excluded and the karyotype was found to be normal. The subtelomeric aberration was diagnosed using the Vysis ToTelVysion kit and confirmed by S-COBRA FISH.
Patient 8 has been published previously16 (patient 4).
Patient 9 was born in the 37th gestational week after an uneventful pregnancy with a birth weight of 2300 g (<10th centile), a length of 48 cm (10th centile) and a head circumference of 32 cm (25th centile). An atrial septal defect type II was diagnosed, which closed spontaneously. He was able to sit with help at the age of 18 months and able to stand at the age of 2½ years. At the time of examination with 6½ years, the patient still walked only with support. In spite of normal hearing he had no speech development. The boy presented with hypotonia and severe mental retardation. His height was 107 cm (<third centile), weight 16 kg (<third centile) and the head circumference 46.5 cm (<second centile). Abnormal findings included frontal bossing, a long forehead, hypertelorism, deep-set eyes, epicanthal folds, a hypoplastic midface with flat nasal bridge, low-set, asymmetric ears with dysplastic helices, small mouth with downturned corners, prognathism, clinodactyly of the fifth fingers and syndactyly of the second and third toes, nail hypoplasia, cryptorchidism, scrotal hypoplasia and hirsutism.
COBRA labelling strategy
The S-COBRA labelling strategy accommodating all 41 subtelomeric large insert clone probes in two parallel hybridisations (designated probe sets A and B) is schematically shown in Figure 1. Ratio labelling identifies FISH targets on the basis of their fluorescence intensity ratios generated from defined pairwise mixtures of the so-called ratio fluorochromes.17 dGreen, Cy3 and Cy5 were used as ratio fluorochromes and denoted ‘green’, ‘red’ and ‘blue’, respectively. Most probes were ratio-labelled by pairwise mixing of two ratio fluorochromes with a ratio resolution of four, although in one case five ratio colours were generated (see below). From the three possible pairs of ratio fluorochromes, the so-called colour triangles were constructed (Figure 1, e.g. left-hand triangle in probe set B). In addition to these colours generated by pairwise mixing of two ratio fluorochromes (usually nine), a 10th colour was created by labelling one probe per triangle with all three ratio fluorochromes, resulting in a total of 10 different ratio colours per colour triangle generated from three ratio fluorochromes. To achieve higher multiplicities, the same three fluorochromes were used for the ratio labelling of a second set of 10 probes in an identical fashion (Figure 1, right-hand triangle in probe set B). These two triangles were discriminated by the presence or absence of an additional, spectrally distinct fluorochrome referred to as binary label (indicated by grey hatching in Figure 1). Thus a FISH signal was uniquely assigned to a probe by the combination of its ratio colour and the presence or absence of the binary label. Using only four fluorochromes, 20 different colours were achieved for probe set B. In order to reach a multiplicity of 21 for set A, an additional ratio colour was introduced, thus using a ratio resolution of five instead of four for ‘red’ and ‘green’ (Figure 1, left-hand triangle in probe set A).
Figure 1
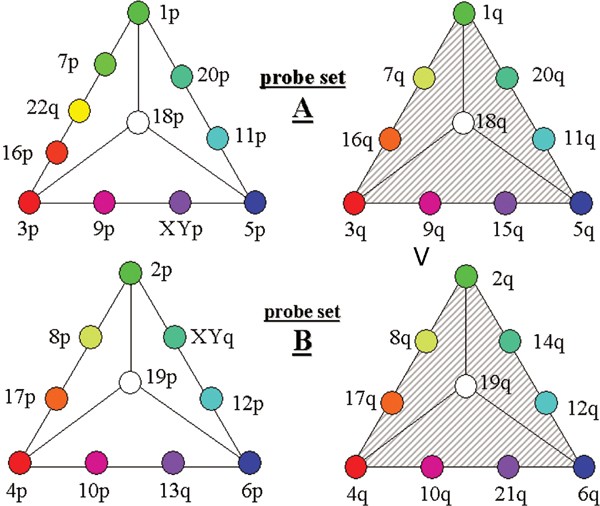
S-COBRA labelling scheme. The position in the triangles and the colour of the filled circles symbolise the ratio colours of the subtelomeric probes, for example, 2pter on the tip of the lower left-hand triangle (probe set B) is labelled purely ‘green’, 8pter is two-thirds ‘ green’ and one-third ‘red’, 17pter is one-third ‘green’ and two-thirds ‘red’ and so on. The 10th (or 11th) ratio colour generated from equal mixtures of all ratio colours is depicted as white in the centre of the triangles. The ratio colours of the left-hand triangles are used a second time for a different probe subset and distinguished from the first one by the binary label (shown as grey hatching, right-hand triangles in probe sets A and B). For example, in probe set A both the 1pter and 1qter probes are labelled with the same ratio colour (pure ‘green’) but only 1qter also carries the binary label.
FISH probes
P1 derived artificial chromosome (PAC) and bacterial artifical chromosome (BAC) clones for the FISH identification of chromosome ends were selected mainly from the ‘second-generation set’ of subtelomeric probes.18 BAC 420P11 for 19qter was selected from the RCPI11 library using the Ensembl Human Genome Browser (www.ensembl.org/Homo_sapiens/) and the NCBI Entrez Search and Retrieval System (www.ncbi.nlm.nih.gov/Entrez/). Probes were characterised in FISH experiments with one to three colours. Selection criteria were hybridisation efficiency, signal intensity and shape, no (or at the most weak) cross-hybridisations to telomeric regions, absence of polymorphisms and localisation of the probes. Except for 43N6 (9pter, 600 kb from the telomere), the clones are localised within 500 kb of the respective telomeres (Table 1). Their distance from the telomere varies from 7 to 600 kb, on average being 230 kb. Most clones were a generous gift of J Flint and R Regan (Oxford). The clones for 8pter, 9qter, 11pter, 14qter, 15qter and 17qter were purchased from Incyte Genomics (Palo Alto, CA, USA). The clone for Xpter/Ypter was obtained from CHORI BACPAC resources (Oakland, CA, USA). The clone for 19qter was generously supplied by M Drechsler (Düsseldorf).
Table 1 FISH probes used in S-COBRA FISH
Probe DNA isolation and labelling
Probe DNA was isolated according to a protocol published electronically by Bruce Roe, University of Oklahoma (www.genome.ou.edu/DblAcetateProcV3.html). Probe DNA was digested with DNAse I (Roche Diagnostics, Basel, Switzerland) to obtain fragment lengths of less than 700 basepairs (bp). The resulting DNA fragments were purified using QIAquick PCR purification kits (Qiagen, Hilden, Germany).
Probes were labelled with the Universal Linkage System (ULS)® labelling technique, yielding outstanding results regarding signal intensity, efficiency and reproducibility.19 dGreen-ULS (‘green’), Cy3-ULS (‘red’) and Cy5-ULS (‘blue’) were used as ratio fluorochromes (Kreatech Diagnostics, Amsterdam, The Netherlands). The binary label was dinitrophenyl (DNP)-ULS. All probes and portions of probes to be labelled with a given ULS were pooled in separate cocktails and then labelled according to the manufacturer's instructions (Table 2). Labelled DNA cocktails were purified using QIAquick PCR purification kits and co-precipitated with ethanol in the presence of 25 × excess human c0t1 DNA (Roche, Mannheim, Germany). The probe mixture was subsequently dissolved in 13 _μ_l 60% deionised formamide, 2 × SSC, 50 mM sodium phosphate pH 7.0, 10% dextran sulphate.
Table 2 S-COBRA labelling schemes for probe sets A (a) and B (b)
Hybridisation and image analysis
Multicolour FISH was performed essentially as described before.12 Dinitrophenyl-ULS was visualised with a LaserPro IR790-conjugated antibody (Molecular Probes, Leiden, The Netherlands) and an HQ-Cy7 fluorescence filter set (Chroma, Brattleboro, VT, USA).
Images were acquired and analysed essentially as described previously.11 A so-called ‘interactive stretch’ feature was incorporated in the image analysis software for the analysis of fluorescence intensity ratios of small FISH probes. The interactive stretch was performed on 16-bit images of the ‘green’, ‘red’ and ‘blue’ channels individually. The fluorescence intensity thresholds were set so that the autofluorescence of the chromosomes was included in the images as the lowest intensity and the most intense subtelomeric signal of each colour channel as the highest. The resulting stretching of the three channels and exclusion of background signals resulted in reproducible classification results even in suboptimal metaphases.
Results
After subtle fine tuning, the ratio resolution of S-COBRA FISH was sufficient to discriminate four to five BAC-sized targets with two ratio colours, as illustrated in the scatter plots of Figure 2. The specificity of S-COBRA FISH was further determined on six karyotypically normal controls. It correctly identified all 41 probes. No false-positive results were obtained. During this validation of the method, it was determined that ratio colours could nearly always (>94%) be distinguished by visual comparison of the merged images of ‘red’, ‘green’ and ‘blue’ alone, for example, the ratio colour for chromosome 20 was distinct from the one for chromosome 1 because it contained more ‘blue’ than the latter. The few remaining ambiguous classifications could either be clarified by visual analysis of more metaphases (up to four) or by scatter-plot analyses.
Figure 2
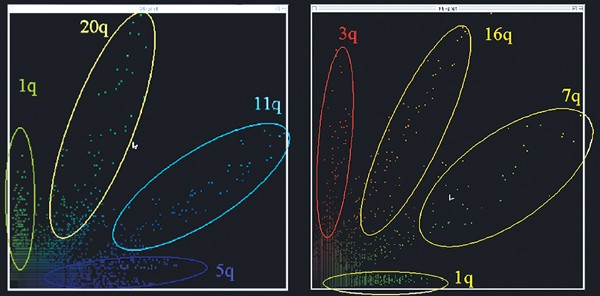
Examples for the unequivocal ratio resolution of four attained with BAC size probes in S-COBRA FISH. Typical two-dimensional dot plots of pixel intensities of BAC/PAC probes labelled with the ratio fluorochromes ‘green’ and ‘blue’ (a) respectively ‘red’ and ‘green’ (b).
The specificity of the method was tested successfully on different batches of isolated probes in order to make sure that the method would not have to be modified when using newly isolated probe DNA. The ratio resolution of four instead of five used in classical COBRA allowed for the slight ratio changes caused by batch to batch variation.
Since decreasing hybridisation efficiencies exponentially raise the number of metaphases needed for a complete screening, high hybridisation efficiencies are critical for the simultaneous detection of many FISH probes. The hybridisation efficiency of the probes used in S-COBRA FISH was determined in at least five independent experiments. For the large majority of probes it was higher than 95%: 24 probes had hybridisation efficiencies between 95 and 97%, and 14 between 97 and 99%. Only three probes (10qter, 18pter and 18qter) had hybridisation efficiencies lower than 95%.
The high specificity and hybridisation efficiency of S-COBRA FISH allowed for the complete analysis of 21 and 20 probes per hybridisation, respectively, with no more than four metaphases being required for each. Due to the metaphase preparation quality, the results of up to three probes had to be verified in approximately every second case. Verification experiments were performed as targeted one- to three-colour FISH experiments. Depending on preparation quality, image capture and analysis could be performed in less than 90 minutes per S-COBRA hybridisation. If more metaphases were needed, for example, for the detection of mosaic aberrations, 20–50 metaphases per hybridisation region could be analysed.
Having established that S-COBRA FISH correctly identified all subtelomeric regions in normal metaphases, we applied it to the analysis of a wide range of inter- and intrachromosomal subtelomeric chromosome rearrangements (3). The majority of analyses was performed either as a blind study (cases 1, 4, 6 and 7) or with the aim of identifying additional chromosome material of unknown origin (cases 3 and 9). All 10 cases were analysed successfully. No false-positive or false-negative results were obtained. The following aberration types were diagnosed by S-COBRA FISH: Unbalanced translocations as in cases 1, 2a and 3 (Figure 3b and Figure 4c), balanced translocations as in cases 2b, 4 and 5 (Figure 3a,Figure 4a and Figure b) as well as deletions as in cases 6, 7 and 8 (Figure 4d). Case 9 illustrates the ability of S-COBRA FISH to analyse intrachromosomal aberrations such as pericentric inversions (Figure 4e). Additionally, the high efficiency of S-COBRA FISH allowed the identification of a previously unknown mosaic: only 11 out of 16 cells analysed showed the aberration, the remaining five giving a normal signal pattern. Thus, mosaics with relatively high percentages of aberrant cells can be detected by S-COBRA FISH. The method also proved to be robust when analysing low-quality metaphase preparations. As illustrated by case 2a (Figure 3b), even relatively nonuniform and granular hybridisations allowed the unequivocal analysis of all euchromatic subtelomere regions with only four metaphases per hybridisation.
Figure 3
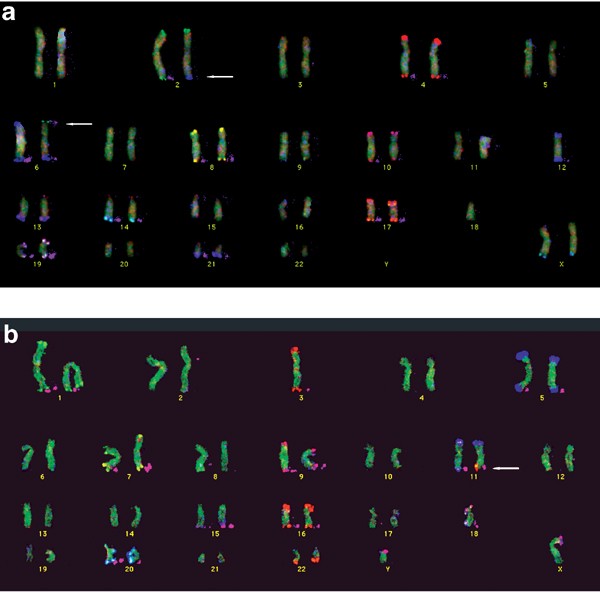
Karyograms of metaphases analysed with S-COBRA FISH. (a) (Top): probe set B (euchromatic subtelomeric regions of chromosomes 2, 4, 6, 8, 10, 12, 13, 14, 17, 19, 21 and XqYq). (b) (Bottom): probe set A (euchromatic subtelomeric regions of chromosomes 1, 3, 5, 7, 9, 11, 15, 16, 18, 20, 22 and XpYp). Ratio signals are shown on the chromosomes, binary signals are shown in pink to the right of the chromosomes. For the labelling scheme see Figure 1. Weak or ambiguous signals and missing chromosomes in the depicted metaphases were successfully analysed in other metaphases. Signals at the short-arm regions of acrocentric chromosomes are due to cross-hybridisations and were not analysed. (a) Karyogram of case 4 after hybridisation with probe set B showing a balanced reciprocal translocation of 2qter and 6pter signals (arrows). (b) Karyogram of case 2a after hybridisation with probe set A showing unbalanced reciprocal translocation of 16qter signal onto 11qter (arrow). Even low-quality metaphases with granular hybridisation are analysed reliably: while in this metaphase the 16qter ratio signals at first glance may be confused with the 22qter signals, they are clearly differentiated by the binary signal present only in 16qter.
Figure 4
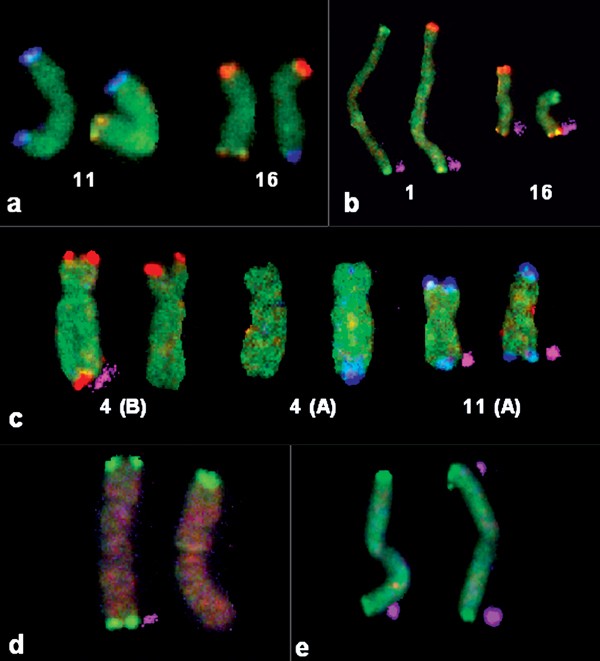
Partial karyograms showing examples of detected balanced (a, b) and unbalanced (c) translocations, deletions (d) and inversions (e). Derivative chromosomes are shown on the right. Binary signals are shown in pink shadows to the right of the chromosomes. (a) Case 2b: Results of probe set A showing the balanced reciprocal translocation of 11qter and 16qter signals. (b) Case 5: Results of probe set A showing the balanced reciprocal translocation of 1pter and 16pter signals. (c) Case 3: Results of probe set B showing the missing signal 4qter (left) and probe set A showing the 11pter signal in 4qter (middle) as well as the normal chromosomes 11 (right). The unknown additional material present in 4qter was thus successfully identified as being derived from distal 11p15. (d) Case 6: Deletion 1qter (probe set A). (e) Case 9: Unbalanced pericentric inversion 1 with monosomy 1pter and partial trisomy 1qter (probe set A) observed in 11 out of 16 cells analysed. While the ratio signals of involved probes are identical, the pter and qter signals are distinguished by the binary label demonstrating that both ends of the derivative chromosome 1 carry 1qter signals. Thus, the unknown additional material present in 1pter was demonstrated to be derived from distal 1q.
Discussion
Here we have shown that with S-COBRA FISH, differential FISH staining of all euchromatic subtelomeric regions is feasible with four fluorochromes in two parallel hybridisations when using BAC and PAC size probes. The incorporation of a fifth fluorochrome as a second binary label would even allow the analysis of all 41 subtelomeric probes in only one hybridisation.
We conclude on the basis of these results that our S-COBRA FISH strategy considerably enhances the efficiency of analysis in comparison to commercially available methods or other techniques, which detect only two to three probes simultaneously. Nevertheless, S-COBRA FISH is as comprehensive as these methods. This is, on the one hand, due to the fact that it also uses well-characterised large genomic insert clones, which are on average localised 230 kb from the respective telomeres,18 guaranteeing optimal resolution limits. S-COBRA FISH, on the other hand, is also able to identify each probe by a specific colour. In contrast to this, most other subtelomeric multicolour FISH techniques use the same colour for both the long- and the short-arm regions of non-acrocentric chromosomes and thus, unlike S-COBRA FISH, are unable to detect subtelomeric pericentric inversions.20,21 Since such cryptic pericentric inversions exist both as constitutional aberrations and in neoplasia,22,23,24,25 colour discrimination of all subtelomeric regions, including differentiation between p and q arm signals, is desirable for a comprehensive analysis. This was first achieved by an elegant two-step approach with two different subtelomeric probe sets.26 In the first step of this method, highly complex probes 5–10 megabases (Mb) in size were used. Using combinatorial labelling with seven fluorochromes, chromosome-specific labels were obtained, which were identical for both chromosome ends. A second, two-colour hybridisation using a BAC size probe panel provided differentiation of p and q arms by labelling all short-arm probes green and all long-arm probes red. Thus, the resolution limit for translocations between regions with identical labels in the second hybridisation (two short chromosome arms or two long arms) is determined by the highly complex probes of the first hybridisation. Since the resolution limit of combinatorial FISH with complex probes and seven fluorochromes is between 320 kb and 2.6 Mb27 and subtelomeric chromosome aberrations can be as small as 50, 100 and 130 kb,5,28,29 underdiagnosis of very small aberrations may represent a drawback of using probes as complex as 10 Mb. S-COBRA FISH can detect small aberrations more reliably because its resolution limit is solely determined by the localisation of its large insert clone probes, which are, on average, localised only 230 kb from the telomere.
In contrast to DNA-based screening methods that detect subtelomeric copy number changes very efficiently, such as MAPH and array CGH,7,10 S-COBRA FISH, like other FISH methods, has the advantage of detecting balanced rearrangements. The ability of S-COBRA FISH to detect efficiently all types of balanced and unbalanced aberrations makes it the most comprehensive diagnostic procedure for human subtelomeric chromosome regions reported to date.
References
- Mefford HC, Trask BJ : The complex structure and dynamic evolution of human subtelomeres. Nat Rev Genet 2002; 3: 91–102.
Article CAS Google Scholar - Knight SJ, Regan R, Nicod A et al: Subtle chromosomal rearrangements in children with unexplained mental retardation. Lancet 1999; 354: 1676–1681.
Article CAS Google Scholar - Brown J, Jawad M, Twigg SR et al: A cryptic t(5;11)(q35;p15.5) in 2 children with acute myeloid leukemia with apparently normal karyotypes, identified by a multiplex fluorescence in situ hybridization telomere assay. Blood 2002; 99: 2526–2531.
Article CAS Google Scholar - Yakut S, Berker-Karauzum S, Simsek M, Zorlu G, Trak B, Luleci G : Telomere-specific fluorescence in situ hybridization analysis of couples with five or more recurrent miscarriages. Clin Genet 2002; 61: 26–31.
Article CAS Google Scholar - Flint J, Wilkie AO, Buckle VJ, Winter RM, Holland AJ, McDermid HE : The detection of subtelomeric chromosomal rearrangements in idiopathic mental retardation. Nat Genet 1995; 9: 132–140.
Article CAS Google Scholar - Ghaffari SR, Boyd E, Tolmie JL, Crow YJ, Trainer AH, Connor JM : A new strategy for cryptic telomeric translocation screening in patients with idiopathic mental retardation. J Med Genet 1998; 35: 225–233.
Article CAS Google Scholar - Veltman JA, Schoenmakers EF, Eussen BH et al: High-throughput analysis of subtelomeric chromosome rearrangements by use of array-based comparative genomic hybridization. Am J Hum Genet 2002; 70: 1269–1276.
Article CAS Google Scholar - Slavotinek A, Rosenberg M, Knight S et al: Screening for submicroscopic chromosome rearrangements in children with idiopathic mental retardation using microsatellite markers for the chromosome telomeres. J Med Genet 1999; 36: 405–411.
CAS PubMed PubMed Central Google Scholar - Rio M, Molinari F, Heuertz S et al: Automated fluorescent genotyping detects 10% of cryptic subtelomeric rearrangements in idiopathic syndromic mental retardation. J Med Genet 2002; 39: 266–270.
Article CAS Google Scholar - Sismani C, Armour JA, Flint J, Girgalli C, Regan R, Patsalis PC : Screening for subtelomeric chromosome abnormalities in children with idiopathic mental retardation using multiprobe telomeric FISH and the new MAPH telomeric assay. Eur J Hum Genet 2001; 9: 527–532.
Article CAS Google Scholar - Tanke HJ, Wiegant J, van Gijlswijk RP et al: New strategy for multi-colour fluorescence in situ hybridisation: COBRA— COmbined Binary RAtio labelling. Eur J Hum Genet 1999; 7: 2–11.
Article CAS Google Scholar - Wiegant J, Bezrookove V, Rosenberg C et al: Differentially painting human chromosome arms with combined binary ratio-labeling fluorescence in situ hybridization. Genome Res 2000; 10: 861–865.
Article CAS Google Scholar - Fodde R, Kuipers J, Rosenberg C et al: Mutations in the APC tumour suppressor gene cause chromosomal instability. Nat Cell Biol 2001; 3: 433–438.
Article CAS Google Scholar - Bezrookove V, Hansson K, van der Burg M et al: Individuals with abnormal phenotype and normal G-banding karyotype: improvement and limitations in the diagnosis by the use of 24-colour FISH. Hum Genet 2000; 106: 392–398.
Article CAS Google Scholar - Jin C, Martins C, Jin Y et al: Characterization of chromosome aberrations in salivary gland tumors by FISH, including multicolor COBRA-FISH. Genes Chromosomes Cancer 2001; 30: 161–167.
Article CAS Google Scholar - Weise A, Starke H, Heller A et al: Chromosome 2 aberrations in clinical cases characterised by high resolution multicolour banding and region specific FISH probes. J Med Genet 2002; 39: 434–439.
Article CAS Google Scholar - Morrison LE, Legator MS : Two-color ratio-coding of chromosome targets in fluorescence in situ hybridization: quantitative analysis and reproducibility. Cytometry 1997; 27: 314–326.
Article CAS Google Scholar - Knight SJ, Lese CM, Precht KS et al: An optimized set of human telomere clones for studying telomere integrity and architecture. Am J Hum Genet 2000; 67: 320–332.
Article CAS Google Scholar - Wiegant JC, van Gijlswijk RP, Heetebrij RJ, Bezrookove V, Raap AK, Tanke HJ : ULS: a versatile method of labeling nucleic acids for FISH based on a monofunctional reaction of cisplatin derivatives with guanine moieties. Cytogenet Cell Genet 1999; 87: 47–52.
Article CAS Google Scholar - Brown J, Saracoglu K, Uhrig S, Speicher MR, Eils R, Kearney L : Subtelomeric chromosome rearrangements are detected using an innovative 12-color FISH assay (M-TEL). Nat Med 2001; 7: 497–501.
Article CAS Google Scholar - Henegariu O, Artan S, Greally JM et al: Cryptic translocation identification in human and mouse using several telomeric multiplex fish (TM-FISH) strategies. Lab Invest 2001; 81: 483–491.
Article CAS Google Scholar - Anderlid BM, Schoumans J, Anneren G et al: Subtelomeric rearrangements detected in patients with idiopathic mental retardation. Am J Med Genet 2002; 107: 275–284.
Article Google Scholar - Baker E, Hinton L, Callen DF et al: Study of 250 children with idiopathic mental retardation reveals nine cryptic and diverse subtelomeric chromosome anomalies. Am J Med Genet 2002; 107: 285–293.
Article Google Scholar - Wlodarska I, De Wolf-Peeters C, Falini B et al: The cryptic inv(2)(p23q35) defines a new molecular genetic subtype of ALK-positive anaplastic large-cell lymphoma. Blood 1998; 92: 2688–2695.
CAS Google Scholar - Clarkson B, Pavenski K, Dupuis L et al: Detecting rearrangements in children using subtelomeric FISH and SKY. Am J Med Genet 2002; 107: 267–274.
Article Google Scholar - Fauth C, Zhang H, Harabacz S et al: A new strategy for the detection of subtelomeric rearrangements. Hum Genet 2001; 109: 576–583.
Article CAS Google Scholar - Azofeifa J, Fauth C, Kraus J et al: An optimized probe set for the detection of small interchromosomal aberrations by use of 24-color FISH. Am J Hum Genet 2000; 66: 1684–1688.
Article CAS Google Scholar - Wong AC, Ning Y, Flint J et al: Molecular characterization of a 130-kb terminal microdeletion at 22q in a child with mild mental retardation. Am J Hum Genet 1997; 60: 113–120.
CAS PubMed PubMed Central Google Scholar - Anderlid BM, Schoumans J, Anneren G et al: FISH-mapping of a 100-kb terminal 22q13 deletion. Hum Genet 2002; 110: 439–443.
Article Google Scholar
Acknowledgements
This work was supported by the Deutsche Forschungsgesellschaft (DFG) (Pr 131/19-1 and EN 435/1-1), the Richard-Winter-Stiftung, the Doktor Robert Pfleger-Stiftung, the University of Bonn (BONFOR program) and Kreatech Diagnostics (Amsterdam, The Netherlands). SZ was supported by a graduate scholarship of the federal state Nordrhein-Westfalen.
We thank Jonathan Flint and Regina Regan (Institute of Molecular Medicine, John Radcliffe Hospital, Oxford), Jan Wauters (Centrum Medische Genetica, University of Antwerp, Belgium), Thomas Liehr and Heike Starke (Institute of Human Genetics and Anthropology, Jena, Germany) as well as Matthias Drechsler (Institute of Human Genetics and Anthropology, University of Düsseldorf, Germany) for generously providing and exchanging subtelomeric clones. Gabriele Gillessen-Kaesbach, Dagmar Wieczorek and Beate Albrecht (Institute of Human Genetics, University of Essen, Germany), Thomas Liehr (Institute of Human Genetics and Anthropology, Jena, Germany) as well as Matild Dobos (Second Department of Pediatrics, Semmelweis University, Budapest, Hungary) generously supplied metaphase preparations of patients with subtelomeric chromosome aberrations.
Author information
Authors and Affiliations
- Institute of Human Genetics, University of Bonn, Wilhelmstrasse 31, Bonn, D-53111, Germany
Hartmut Engels, Antje Ehrbrecht, Susanne Zahn, Kristin Bosse, Gesa Schwanitz & Peter Propping - Department of Molecular Cell Biology, Laboratory for Cytochemistry and Cytometry, Leiden University Medical Center, Leiden, The Netherlands
Hartmut Engels, Hans Vrolijk, Hans J Tanke, Joop Wiegant & Anton K Raap - Department of Human and Clinical Genetics, Leiden University Medical Center, Leiden, The Netherlands
Stefan White - Max Planck Institute for Molecular Genetics, Berlin, Germany
Vera Kalscheuer - Department of Clinical Genetics, University of Amsterdam, Amsterdam, The Netherlands
Jan M N Hoovers
Authors
- Hartmut Engels
You can also search for this author inPubMed Google Scholar - Antje Ehrbrecht
You can also search for this author inPubMed Google Scholar - Susanne Zahn
You can also search for this author inPubMed Google Scholar - Kristin Bosse
You can also search for this author inPubMed Google Scholar - Hans Vrolijk
You can also search for this author inPubMed Google Scholar - Stefan White
You can also search for this author inPubMed Google Scholar - Vera Kalscheuer
You can also search for this author inPubMed Google Scholar - Jan M N Hoovers
You can also search for this author inPubMed Google Scholar - Gesa Schwanitz
You can also search for this author inPubMed Google Scholar - Peter Propping
You can also search for this author inPubMed Google Scholar - Hans J Tanke
You can also search for this author inPubMed Google Scholar - Joop Wiegant
You can also search for this author inPubMed Google Scholar - Anton K Raap
You can also search for this author inPubMed Google Scholar
Corresponding author
Correspondence toHartmut Engels.
Rights and permissions
About this article
Cite this article
Engels, H., Ehrbrecht, A., Zahn, S. et al. Comprehensive analysis of human subtelomeres with combined binary ratio labelling fluorescence in situ hybridisation.Eur J Hum Genet 11, 643–651 (2003). https://doi.org/10.1038/sj.ejhg.5201028
- Received: 31 October 2002
- Revised: 24 March 2003
- Accepted: 02 April 2003
- Published: 26 August 2003
- Issue Date: 01 September 2003
- DOI: https://doi.org/10.1038/sj.ejhg.5201028