Reduced genetic structure of the Iberian peninsula revealed by Y-chromosome analysis: implications for population demography (original) (raw)
Introduction
The genealogical resolution recently achieved for mitochondrial DNA (mtDNA) and Y-chromosome binary markers has facilitated world-wide1, 2, 3 and regional4, 5, 6 studies of human history and dispersals from matrilineal and patrilineal perspectives. According to archaeological data, most variation studies support the theory that the genetic landscape of Europe has been shaped by two main influences from the Levant:7 one occurring during the Upper Palaeolithic period, when anatomically modern humans entered the continent around 40 000 years ago; the second occurring more recently, around 10 000 years ago, with the spread of early farmers from the Near East during the Neolithic period. In addition, the Mesolithic expansion from isolated population nuclei,8 that followed the Last Glacial Maximum (LGM), may also have affected the European genetic background.6, 9, 10 Despite the debate about the extent to which these demographic processes have affected the present European genetic pool,4 both old and more recent processes must have influenced the current gene pool to generate the geographical frequency gradients that have been observed all over Europe.4, 7, 10
The Iberian peninsula, at the Southwestern part of Europe (Figure 1a), is considered to be the region with less Neolithic impact, based on archaeological and genetic evidence. Their Palaeolithic component, with the Basques being the most outstanding representative, have been pointed out by classical markers,7, 11 mtDNA studies12, 13, 14, 15 and Y-chromosome variation.10, 16, 17, 18 Furthermore, Alonso and Armour19 found that the Basques diverged from other Europeans by retaining less diversity and having a greater proportion of ancestral (Palaeolithic) autosomal alleles. However, the presence in high frequency of a number of rare haplotypes, both in mtDNA12, 14 and Y-chromosome18 analysis, suggests that the action of genetic drift may have accentuated their distinctiveness. Owing to their characteristic genetic variation, the Basques have often received considerable attention in genetic studies of Western Europe, in detriment of the genetic characterization of the rest of Iberian populations. Outside a European context, some studies have investigated the degree of African gene flow in Iberian populations.20, 21, 22, 23 Although classical markers have failed to detect this influence,11 roughly 10% of Iberian mtDNA and Y-chromosome haplotypes have been found to be of African origin.13, 15, 24, 25, 26, 27, 28, 29 Moreover, unlike the rest of Europe, the presence of markers with probable North African origin, the mtDNA U613, 30 and the Y-chromosome E3b,26 points to a specific Northwest African influence in Iberia.4, 25, 26, 27, 28, 29
Figure 1
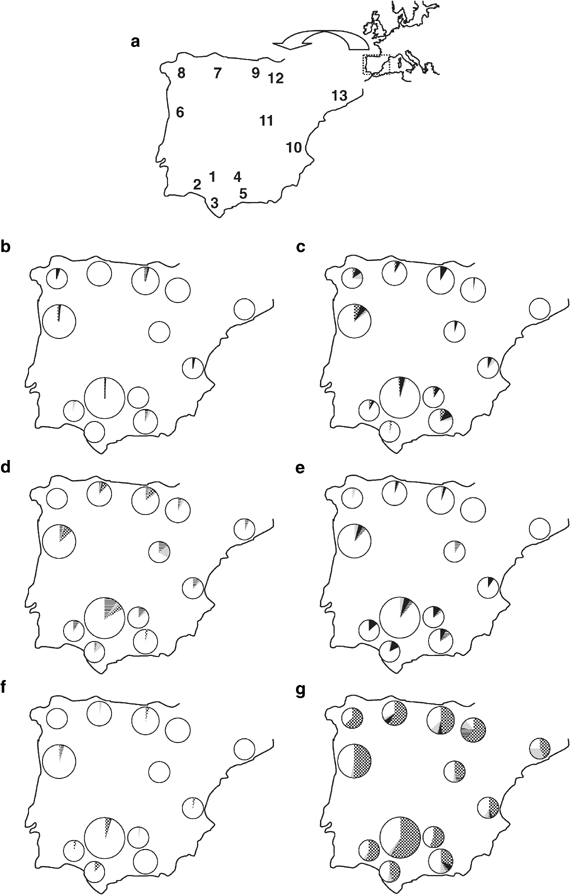
Sampled populations and Y-chromosome Hg frequencies in Iberia. (a) Approximate geographic locations of sampling sites. Code numbers are referred to in Table 1. (b–g) Pie charts, with areas proportional to the number of sampled individuals, of phylogenetically related Hg's by population: (b) BC* (chequered), DE*(xE3) (transversals), E3* (black) and E3a (grey); (c) E3b1 (chequered), E3b2 (black), E3b3* (transversals) and E3b3a (grey); (d) F* (black), G (chequered), I*(xI1b2) (transversals) and I1b2 (grey); (e) J*(xJ2) (grey), J2*(xJ2f) (black) and J2f (transversals); (f) K* (grey), K2 (chequered), N3a (black) and P*(xR1) (transversals); (g) R1a (black), R1* (chequered), R1b3d (transversals) and R1b3f (grey). The three unassigned Catalan chromosomes are not represented.
If Iberian populations have been affected by the same demographic processes that have clinally shaped the genetic variation landscape deduced from continent-wide studies, Y-chromosome diversity analysis, with well-known phylogeographical patterns, could be able to detect the existence of marker gradients even in such a regional scale. With this in mind, we conducted a comprehensive high-resolution survey of Y-chromosome diversity in the largest and most diverse Iberian sample studied to date. This has allowed us to determine the genetic structure and affinities between Iberian populations, to examine if nonrandom patterns of variation exist and to interpret these findings in the light of the demographic processes that have taken place in Europe.
Materials and methods
Samples
DNA isolated from blood samples from 568 unrelated Iberian males were analysed. Appropriate informed consent and information as to birthplace of paternal grandfather were obtained from all participants. Individuals analysed included: 109 from Northern Portugal, 19 from Galicia, 60 from Leon, 70 from Cantabria, 21 from Castile, 31 from Valencia and 258 from Andalusia. These were further subdivided into the following: 155 from Seville, 22 from Huelva, 28 from Cadiz, 27 from Cordoba and 26 from Malaga. In addition, Northern Iberian samples from the Basque Country (45 from Underhill et al31) and Catalonia (16 from Bosch et al26) were incorporated, raising the sample size to 629 chromosomes. The approximate geographic locations of the samples are represented in Figure 1a.
Polymorphism genotyping
We used a total of 26 markers of the nonrecombining portion of the Y-chromosome validated in European populations in previous studies.10, 18, 31 Markers typed include YAP (an Alu insertion), the 12f2 deletion and 24 base substitutions: M2, 92R7, _SRY_10831.1, _SRY_10831.2, _SRY_2627, Tat, P2, M9, M13, M26, M34, M52, M67, M70, M78, M81, M89, M123, M153, M170, M172, M173, M178 and M201. All markers were typed as described in Flores et al32 except M178, which was sequenced in both strands (BigDye Terminator Kit v.3) using an ABI PRISM 310 Genetic Analyzer (Applied Biosystems, Foster City, CA, USA). We typed nine phylogenetically basal markers in all individuals (SRY10831.1, YAP, M89, P2, M9, M201, M170, 12f2 and 92R7). The rest of markers were typed following the hierarchy of the phylogeny. Haplogroups (Hg's) were identified by lineage (Figure 2) following standardized nomenclature guidelines.33
Figure 2
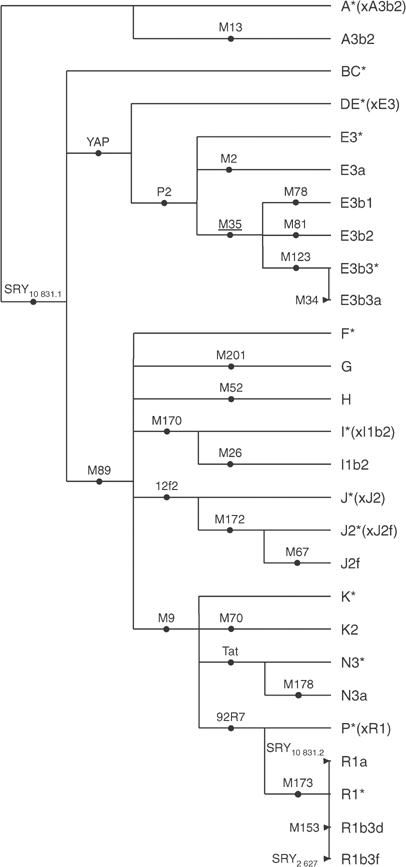
Phylogenetic relationships and nomenclature of the Y-chromosome Hg's. Defining markers are shown on branches; the status of the underlined marker was inferred.
Software and statistical analysis
ARLEQUIN 200034 was used to test the variability among populations based on Hg frequencies applying a hierarchical analysis of molecular variance (AMOVA). Spatial analysis of molecular variance (SAMOVA)35 was used to obtain the groups of studied populations that maximize the proportion of variance. PHYLIP package was used to calculate Reynolds _F_ST genetic distance.36 ARLEQUIN 2000 was also used to obtain the heterogeneity estimates by population (H) and to assess the Mantel tests of the correlation between geographical and Reynolds _F_ST genetic distances (1000 permutation steps). Geographic distances were calculated as great circle distances (km) from the geographical coordinates at Great Circle Distance Web site (http://www.argray.org/dist/index).
Spatial autocorrelation analyses were performed by means of the _A_utocorrelation _I_ndex for _D_NA _A_nalysis, AIDA.37 Autocorrelation coefficients (II) were calculated at varying distance classes (four to 10), but always keeping the same number of pairwise comparisons in each class. Statistical significance of II values was assessed from 10 000 permutations. It is known that plots of II vs geographical distance classes yield correlograms with varying shapes under different evolutionary scenarios.37 Geographical patterns of genetic diversity were also examined using the principal component analysis, as performed by SPSS v.9 (SPSS, Inc.). This software was also used to perform linear regressions.
Results
We combined the allelic states at each of the 26 biallelic markers typed and constructed 27 stable compound Hg's with a shared common ancestry (Figure 2). Of these Hg's, 23 were found in 629 individuals from 13 locations in the Iberian peninsula (Table 1, Figure 1b–g). Four Hg's – A3b2, A*(xA3b2), H and N3* – were not detected in the entire sample set. Nearly all individuals (99.4%) belonged to groups E (10.8%) and F (88.6%). The latter included R, the most frequent group of the area (61.4%). Hg R1*, which is known to be the most common in Western Europe,10, 18 belongs to this group and defined more than 50% of Iberian Y chromosomes, being the most frequent Hg in all populations (range 31–63.1%). Several other Hg's exhibited relatively high frequencies (>10%), but only in some populations: E3b2, E3b3a, I*(xI1b2), I1b2, J2*(xJ2f), K2, R1b3d and R1b3f. Heterogeneity estimates by population (Table 1) are similar, with values ranging from 0.585±0.076 obtained for the Basque region to 0.889±0.047 obtained for Malaga, with no differences (_P_=0.159, Mann–Whitney _U_-test) between northern (Galicia, Northern Portugal, Leon, Cantabria, Catalonia and Basque Country) and southern (Seville, Huelva, Cadiz, Cordoba and Malaga) regions.
Table 1 Y-chromosome Hg frequencies (%) and heterogeneities (H±SD) in Iberian populations
Overall, some geographical clustering of Hg frequencies was notable. According to previous data, R chromosomes tended to be more frequent in the Cantabrian fringe (Figure 1g).10, 18, 38 In contrast to Hurles et al,39 Hg R1b3f was frequently detected and with a widespread distribution (Figure 1g). On the other hand, I chromosomes reached their highest frequencies in Andalusia and Eastern Iberia (Figure 1d), although Hg I1b2 reached a frequency in Castile comparable to that reported for Sardinia, which is the highest in Europe.10, 28, 40 Since STR information for the Catalonian sample is available26 and DYS388⩾15 repeat alleles can be used as a proxy for J background,41 we estimated 6.2% of J chromosomes in this sample. Taking this value, or the 4.2% previously reported for an independent sample,10 as an approximate frequency of these Hg's in Catalonia, J chromosomes show a trend of decreasing frequencies in Mediterranean coastal populations, from 17.9 to 11% in Andalusia, 9.7% in Valencia, to the lowest frequency in Catalonia (Figure 1e), although with nonsignificant differences between the two extremes (_P_=0.193, Fisher's exact test). With regard to Hg's E3b1 and E3b2, they were widespread in Iberia (Figure 1c), reaching similar frequencies (_P_=0.170, Fisher's exact test) in both the Andalusian and Cantabrian fringes, but having a minimal frequency (2.2%) in the Basques.
Consistent with the previous findings of Brion et al,42 the overall value of the variance obtained between the 13 Iberian populations was low: 1.2%, P<0.010. SAMOVA analysis was undertaken assuming two and three groups. In the first case, Basque Country was separated from the rest of Iberians yielding 1.6% of intergroup variance, although this value was not significant (_P_>0.05). In the second case, Basque Country, Catalonia and the rest of Iberians formed the three groups, which resulted in a statistically significant maximum variance (2.5%, P<0.05). However, Mantel test revealed that there is a correlation between geographical and Y-chromosome-based genetic distances (_r_=0.36, P<0.001), as in the rest of Europe.18
The autocorrelation index (II) was also used for evaluating patterns of geographical variation. Although plot raggedness incremented with the number of classes, all correlograms obtained from the Iberian Y-chromosome data were very similar, showing significant positive values at short distances and significant negative at long distances. One of these correlograms is represented in Figure 3a, showing significant positive values at 0–246 km distances, decreasing to significantly negative values at 909 km. To explore if this pattern could be explained by the distribution of a certain frequent Hg, we reran AIDA again, removing from the data one frequent Hg at a time (ie with >10% in at least one population), but all the patterns obtained were similar (not shown). We next examined the plot of geographical vs genetic distances (Figure 3b) and, although a relatively high regression coefficient was obtained (0.36, P<0.001, Mantel test), we noted that the greater distances (falling above the upper limit of 95% CI of the distribution) were due to just five populations: the Basque Country, Catalonia, Malaga, Galicia and Castile. Thus, it seemed that a minority of genetic distances (33%) were responsible for most of the correlation. After removing these outstanding values from the distribution, the regression coefficient turned nonsignificant (0.20, _P_=0.153, Mantel test). To explore the influence of these five populations in the autocorrelation analysis, we repeated AIDA, but this time excluding one of them at a time. The results without Galicia or Castile did not change. When Catalonia or Malaga were removed, the larger distance class turned nonsignificant. However, when the Basque Country was omitted from the analysis, all autocorrelation values were nonsignificant (not shown). Although the outlier behaviour of these populations could be attributed to their small sample sizes, given that 100% of statistically significant _F_ST genetic distances involved them, that previously analysed population groups added considerable heterogeneity to the region38 and that our knowledge of Iberian Y-chromosome pool is still limited, these results point to some degree of heterogeneity in Iberia. A more thorough sampling in these areas, especially in Basque Country where some heterogeneity among districts have been detected,43 could shed some light to this differentiation pattern. Recent findings in Italy and Greece44 support that Y-chromosome heterogeneity in such local regions are organized on focal rather than clinal distributions as deduced from studies on larger spatial scales.
Figure 3
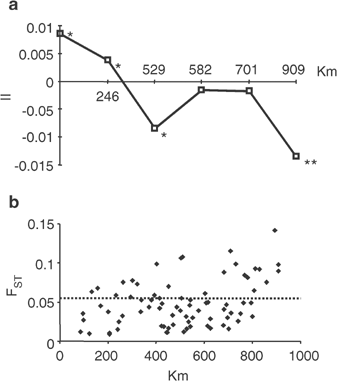
Genetic differentiation with distance. (a) Correlogram of II autocorrelation values (_Y_-axis) with distance classes (_X_-axis). The significant points are denoted by one (P<0.05) or two (P<0.01) asterisks. (b) Scatter plot of geographic and genetic distances. Points above dotted line are genetic distances with values above the upper value of 95% CI.
The Y-chromosome variation landscape in Iberia was also evaluated using principal component analysis, which included samples with highly resolved Y-chromosome data from Europe (78 Sardinians45 and 26 Normans, unpublished), Near East (30 Turks, 139 Iraqis, 31 Lebanese and 20 Syrians from Al-Zahery et al,46 and unpublished data from 146 Jordanians (V Cabrera and N Karadsheh, personal communication)), and Northwest Africa (29 Arabs and 46 Berbers from Morocco, 24 Saharans and 36 Mauritanians, unpublished). The first two components of the analysis accounted for 83.9% of genetic variance, and produced three well-separated clusters of populations, evidencing the sharp differences between the Y-chromosome pool of Western Europe, Near East and Northwest Africa (Figure 4). The main determinant Hg's of the clustering are Hg R1*(xR1a), which plays an important role in both components, Hg's J*(xJ2) and J2, and E3*(xE3a). Hg R1*(xR1a) reach high frequencies in Iberia and west European populations,10 whereas J*(xJ2)/J2 and E3*(xE3a) have a low incidence and, in turn, are related to populations from the Near East and Northwest Africa, respectively. Hg G, which together with groups J and E are related to the genetic influence from Near East during the Neolithic,10, 47 does not play an important role in the clustering of these populations.
Figure 4
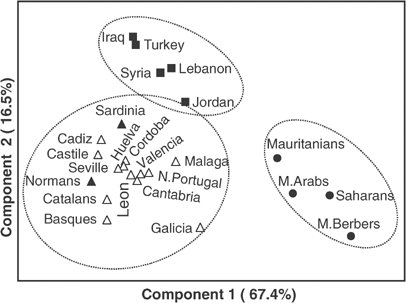
The principal component plot (accounting for 83.9% of variance) of Y-chromosome Hg frequency data. White triangles represent Iberian populations, black triangles other European populations, black boxes represent Near Eastern populations and black circles Northwest Africans. The circles represent regional groupings based primarily on geography.
Discussion
Archaeological,48, 49 mtDNA12 and Y-chromosome data18 corroborate the view that Neolithic contributions are expected to diminish towards Western Europe. Although little is known about the Neolithic impact in Mesolithic populations from Iberia, Basques are generally considered to have received a very limited input of Near Eastern genes.7, 49 In fact, their uniqueness has been revealed by mtDNA12, 13, 14 and nuclear loci,7, 11 confirming their isolation and susceptibility to genetic drift. However, in a recent Y-chromosome study, Basques were not differentiated from neighbouring populations.26 Furthermore, Rosser et al18 found that within Western Europe, only a minor barrier separated the Basques from their neighbours. Consistent with these results, our findings indicate that Iberian populations, Basques included, have a reduced genetic structure. This means that the linguistic differences of this area arose after a common Y-chromosome pattern was established, or that there has been sufficient male gene flow to eliminate past differences. In particular, the results from Hurles et al39 suggested recent male gene flow between Basques and surrounding populations. Our results revealed that these recent events have not totally erased the ancient structure established by past population movements, indicating that a large fraction of the Iberian male heritage was already present in Europe during the Palaeolithic. Bolstering this hypothesis, Western Europe accounts for the highest frequencies of R1*(xR1a) lineage, and the tightly linked 49a,f ht XV and Hg1 haplotypes, with an estimated age traced back to Palaeolithic times.10, 50 Moreover, Wilson et al51 calculated that the coalescent times for Hg 1 in the British Isles and the Atlantic zone of the continent were ≈7 000 ybp. These findings are supported by the frequency and diversity patterns found for the phylogenetically precedent Y-lineage P(xR1).50
Salas et al52 interpreted the mtDNA diversity of the population of Galicia as one of the Western edges of the Neolithic expansion. In part, the Y-chromosome data support this view, since Galicia lies at extreme edge of the cluster of Europeans, showing some relatedness to Basques, as evidenced by the second component (Figure 4). On the other hand, Galicia, as well as other populations from northern Iberia (Cantabria, N. Portugal) and south of Andalusia (Malaga), are the Iberian populations closest to the Northwest African cluster (Figure 4). Northwest African influences in the south of Iberia are reconciled with the slow reconquest of the Iberian peninsula from the North by the Christians, which lasted seven centuries and ended in Granada in 1492.53 In fact, Bosch et al26 dated the specific Northwest African male influence to Iberia as ≈700 ybp, which they linked to the historical Islamic occupation. Favouring this, Lucotte et al27 detected that the characteristic Berber Y-chromosome haplotype p49a,f htV showed a gradient of decreasing frequencies with latitude in Iberia. As the Moslem influence in the Cantabrian fringe was barely appreciable, how can the Northwest African influence in northern parts of Iberia be explained? Other studies with the Y-chromosome,38, 42 and also with other genetic markers, have detected this Northwest African influence in northern Iberia. For instance, Basque and Berber Algerians share some infrequent HLA haplotypes,20 and Basques, but also Cantabrians and French from the Pyrenees, share African-specific GM immunoglobulin haplotypes.54 Moreover, haplotypes belonging to the Northwest African U6 mtDNA cluster have been found in Galicia and Northern Portugal, but are rare or absent in Southern areas.15, 25, 29 Some authors consider that, at least in part, this Northwest African influence was a consequence of prehistoric links between Iberians and North Africans.55, 56 As such, the coincident dispersion of Northwest African Y-chromosomes in Northern and Southern parts of Iberia is a matter that needs further consideration.
In conclusion, the detailed Y-chromosome binary Hg analysis has offered valuable insights into the population structure of the Iberian peninsula. The most important of these being the close affinities between the populations, the correlation between genetic and geographic distances and the apparent patchy distribution of Y-chromosome diversity. Despite the complex history of subsequent demographic events that have affected the Iberian peninsula, our findings support the idea of a high degree of underlying non-Neolithic ancestry being retained in Iberian populations.
References
- Ingman M, Kaessmann H, Pääbo S, Gyllensten U : Mitochondrial genome variation and the origin of modern humans. Nature 2000; 408: 708–713.
Article CAS PubMed Google Scholar - Maca-Meyer N, González AM, Larruga JM, Flores C, Cabrera VM : Major genomic mitochondrial lineages delineate early human expansions. BMC Genet 2001; 2: 13.
Article CAS PubMed PubMed Central Google Scholar - Underhill PA, Passarino G, Lin AA et al: The phylogeography of Y chromosome binary haplotypes and the origins of modern human populations. Ann Hum Genet 2001; 65: 43–62.
Article CAS PubMed Google Scholar - Richards M, Macaulay V, Torroni A, Bandelt HJ : In search of geographical patterns in European mitochondrial DNA. Am J Hum Genet 2002; 71: 1168–1174.
Article CAS PubMed PubMed Central Google Scholar - Stefan M, Stefanescu G, Gavrila L et al: Y chromosome analysis reveals a sharp genetic boundary in the Carpathian region. Eur J Hum Genet 2001; 9: 27–33.
Article CAS PubMed Google Scholar - Torroni A, Bandelt HJ, Macaulay V et al: A signal, from human mtDNA, of postglacial recolonization in Europe. Am J Hum Genet 2001; 69: 844–852.
Article CAS PubMed PubMed Central Google Scholar - Cavalli-Sforza LL, Menozzi P, Piazza A : The History and Geography of Human Genes. Princeton, NJ: Princeton University Press, 1994.
Google Scholar - Houseley RA, Gamble CS, Street M, Pettitt P : Radiocarbon evidence for the late glacial human recolonization of northern Europe. Proc Prehist Soc 1997; 63: 25–53.
Article Google Scholar - Torroni A, Bandelt HJ, D’Urbano L et al: mtDNA analysis reveals a major late Paleolithic population expansion from southwestern to northeastern Europe. Am J Hum Genet 1998; 62: 1137–1152.
Article CAS PubMed PubMed Central Google Scholar - Semino O, Passarino G, Oefner PJ et al: The genetic legacy of Paleolithic Homo sapiens in extant Europeans: a Y chromosome perspective. Science 2000; 290: 1155–1159.
Article CAS PubMed Google Scholar - Bertranpetit J, Cavalli-Sforza LL : A genetic reconstruction of the history of the population of the Iberian Peninsula. Ann Hum Genet 1991; 55: 51–67.
Article CAS PubMed Google Scholar - Richards M, Macaulay V, Hickey E et al: Tracing European founder lineages in the Near Eastern mtDNA pool. Am J Hum Genet 2000; 67: 1251–1276.
Article CAS PubMed PubMed Central Google Scholar - Côrte-Real HB, Macaulay VA, Richards MB et al: Genetic diversity in the Iberian Peninsula determined from mitochondrial sequence analysis. Ann Hum Genet 1996; 60: 331–350.
Article PubMed Google Scholar - Richards M, Côrte-Real H, Forster P et al: Paleolithic and Neolithic lineages in the European mitochondrial gene pool. Am J Hum Genet 1996; 59: 185–203.
CAS PubMed PubMed Central Google Scholar - Larruga JM, Díez F, Pinto FM, Flores C, González AM : Mitochondrial DNA characterisation of European isolates: the Maragatos from Spain. Eur J Hum Genet 2001; 9: 708–716.
Article CAS PubMed Google Scholar - Quintana-Murci L, Semino O, Minch E, Passarino G, Brega A, Santachiara-Benerecetti AS : Further characteristics of proto-European Y chromosomes. Eur J Hum Genet 1999; 7: 603–608.
Article CAS PubMed Google Scholar - Lucotte G, Loirat F : Y-chromosome DNA haplotype 15 in Europe. Hum Biol 1999; 71: 433–439.
Google Scholar - Rosser ZH, Zerjal T, Hurles ME et al: Y-chromosomal diversity in Europe is clinal and influenced primarily by geography, rather than by language. Am J Hum Genet 2000; 67: 1526–1543.
Article CAS PubMed PubMed Central Google Scholar - Alonso S, Armour JAL : MS205 minisatellite diversity in Basques: evidence for a pre-Neolithic component. Genome Res 1998; 8: 1289–1298.
Article CAS PubMed PubMed Central Google Scholar - Arnaiz-Villena A, Benmamar D, Alvarez M et al: HLA allele and haplotype frequencies in Algerians. Relatedness to Spaniards and Basques. Hum Immunol 1995; 43: 259–268.
Article CAS PubMed Google Scholar - Bosch E, Calafell F, Pérez-Lezaun A et al: Genetic structure of North-West Africa revealed by STR analysis. Eur J Hum Genet 2000; 8: 360–366.
Article CAS PubMed Google Scholar - Flores C, Maca-Meyer N, González AM, Cabrera VM : Northwest African distribution of the CD4/Alu microsatellite haplotypes. Ann Hum Genet 2000; 64: 321–327.
Article CAS PubMed Google Scholar - Osier MV, Pakstis AJ, Soodyall H et al: A global perspective on genetic variation at the ADH genes reveals unusual patterns of linkage disequilibrium and diversity. Am J Hum Genet 2002; 71: 84–99.
Article CAS PubMed PubMed Central Google Scholar - Flores C, Hernández M, González AM, Cabrera VM : Genetic affinities among human populations inhabiting the Subsaharan area, Northwest Africa, and the Iberian Peninsula; in Arnaiz-Villena A (ed): Prehistoric Iberia: Genetics, Anthropology, and Linguistics. New York, Plenum Press, 2000, pp 33–50.
Chapter Google Scholar - Pereira L, Prata MJ, Amorim A : Diversity of mtDNA lineages in Portugal: not a genetic edge of European variation. Ann Hum Genet 2000; 64: 491–506.
Article CAS PubMed Google Scholar - Bosch E, Calafell F, Comas D, Oefner PJ, Underhill PA, Bertranpetit J : High-resolution analysis of human Y-chromosome variation shows a sharp discontinuity and limited gene flow between northwestern Africa and the Iberian Peninsula. Am J Hum Genet 2001; 68: 1019–1029.
Article CAS PubMed PubMed Central Google Scholar - Lucotte G, Gérard N, Mercier G : North African genes in Iberia studied by Y-chromosome DNA haplotype V. Hum Immunol 2001; 62: 885–888.
Article CAS PubMed Google Scholar - Scozzari R, Cruciani F, Pangrazio A et al: Human Y-chromosome variation in the Western Mediterranean area: implications for the peopling of the region. Hum Immunol 2001; 62: 871–884.
Article CAS PubMed Google Scholar - González AM, Brehm A, Pérez JA, Maca-Meyer N, Flores C, Cabrera VM : Mitochondrial DNA affinities at the Atlantic fringe of Europe. Am J Phys Anthropol 2003; 120: 391–404.
Article PubMed Google Scholar - Rando JC, Pinto F, González AM et al: Mitochondrial DNA analysis of Northwest African populations reveals genetic exchanges with European, Near-Eastern, and sub-Saharan populations. Ann Hum Genet 1998; 62: 531–550.
Article CAS PubMed Google Scholar - Underhill PA, Shen P, Lin AA et al: Y chromosome sequence variation and the history of human populations. Nat Genet 2000; 26: 358–361.
Article CAS PubMed Google Scholar - Flores C, Maca-Meyer N, Pérez JA, González AM, Larruga JM, Cabrera VM : A predominant European ancestry of paternal lineages from Canary islanders. Ann Hum Genet 2003; 67: 138–152.
Article CAS PubMed Google Scholar - Jobling M, Tyler-Smith C : The human Y chromosome: an evolutionary marker comes of age. Nat Rev Genet 2003; 4: 598–612.
Article CAS PubMed Google Scholar - Schneider S, Roessli D, Excoffier L : Arlequin Ver. 2000: A Software for Population Genetics Data Analysis. Switzerland: Genetics and Biometry Laboratory, University of Geneva, 2000.
Google Scholar - Dupanloup I, Schneider S, Excoffier L : A simulated annealing approach to define the genetic structure of populations. Mol Ecol 2002; 11: 2571–2581.
Article CAS PubMed Google Scholar - Reynolds J, Weir BS, Cockerham CC : Estimation for the coancestry coefficient: basis for a short term genetic distance. Genetics 1983; 105: 767–779.
CAS PubMed PubMed Central Google Scholar - Bertorelle G, Barbujani G : Analysis of DNA diversity by spatial autocorrelation. Genetics 1995; 139: 811–819.
Google Scholar - Maca-Meyer N, Sánchez-Velasco P, Flores C et al: Y chromosome and mitochondrial DNA characterization of Pasiegos, a human isolate from Cantabria (Spain). Ann Hum Genet 2003; 67: 329–339.
Article CAS PubMed Google Scholar - Hurles ME, Veitia R, Arroyo E et al: Recent male-mediated gene flow over a linguistic barrier in Iberia, suggested by analysis of a Y-chromosomal DNA polymorphism. Am J Hum Genet 1999; 65: 1437–1448.
Article CAS PubMed PubMed Central Google Scholar - Zei G, Lisa A, Fiorani O et al: From surnames to the history of Y chromosomes: the Sardinian population as a paradigm. Eur J Hum Genet 2003; 11: 802–807.
Article CAS PubMed Google Scholar - Nebel A, Filon D, Brinkmann B, Majumder PP, Faerman M, Oppenheim A : The Y chromosome pool of Jews as a part of the genetic landscape of the Middle East. Am J Hum Genet 2001; 69: 1095–1112.
Article CAS PubMed PubMed Central Google Scholar - Brion M, Salas A, González-Neira A, Lareu MV, Carracedo A : Insights into Iberian population origins through the construction of highly informative Y-chromosome haplotypes using biallelic markers, STRs, and the MSY1 minisatellite. Am J Phys Anthropol 2003; 121: 147–161.
Article Google Scholar - Irondo M, Barbero MC, Manzano C : DNA polymorphisms detect ancient barriers to gene flow in Basuqes. Am J Phys Anthropol 2003; 122: 73–84.
Article Google Scholar - Di Giacomo F, Luca F, Anagnou N et al: Clinal patterns of human Y chromosomal diversity in continental Italy and Greece are dominated by drift and founder effects. Mol Phyl Evol 2003; 28: 387–395.
Article CAS Google Scholar - Francalacci P, Morelli L, Underhill PA et al: Peopling of three Mediterranean islands (Corsica, Sardinia, and Sicily) inferred by Y-chromosome biallelic variability. Am J Phys Anthropol 2003; 121: 270–279.
Article CAS PubMed Google Scholar - Al-Zahery N, Semino O, Benuzzi G et al: Y-chromosome and mtDNA polymorphisms in Iraq, a crossroad of the early human dispersal and of post-Neolithic migrations. Mol Phyl Evol 2003; 28: 458–472.
Article CAS Google Scholar - King R, Underhill PA : Congruent distribution of Neolithic painted pottery and ceramic figurines with Y-chromosome lineage. Antiquity 2002; 76: 707–714.
Article Google Scholar - Whittle A : Neolithic Europe: A Survey. Cambridge, MA: Cambridge University Press, 1985.
Google Scholar - Lahr MM, Foley RA, Pinhasi R : Expected regional patterns of Mesolithic–Neolithic human population admixture in Europe based on archaeological evidence; in Renfrew C, Boyle K (eds): Archaeogenetics: DNA and the Population Prehistory of Europe. Cambridge, UK: Cambridge University Press, 2000, pp 45–56.
Google Scholar - Wells RS, Yuldasheva N, Ruzibakiev R et al: The Eurasian heartland: a continental perspective on Y-chromosome diversity. Proc Natl Acad Sci USA 2001; 98: 10244–10249.
Article CAS PubMed PubMed Central Google Scholar - Wilson JF, Weiss DA, Richards M, Thomas MG, Bradman N, Goldstein DB : Genetic evidence for different male and female roles during cultural transitions in the British Isles. Proc Natl Acad Sci USA 2001; 98: 5078–5083.
Article CAS PubMed PubMed Central Google Scholar - Salas A, Comas D, Lareu MV, Bertranpetit J, Carracedo A : mtDNA analysis of the Galician population: a genetic edge of European variation. Eur J Hum Genet 1998; 6: 365–375.
Article CAS PubMed Google Scholar - Chejne AG : Muslim Spain. Its History and Culture. Minneapolis, MN: University of Minnesota Press, 1974.
Google Scholar - Esteban E, Dugoujon JM, Guitard E et al: Genetic diversity in northern Spain (Basque Country and Cantabria): GM and KM variation related to demographic histories. Eur J Hum Genet 1998; 6: 315–324.
Article CAS PubMed Google Scholar - Arnaiz-Villena A, Martinez-Laso J, Alonso-Garcia J : Iberia: population genetics, anthropology, and linguistics. Hum Biol 1999; 71: 725–743.
CAS PubMed Google Scholar - Maca-Meyer N, González AM, Pestano J, Flores C, Larruga JM, Cabrera VM : Mitochondrial DNA transit between West Asia and North Africa inferred from U6 phylogeography. BMC Genet 2003; 4: 15.
Article PubMed PubMed Central Google Scholar
Acknowledgements
We thank A Oterino, G Calderón and A Romany for providing us with blood samples. We also acknowledge the help and support of VM Cabrera in carrying out this project and thank three anonymous reviewers for their helpful suggestions. This research was supported by a DGES Spanish Grant PB 96-1034. PAU was supported by NIH Grant GM28428.
Author information
Authors and Affiliations
- Departamento de Genética, Universidad de La Laguna, Tenerife, E-38271, Spain
Carlos Flores, Nicole Maca-Meyer, Ana M González, Jose A Pérez & Jose M Larruga - Unidad de Investigación, Hospital Universitario N.S. de Candelaria, Tenerife, 38010, Spain
Carlos Flores & Nicole Maca-Meyer - Stanford Genome Technology Center, 855 California Ave., Palo Alto, 94304, CA, USA
Peter J Oefner & Peidong Shen - Departamento de Salud Laboral, Hospital del FREMAP, Sevilla, E-41012, Spain
Antonio Rojas - Department of Genetics, Stanford University, 300 Pasteur Dr., Stanford, 94305-5120, CA, USA
Peter A Underhill
Authors
- Carlos Flores
You can also search for this author inPubMed Google Scholar - Nicole Maca-Meyer
You can also search for this author inPubMed Google Scholar - Ana M González
You can also search for this author inPubMed Google Scholar - Peter J Oefner
You can also search for this author inPubMed Google Scholar - Peidong Shen
You can also search for this author inPubMed Google Scholar - Jose A Pérez
You can also search for this author inPubMed Google Scholar - Antonio Rojas
You can also search for this author inPubMed Google Scholar - Jose M Larruga
You can also search for this author inPubMed Google Scholar - Peter A Underhill
You can also search for this author inPubMed Google Scholar
Corresponding author
Correspondence toCarlos Flores.
Rights and permissions
About this article
Cite this article
Flores, C., Maca-Meyer, N., González, A. et al. Reduced genetic structure of the Iberian peninsula revealed by Y-chromosome analysis: implications for population demography.Eur J Hum Genet 12, 855–863 (2004). https://doi.org/10.1038/sj.ejhg.5201225
- Received: 19 November 2003
- Revised: 07 April 2004
- Accepted: 22 April 2004
- Published: 28 July 2004
- Issue Date: 01 October 2004
- DOI: https://doi.org/10.1038/sj.ejhg.5201225