Unlimited Access to Heroin Self-Administration: Independent Motivational Markers of Opiate Dependence (original) (raw)
INTRODUCTION
Opiate dependence continues as a major drug abuse problem in the United States and throughout the world (see Substance Abuse and Mental Health Services Administration (SAMHSA), 2002). Despite recent advances in treatment approaches using buprenorphine preparations (see Tzschentke, 2002), there remains a major need for animal models to elucidate the actual mechanisms of opiate dependence.
Previous studies using rats (Young et al, 1977; Ahmed et al, 2000; Sim-Selley et al, 2000; Walker et al, 2003) and nonhuman primates (Deneau et al, 1969; Bozarth and Wise, 1985) have shown that animals self-administer opiates readily and escalate their drug intake when given extended access to drug. Early work showed that unlimited access to heroin self-administration led to high heroin intake without overt acute toxicity (Bozarth and Wise, 1985). In contrast, rats with limited access to heroin (less than 3 h daily) did not escalate intake over time or show major signs of dependence (Koob et al, 1984). Subsequent studies have shown that when the daily self-administration session length was increased from 1 to 11 h, rats showed an escalation over time (Ahmed et al, 2000). Furthermore, Walker et al (2003) found that rats with prior morphine pellet exposure and/or extended session length (from 2 to 8 h) escalated rapidly when tested with varying unit doses of self-administered heroin. Overall, these results support the hypothesis that an increase in drug-taking may produce a motivational change in drug reward during the transition from controlled, moderate to uncontrolled, excessive drug use (see Koob and Le Moal, 2001; Koob et al, 2004).
Changes in feeding pattern between the light and dark phases of the circadian cycle are hypothesized to accompany changes in heroin intake during the transition to dependence. Early animal studies have shown that drug-naïve rats self-regulate their food intake in a specific temporal pattern (see Richter, 1927; Zucker, 1971) and consume 80–90% of their food during the active, dark phase (Siegal, 1961). Subsequent studies have found that passive administration of heroin in quantities sufficient to induce physical dependence alters the temporal pattern of food intake in rats, evidenced by decreased nocturnal feeding and increased diurnal feeding (Thornhill et al, 1976; Bhakthan and Chiu, 1978). In addition, clinical studies have reported that heroin and other drug addicts typically show a loss of interest in most pleasurable activities other than their chosen drug. This includes eating meals, leading to high incidences of malnutrition and anorexia (Jonas et al, 1987; Santolaria-Fernandez et al, 1995).
The present study employed an animal model of 23-h access (‘unlimited access’) to intravenous heroin self-administration with concomitant responding for food and water, with the aim of characterizing the transition to drug dependence. It was hypothesized that rats given 23-h daily access to heroin self-administration would escalate their intake of heroin to the point of producing dependence. As the present model allows for the concurrent collection of food and water intake data, whether meal intake patterns may change during the development of opiate dependence was also examined. Researchers have asserted that changes in the amount and pattern of food intake may be valuable in an animal model as a sensitive indicator of the effects of heroin (Thornhill et al, 1976). The present study hypothesized that changes in circadian and meal patterns of intake may parallel or precede the change in heroin intake pattern across time, and may serve as a sensitive indicator of the transition to drug dependence. The actions of heroin self-administration on food intake could reflect the direct pharmacological actions of chronic heroin intake on circadian activity patterns or relative devaluation of food as an alternative reinforcer. To verify dependence, the current study assessed changes in naloxone-precipitated opiate withdrawal over time and the change in heroin intake in response to a very low dose of naloxone. To further validate the model, the present study examined whether the partial opiate agonist buprenorphine would reduce heroin intake. Buprenorphine was chosen because it has been well characterized to reduce heroin intake in opiate-dependent nonhuman primates (Mello et al, 1983; Winger et al, 1992) and humans (Mello and Mendelson, 1980; Comer et al, 2001, 2002). It has pharmacological properties at the _mu_-opiate receptor (ie, high affinity, low intrinsic activity, and slow dissociation) that provide for a good safety profile, low physical dependence, and flexibility in dose scheduling (see Tzschentke, 2002).
MATERIALS AND METHODS
Subjects
Male Wistar rats (_n_=36 total; Charles River, NY) weighing 200–250 g at the beginning of the experiments were housed in groups of three in a humidity- and temperature-controlled (22°C) vivarium on a 12-h light/dark cycle (lights off at 1800 h) with ad libitum access to food and water. The animals were allowed to acclimate to these conditions for at least 7 days. All procedures were conducted in strict adherence to the National Institutes of Health Guide for the Care and Use of Laboratory Animals, and were approved by the Institutional Animal Care and Use Committee of The Scripps Research Institute.
In the present study, one primary group of rats (_n_=12 at study onset) was examined for escalation in heroin intake (_n_=8), naloxone-precipitated opiate withdrawal (Day 35; _n_=7), and buprenorphine challenge (_n_=6). The reduced sample sizes reflect that, during the course of the study, four to six of the 12 rats were excluded due to leaky catheters. Additional groups of rats (_n_=6/group at study onset) were similarly prepared for assessments of increased physical withdrawal (_n_=5), and drug-taking produced by a low dose of naloxone (_n_=6). Furthermore, time or experience in the self-administration chambers as a possible confound was assessed using a head-to-head comparison of heroin (_n_=5) vs saline (_n_=5) self-administration. The reduced sample sizes of all additional groups reflect that, during the course of the study, one of the six rats per group was excluded due to leaky catheters. To avoid confusion, the n size per group that was used for each analysis is indicated throughout the paper.
Drugs
The drugs used were heroin hydrochloride (National Institute on Drug Abuse), naloxone hydrochloride (Sigma, St Louis, MO), and buprenorphine (Sigma, St Louis, MO). Heroin was dissolved in 0.9% sterile saline for injection in a volume of 60 μg/kg/0.1 ml infusion. Naloxone was dissolved in 0.9% sterile saline for a subcutaneous (s.c.) injection in a volume of 1.0 ml/kg. Buprenorphine was mixed in sterile water and sonicated for up to 1.5 h to dissolve completely, and immediately injected s.c. in a volume of 1 ml/kg.
Surgery
Rats were anesthetized with a halothane/oxygen vapor mixture (1.0–1.5%) and prepared with chronic intravenous catheters as described in Caine et al (1993). Briefly, the catheters consisted of a 14 cm length of silastic tubing fitted to a guide cannula (Plastics One, Roanoke, VA) bent at a right angle. The skull was exposed and cleaned, and four skull screws were implanted, one in each quadrant. The bent guide cannula was secured rostral-caudally to the center of the skull using cranioplastic cement. The catheter tubing was passed s.c. from the animal's skull to the right jugular vein, which was punctured with a 26-gauge needle. Then, 3.7 cm of the silastic tubing was inserted into the vein and tied gently with a suture thread. Surgery was conducted under sterile conditions, and all connections involving the catheter were kept as sterile as possible. All animals were allowed to recover for a minimum of 1 week before being given access to heroin self-administration. Catheters were flushed daily with 0.2 ml of sterile physiological saline containing heparin (30 USP units/ml) and the antibiotic Timentin (SmithKline Beecham Pharmaceuticals, Philadelphia, PA).
Catheter Patency
Catheter patency was tested whenever an animal not receiving drug pretreatments displayed behavior outside baseline parameters. In these cases, 0.1 ml of the ultra short-acting barbiturate anesthetic Brevital® sodium (1% methohexital sodium, Eli Lilly, Indianapolis, IN) was administered through the catheter. Animals with patent catheters exhibited prominent signs of anesthesia (pronounced loss of muscle tone) within 3 s of intravenous injection. Animals with leaky catheters during the course of the experiment were excluded from the experiment and data analysis.
Self-Administration Chambers
For each session, the animals were placed into operant cages located inside ventilated, sound-attenuating chambers equipped with a 1.1-W miniature light bulb synchronized to the 0600 h (light on)/1800 h (light off) light/dark cycle. The catheter fittings on the animals' skulls were connected to a polyethylene tubing contained inside a protective metal spring (tether) that was suspended into the operant chamber from a liquid swivel attached to a balance arm. Drug in a syringe was delivered by a syringe pump (Razel) as described in Caine et al (1993). Modifications from the Caine et al (1993) procedure were made to use a 10-rpm syringe pump motor to push on a 30-ml syringe for 1 s to deliver a 0.1 ml infusion; the large 30-ml syringe size was used to ensure that enough drug was available for the full 23-h session, without having to replace syringes. Each operant session was performed using a single retractable lever that extended approximately 1 inch into the chamber. Following completion of each FR1, a 28 V white stimulus light located above the lever signaled the delivery of a drug and remained on for a 20-s time out (TO) period, during which responses were recorded but had no scheduled consequences. Nose-poke access to food and water was readily available throughout the 23-h session (Zorrilla et al, 2005), including the drug TO period.
Food and Water Training
On the first 5 days, animals were placed into the operant chambers and allowed to nosepoke (FR1) for food (45-mg precision food pellets, Formula A/I; PJ Noyes Company Inc., Lancaster, NH) and water (100 μl aliquots) in 23-h sessions, with the session start time set at 1100 h and end time at 1000 h of the next day. No food or water restrictions were employed. The 1000–1100-h session break allowed for daily maintenance and cleaning of the self-administration boxes, weighing of the rats, data retrieval, and setup of drug-filled syringes (heroin self-administration sessions). Rats obtained individual chow pellets from a trough fed by a pellet dispenser (Med Associates, Inc., St Albans, VT). Photobeams were broken when the rat nosepoked through a freely swinging door to obtain the pellet from the trough. From a hole on the opposite wall of the test cage, rats could make nosepoke responses, again detected by photobeams, to obtain 100 μl aliquots of water in an adjacent reservoir. Food and water were accessible throughout the heroin self-administration sessions even during the TO period between heroin responses. Drug, food, and water responses were recorded by an IBM PC-compatible computer. This food- and water-training phase allowed the animals to habituate to the chambers and to acquire stable levels of food and water intake. The animals were then returned to their home cages (_n_=2–3/cage) with ad libitum access to food and water for 2 days in the vivarium before catheterization surgery.
After recovery from surgery, the animals resumed 23-h nosepoke sessions for food and water for 5 days to re-establish stable intake. To habituate the animals to being connected to the drug line, their catheters were connected to the protective metal spring, but the drug tubing was left unconnected. Additionally, observations from preliminary work revealed that rats with 23-h daily access to heroin over time tend to chew on their drug lines. Owing to this, a ‘chew pad’ (ie, duct tape wrapped around the center of a ribbon-shaped metal spring) was placed on the self-administration chamber floor as an alternative chew material during the second set of food and water sessions and all heroin self-administration sessions thereafter. Also, at the end of each daily 23-h session, as the animals were unhooked from their drug lines, their catheters were flushed with 0.2 ml of sterile physiological saline containing heparin and Timentin to verify catheter patency.
Heroin Self-Administration Sessions
After 5 days of post-surgery food and water reinstatement in the self-administration chambers, the animals were allowed to lever press for heroin (60 μg/kg/0.1 ml infusion) on an FR1 20-s TO schedule in 23-h daily sessions. All heroin self-administration sessions commenced with the lever being extended, after which time the completion of each FR1 resulted in an injection signaled immediately by a cue light, which remained lit for a 20-s TO period, during which responses were recorded but not reinforced.
To examine whether time or experience in the self-administration chambers posed a possible confound for changes in heroin and food intake over time, another experiment was added to compare these changes between a group of rats (_n_=5) that self-administered heroin as described above and a group of rats (_n_=5) that self-administered saline (no drug). As preliminary analysis of the primary group data showed that significant changes in heroin and food intake occurred within the first 2 weeks, this direct comparison between heroin vs saline rats was observed for 2 weeks.
Naloxone-Precipitated Opiate Withdrawal
To verify dependence, on Day 35 of heroin escalation, rats from the primary group (_n_=7) were taken out of the self-administration boxes at the end of the dark phase (1800–0600 h) of the light/dark cycle and weighed. Physical signs of withdrawal were measured according to a modified method as described in Azar et al (2003). After a 10-min initial period of habituation to a separate testing room, rats were injected with naloxone (1.0 mg/kg s.c.) and placed for 10 min into a clear, Plexiglas square-shaped container measuring 1 cubic foot. Body weight was recorded 60 min after the injection of naloxone, and no food or water were available to the rat during this interval. Physical signs of opiate withdrawal that were counted (Azar et al, 2003; Schulteis et al, 1994) included the following: number of escape jump attempts, wet-dog shakes, facial fasciculations (including cheek tremors, chews, and teeth chattering), abdominal constrictions, genital licks, eye blinks, and grams of weight loss. To examine changes in the level of physical withdrawal during the development of dependence, a separate group of rats (_n_=5) with daily 23-h access to heroin as in the primary group was tested on days 0 (pre-drug), 7, 14, 21, and 28.
Low-Dose Naloxone Challenge
To verify further the development of opiate dependence, an additional group of rats (_n_=6) with daily 23-h access to heroin as in the primary group was injected with very low doses of naloxone (0, 0.003, 0.01, and 0.03 mg/kg, s.c.; doses adopted from Carrera et al, 1999) for four consecutive days (days 28–31) using a within-subjects Latin-square design immediately prior to the dark phase (ie, 2–3 min before 1800 h). Animals were injected quickly with a small 26-gauge needle, while drug and tether lines remained connected, which allowed the animals immediate access to self-administration of the drug after the injection.
Buprenorphine Challenge
After the naloxone-precipitated withdrawal test, animals from the primary group (_n_=6) were returned immediately to their self-administration chambers and allowed to continue self-administering heroin in 23-h sessions for 1 week (days 42–48). Then, the influence of pretreatment with buprenorphine on heroin intake in dependent rats was examined. Rats were injected with buprenorphine (0, 0.01, 0.04, and 0.2 mg/kg, s.c.) for four consecutive days (days 49–52) using a within-subjects Latin-square design 15 min prior to the active phase (1800–0600 h). Doses were selected based on work from previous investigators (Martin et al, 1983; Myers et al, 1984; Carroll and Lac, 1992; June et al, 1998) and preliminary trials of the present study.
Data Analysis
Heroin intake, meal (food) intake, naloxone, and buprenorphine data. Using Statview 5.0 (SAS Institute Inc.), a one-way repeated-measures analysis of variance (ANOVA) with days as the within-subjects factor was performed separately on data of mean total intake of each 23-h session and of the first-hour period across days 1–35. Data from representative Day 0 (1 day prior to drug sessions; ‘predrug’), 1, 7, 14, 21, 28, and 35 were chosen for analysis. To ensure the representative nature of the data, a means-comparison analysis of the data for the representative day plus 1 day prior to or after did not reveal a significant variation. A one-way within-subjects ANOVA with day as the repeated-measures factor was performed on the food intake data obtained during the dark and light phases for Day 0, 1, 7, 14, 21, 28, and 35. A mixed 2 × 3 (condition (heroin vs saline) × day (Day 0 vs 7 vs 14)) ANOVA with day as the within-subjects factor was performed on the food intake data obtained during the dark and light phases for representative Day 0, 7, and 14. Where appropriate, follow-up simple-effects analyses were performed to show food intake differences across days within each group and also between heroin vs saline groups at Day 7 and 14. A one-way within-subjects ANOVA with dose as the repeated-measures factor was performed on the data obtained during the first 30 mins of the dark phase (1800–1830 h) after an injection of each low dose of naloxone and during the total dark phase (1800–0600 h) after an injection of each buprenorphine dose. Where appropriate, Student–Newman–Keuls post-hoc comparisons were conducted for between- and within-subjects groups. Student's paired and unpaired _t_-tests were used where indicated. The probability for a type 1 error for all significance testing was set at 0.05.
Cosinor analysis of meal (food) and drug intake. For analysis of the circadian regulation of food and drug intake, cosinor analysis was used. Briefly, cosinor analysis is a form of time-series analysis that models chronobiologic rhythms as a cosine function with the following attributes: the midline estimating statistic of rhythm (MESOR; mean level around which the cosine function oscillates), amplitude (the distance from the MESOR to the extremes (peak or nadir) of the oscillation), acrophase (the time at which the cosine peak occurs relative to a time of interest, in this case the start of the session), and period (the time interval at which the cycle repeats; Smolensky et al, 1976; Lentz, 1990). To examine changes in circadian regulation, a predefined period of 24 h was employed according to the following formula:

Cosinor functions were fit individually to each rat's daily intakes, and the MESOR, amplitude, acrophase, and goodness of fit (r 2) were obtained from each and averaged across rats. The goodness of fit is an index of how well the observed data were modeled by the cosinor function, and reflects the proportion of variance in the dependent measure that was accounted for by the function. Peaks were calculated as the (MESOR+Amplitude) and nadirs were calculated as the (MESOR−Amplitude). As food intake occurs in discrete episodes (‘meals’), intake was cumulated into 3-h bins to facilitate modeling of the hypothesized underlying intake rhythm. Drug intake was cumulated identically for consistency. The first and last hours of the 23-h data collection period were not used for curve-fitting, because of potentially confounding influences of recent and anticipated experimenter manipulation and transient inaccess to reinforcers. DataFit 8.0 (Oakdale Engineering, Oakdale, PA) was used for curve-fitting, and Instat 3.0 (GraphPad, San Diego, CA) was used to test for significant differences in the central tendency or variability of the cosinor parameters. SigmaPlot 8.0 (SPSS, Chicago, IL) was used to construct summary illustrations of the resulting average circadian rhythm functions. In all analyses, measures of ingestion were normalized as per Kleiber's law as a power function of body weight (ie, g food intake per (kg body weight)0.75) to account for increased metabolic needs of greater body mass (see Sidhu, 1992). As rats' weights changed by 70 g over the course of the experiment, it is important to account for changes in body weight when interpreting changes in food intake. Kleiber's law is perhaps the best-validated bioenergetic law (see also Gillooly et al, 2001; Lindstedt and Schaeffer, 2002). In essence, it expresses how much more energy is required to sustain a larger body mass. In the present (and similar) longitudinal studies, failing to account for changes in mass would misrepresent the magnitude, and potentially the direction, of changes in intake. Therefore, the correction applied in the present study clarifies that observed changes in intake are independent from potentially confounding metabolic mass-related changes in energy need.
For the primary group (_n_=8), one-way within-subjects ANOVAs with day as the repeated-measures factor were performed on the data for all cosinor measures (amplitude, MESOR, acrophase, peak, nadir, and r 2). Where appropriate, Student–Newman–Keuls post-hoc comparisons were conducted for within-subjects groups. Bonferroni-corrected paired _t_-tests were used to examine whether the nadir of the primary group differed reliably from the absolute value of zero across days. Using Instat 3.0, the method of Bartlett was used on the acrophase measure to test whether the variability (standard deviation) of acrophase changed across conditions. A significant increase in variability would indicate a desynchronization of the acrophase over time. For the heroin (_n_=5) vs saline (_n_=5) comparison study, a mixed 2 × 3 (condition (heroin vs saline) × day (Day 0 vs 7 vs 14)) ANOVA with day as the within-subjects factor was performed on the data for all cosinor measures. Where appropriate, follow-up simple-effects analyses were performed to show food intake differences across days within each group and also between heroin vs saline groups at Day 7 and 14. Further analyses of the nadir and acrophase measures as described earlier for the primary group were performed for the heroin vs saline groups.
Meal pattern analysis of ingestion. For meal pattern analysis, a meal for rats was defined as a burst of responses for food or water that contained at least five food-directed responses, or 0.225 g, a value below the lower bounds for food bout size estimated previously (see Demaria-Pesce and Nicolaidis, 1998; Zorrilla et al, 2005). Meals were discriminated from one another by the threshold meal interval, or the maximum interval between ingestive responses that was considered to continue the ongoing meal. The threshold meal interval was estimated by determining the inter-event interval(s) between feeding- and drinking-directed nosepokes that provides the most stable, joint estimates of meal size for food and total meal duration, thereby minimizing the negative consequences of mis-assigned events and time. This method was related to previous approaches in which transitions or stabilities in the slope of a function were identified through first-derivative analysis (Dado and Allen, 1993). This methodology explicitly considers drinking to be a part of meals, has recently been validated, and differs from conventional meal pattern analysis (Inoue et al, 2003; Zorrilla et al, 2005). A prior study using this apparatus and diet revealed that the threshold meal interval for Wistar rats was 5 and 10 min between food or water responses for nocturnal and diurnal intake, respectively (Zorrilla et al, 2005).
The estimated threshold meal interval was used to calculate the descriptive statistics of average nocturnal and diurnal meal structure. Parameters included the (a) total quantity (food intake) and (b) total duration of prandial intake; (c) meal frequency (the number of meals); and (d) the average meal size, (e) average meal duration, and (f) response rate of meals. Meal duration was calculated as the total time from the first to the last response of a meal, and duration of eating within the meal was calculated as the duration of consecutive responses for food. Thus, transitions between eating and drinking were included in total meal duration, but not in the duration of eating. Meal sizes for eating were calculated as the average number of food-directed responses during meals. Rates of eating were calculated by dividing each meal size by food duration. In the absence of experimental treatments, rats normally exhibit remarkable stability in these measures of meal patterning (calculated as an intraclass correlation of absolute agreement (Shrout and Fleiss, 1979); average _r_=0.77 across 3 weeks of testing) (Zorrilla et al, 2005).
RESULTS
Escalation in Heroin Intake
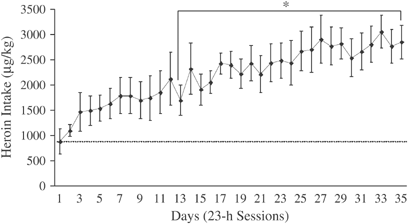
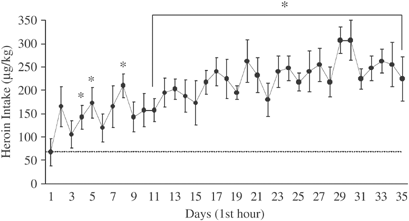
To demonstrate that Day 1 heroin intake was a reliable choice as a baseline measure to compare with heroin intake on subsequent days, a paired _t_-test analysis performed on the data revealed no significant difference between mean heroin intake on Day 1 (885.0±245.0 μg/kg/day) and days 1–7 (1419.7±307.9 μg/kg/day). Figure 1 depicts the escalation of heroin intake across 35 days of 23-h self-administration sessions. The primary group of rats (_n_=8) increased their heroin intake approximately three-fold (885–2857 μg/kg) from Day 1 to 35, respectively, F(34, 238)=6.79, p<0.001. Post-hoc comparisons revealed that heroin intake in these rats increased significantly on Day 13 and onward (p<0.05), as compared with Day 1. These results suggest that rats given unlimited access to heroin increase their drug intake significantly by 2 weeks of self-administration. Furthermore, Figure 2 revealed a significant increase in heroin intake in the first hour of the 23-h session across the same 35 days, F(34, 238)=2.58, p<0.001. In fact, significant increases in the first hour of intake were found as early as Day 4, 5, and 8, and consistently on Day 11 onward (p<0.05), as compared with Day 1.
Figure 1
Escalation of heroin intake (mean±SEM) in rats from the primary group (_n_=8) across days 1–35 is depicted. The dotted line indicates the mean (±SEM) number of heroin self-infusions during the first 23-h heroin self-administration session. *p<0.05, different from the first session.
Figure 2
Escalation in the first hour of each 23-h session across days 1–35 in rats from the primary group (_n_=8) is depicted. The dotted line indicates the mean (±SEM) number of heroin self-infusions during the first hour of the first 23-h session. *p<0.05, different from the first hour of the first session.
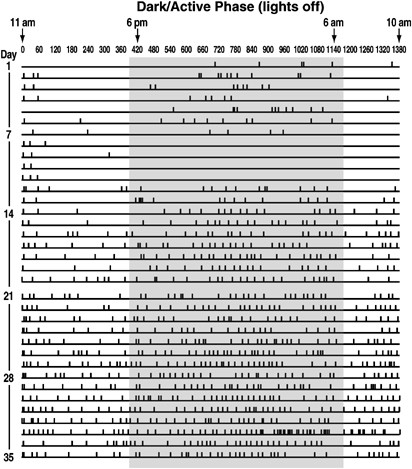
Additionally, the present study examined the change in heroin intake pattern within each 23-h session from Day 1 to Day 35. For example, Figure 3 depicts the heroin self-administration of a representative rat. Early sessions show drug intake primarily in the dark phase (1800–0600 h) of the light/dark (sleep/wake) cycle. However, with more sessions, the rat began to increase its drug intake beyond the dark phase and into the light phase (0600–1800 h) to the point where it was self-administering heroin throughout the 23-h session. Overall, assessment of the event recordings of heroin intake revealed that rats began to seek the drug earlier prior to their wake period and also later into the sleep period across days to the extent that they ultimately self-injected heroin throughout the sleep/wake period.
Figure 3
Event recording of heroin self-administration for representative Rat #12 from the primary group of rats is shown. Early sessions show drug intake primarily in the dark phase (1800–0600 h; gray-shaded region) of the light/dark cycle. However, with more sessions, drug intake increased beyond the dark phase and into the light phase (0600–1800 h) to the point where heroin was self-administered throughout the 23-h session.
Cosinor Analysis of Drug Intake
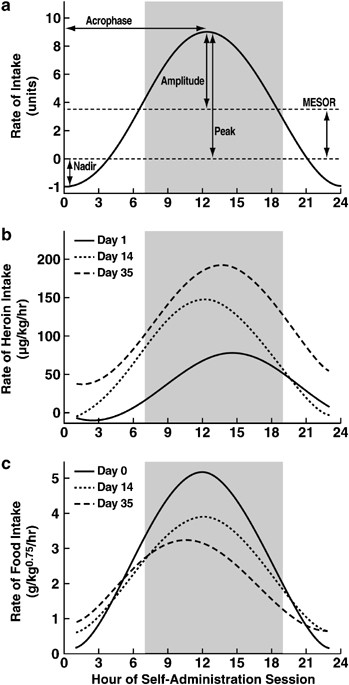
To quantify these changes in the circadian pattern of drug intake associated with daily, extended (23-h) access to intravenous heroin self-administration, cosinor analyses were performed on the daily intake profiles of the primary group of rats (_n_=8) during Day 1, 7, 14, 21, 28, and 35 of drug access. Cosinor functions (see illustrative Figure 4a) were individually fit to each rat's daily intake data, and the following parameters were extracted, averaged across rats, and subjected to statistical analysis: MESOR, amplitude, acrophase, and goodness of fit (r 2). Confirming impressions from the event recording analysis (Figure 3), the MESOR of heroin intake progressively increased with continued heroin access, with differences reaching significance by Day 21 (see Table 1a and Figure 4b). Reflecting this effect, progressive increases in both the nocturnal peaks and diurnal nadir of drug-taking were seen. No reliable changes in the amplitude or acrophase of heroin intake were observed. However, the variability of the heroin acrophase tended to decrease by Day 7, suggesting a synchronization of the regulation of drug intake. Changes in these measures were not accounted for by changes in goodness of fit, as r 2 values did not vary significantly and were uniformly adequate.
Figure 4
For clarity, cosinor measures (eg, MESOR, amplitude, acrophase) of circadian regulation of drug and food intake are illustrated in a sample figure (a) that depicts a cosinor function with MESOR=15, amplitude=10, peak=25, nadir=5, and acrophase=13 h from the start of the session. Average cosinor functions for heroin intake (b) and food intake (c) in the primary group of rats (_n_=8) are shown for Day 1, 14, and 35 of daily, 23-h operant access to intravenous heroin. The shaded gray area represents the rats' dark cycle. For heroin intake (b), from Day 1 to 14, the nocturnal peak of heroin intake selectively increased, with no reliable change in the diurnal trough, changes that resulted from matching increases in the amplitude and MESOR. In contrast, from Day 14 to 35, a selective increase in the MESOR resulted in an overall upregulation of the mean level of heroin intake, across which nocturnal and diurnal self-administration oscillated. No reliable change in the mean acrophase occurred, but the variability of the acrophase value across animals decreased significantly with continued heroin access (see Table 1a). For food intake (c), from Day 0 to 14, a blunting of the amplitude and decrease of the MESOR were evident, resulting in an increase of the diurnal trough and decrease of the nocturnal peak of feeding. From Day 14 to 35, a selective decrease of the nocturnal feeding peak occurred. No reliable change in the mean acrophase occurred, but the variability of the acrophase value across animals increased significantly with continued heroin access (see Table 1b).
Table 1 Mean (±SEM) Estimates for Selected Measures of Circadian (a) Drug-Taking and (b) Feeding Rhythms in Wistar Rats with Daily 23-h Access to Intravenous Heroin Self-Administration
Cosinor Analysis of Food Intake
Changes in the circadian pattern of ingestion (see Table 1b and Figure 4c) differed from and preceded the escalation of heroin intake in the primary group of rats (_n_=8). Statistical values are reported in Table 1b. Unlike the rhythm of drug intake, the circadian amplitude of eating (Table 1b and Figure 4c) and drinking (not shown) was blunted within 1 week of heroin self-administration. The nocturnal peak of feeding progressively decreased by 17–36%, whereas the diurnal nadir increased above negligible levels of intake. By Day 7, total daily food intake decreased, reflected in a significantly diminished MESOR, as nocturnal ingestion decreased further without corresponding increases in diurnal ingestion. Although the mean acrophase did not reliably change, the variability of the acrophases for feeding progressively increased, suggesting a gradual desynchronization of the regulation of ingestion. Changes in these measures were not accounted for by changes in goodness of fit, as r 2 values did not vary significantly and were uniformly adequate.
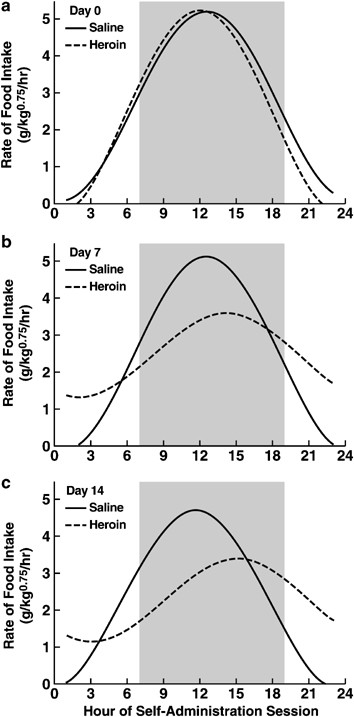
In addition, the two-way (condition × day) ANOVA on cosinor data obtained from the direct comparison between heroin and saline groups revealed significant changes in cosinor measures as a result of heroin access. Statistical values are reported in Table 2. Similar to the primary group, rats in this heroin group showed a blunted amplitude, a decrease in nocturnal peak, and an increase in diurnal nadir. Furthermore, although the mean acrophase did not reliably change, the variability of the acrophases for feeding progressively increased, showing a gradual desynchronization of the regulation of ingestion. Significant changes in cosinor measures were not found within the saline control group. Changes in these measures were not accounted for by changes in goodness of fit, as r 2 values did not vary significantly and were uniformly adequate.
Table 2 Mean (±SEM) Estimates for Selected Measures of Circadian Feeding Rhythm in Wistar Rats with Daily 23-h Access to Intravenous Saline (_n_=5) Versus Heroin (_n_=5) Self-Administration
Moreover, the change in body weight within the 2-week period of the study of rats with unlimited access to heroin vs saline controls was also compared. At Day 7, the heroin rats gained 9 g less than the saline controls (_t_-test, _p_=0.087). By Day 14, the heroin rats gained 18 g less than the controls (_t_-test, p<0.01). At that body weight, an 18 g difference is about 2% of the body weight of controls. That is, 2 weeks of heroin intake resulted in a 2% relative decrease in body weight (Figures 5, 7).
Figure 5
The comparison of cosinor measures for food intake between heroin and saline groups at Days 0 (a), 7 (b), and 14 (c) is depicted. For the heroin group, a blunting of the amplitude and increase of the diurnal trough nadir were evident, along with a decrease in the nocturnal peak of feeding, as compared with saline controls at Days 7 and 14. No reliable change in the mean acrophase occurred, but the variability of the acrophase value across animals increased significantly with continued heroin access (see Table 2).
Figure 7
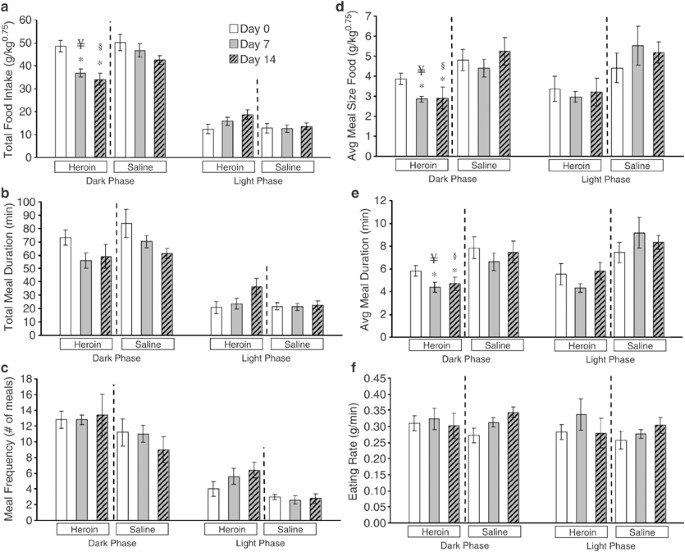
A head-to-head comparison in meal intake pattern over time of additional groups of rats connected to tethers for 23-h daily heroin self-administration (n_=5) vs rats connected to tethers with saline self-administration (n_=5) is depicted. The parameters measured were total food intake (a) and total duration of prandial intake (b); meal frequency (the number of meals) (c); and the average meal size (d), average meal duration (e) and response rate of meals (f). Within-group comparison for heroin group: *p<0.05, compared with Day 0. Between-group comparisons (heroin vs saline): ¥_p<0.05, Day 7 heroin group vs Day 7 saline group and §_p<0.05, Day 14 heroin group vs Day 14 saline group.
Meal Pattern Analyses
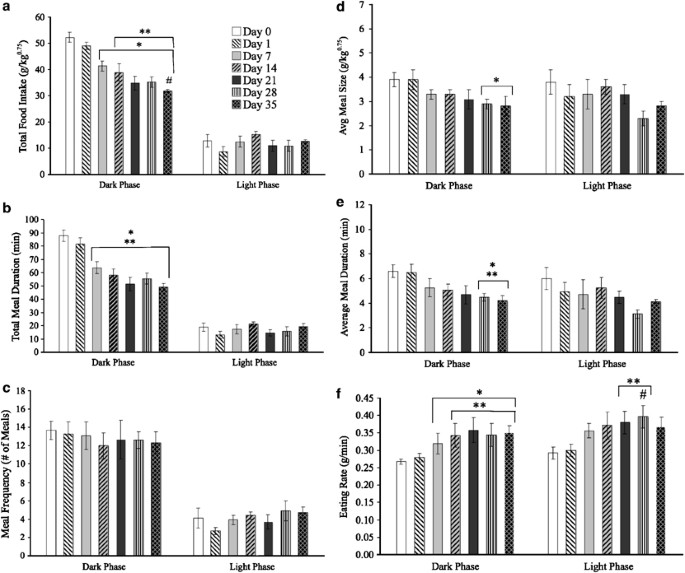
Meal pattern analyses were also performed on the diurnal and nocturnal (Figure 6) intake profiles of the primary group of rats (_n_=8) after 35 days of drug access. Decreases in the nocturnal quantity (Figure 6a, F(6, 36)=17.06, p<0.0001) and duration (Figure 6b, F(6, 36)=19.14, p<0.0001) of feeding were found, while meal frequency (number of meals) was unaffected (Figure 6c). These findings indicate that rats took smaller and briefer, rather than fewer, meals. The largest decrement in nocturnal intake was evident by Day 7 (p<0.05) of heroin access, but ingestion progressively decreased through Day 35 (Figure 6a and b, p<0.05). Similarly, a gradual decrease is reflected in the average nocturnal meal size (Figure 6d, F(6, 36)=3.48, p<0.01) and duration (Figure 6e, F(6, 36)=4.81, p<0.01), reaching significance by Day 28 (p<0.05).
Figure 6
Changes in meal intake pattern over time in the primary group of rats (_n_=8) given 23-h daily sessions of heroin self-administration are depicted. The parameters measured were total food intake (a) and total duration of prandial intake (b); meal frequency (the number of meals) (c); and the average meal size (d), average meal duration (e), and response rate of meals (f). *p<0.05, compared with Day 0; **p<0.05, compared with Day 7; #p<0.05, compared with Day 14.
Reliable increases in the local sustained rate of eating were evident in the light phase (Figure 6f, F(6, 36)=4.87, p<0.01) by Day 14 and dark phase (Figure 6f, F(6, 36)=4.87, p<0.01) by Day 7. Interestingly, diurnal quantity (Figure 6a) and duration (Figure 6b) of feeding showed near-significant increases by Day 7, as accounted for by the near significant increase in diurnal meal frequency (number of meals) (Figure 6c). These findings indicate that changes in food intake pattern may be detected in the light phase also as early as Day 7. There were no significant changes in diurnal meal size (Figure 6d) or duration (Figure 6e). No major decreases in body weight were detected during this period with the heroin rats (body weights increased from 355±5 g on day 1 to 429±9 g on Day 35).
In a direct comparison of meal intake patterns between heroin rats and saline controls over time (Day 0–14), there was a significant decrease in the nocturnal quantity of feeding (Figure 7a, F(2,16)=12.25, p<0.001) by Day 7. Corresponding near-significant nocturnal decreases in total duration of feeding (Figure 7b), average meal size (Figure 7d), and average meal duration (Figure 7e) were also observed. Furthermore, near-significant increases in diurnal quantity (Figure 7a) and duration (Figure 6b) of feeding and meal frequency (Figure 7c) were observed. In addition, significant between-subjects differences (heroin vs saline) were found for nocturnal total food intake on Day 7 and 14 (Figure 7a, F(1, 8)=6.83, p<0.05), average meal size (Figure 7d, F(1, 8)=13.92, p<0.01), and average meal duration (Figure 7e, F(1, 8)=15.26, p<0.01). Follow-up simple effects analyses revealed significantly lower scores for nocturnal total food intake at Day 7 (Figure 7a, F(1, 8)=8.99, p<0.05) and Day 14 (Figure 7a, F(1, 8)=6.92, p<0.05), average meal size at Day 7 (Figure 7d, F(1, 8)=11.05, p<0.05) and Day 14 (Figure 7d, F(1, 8)=7.03), and average meal duration at day 7 (Figure 7e, F(1, 8)=6.51, p<0.05) and Day 14 (Figure 7e, F(1, 8)=6.21, p<0.05). Thus, rats in the heroin group took smaller and briefer meals during the dark cycle, resulting in decreased nocturnal cumulative intake, relative to saline controls.
Naloxone-Precipitated Opiate Withdrawal
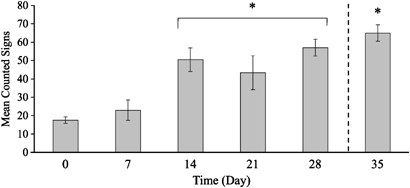
The naloxone-precipitated opiate withdrawal test on the primary group of rats (_n_=7) produced robust signs of withdrawal on Day 35 of 23-h daily heroin access. The mean±SEM of total counted signs was 57.5±8.4. In a separate group of rats (_n_=5), withdrawal data were collected on Day 0 (1 day prior to drug sessions), 7, 14, 21, and 28. Results (see Figure 8) revealed a significant increase in withdrawal by day 14 (p<0.05) and onward, as compared with Day 0 (paired _t_-tests). In a between-groups comparison, Day 35 data from the primary group of rats showed a significant difference in physical withdrawal from Day 0 (p<0.05, unpaired _t_-test) (see Figure 8).
Figure 8
Naloxone-precipitated opiate withdrawal data across days are shown. Withdrawal data from Day 0 to 28 to heroin were obtained from an additional group (_n_=5), whereas withdrawal data from Day 35 were obtained from the primary group of rats (_n_=7). *p<0.05, compared with Day 0.
Low-Dose Naloxone Challenge
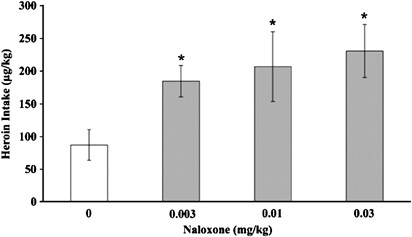
In Figure 9, a one-way (dose as the repeated-measures factor) within-subjects ANOVA on the data revealed a significant dose effect, F(3, 12)=4.17, p<0.05. Student–Newman–Keuls post-hoc comparisons revealed that heroin intake in the rats (_n_=5) was significantly increased in response to all low doses of naloxone (0.003, 0.01, and 0.03 mg/kg) within the first 30 min of the naloxone injection, as compared with controls.
Figure 9
An increase in heroin intake in response to a low dose of naloxone (0.003–0.03 mg/kg, s.c.) is shown. Heroin-dependent rats (_n_=6) from an additional group were injected with naloxone (0, 0.003, 0.01, and 0.03 mg/kg, s.c.) in a within-subjects Latin-square design (days 28–31). *p<0.05, 0.03 mg/kg vs control.
Buprenorphine Challenge
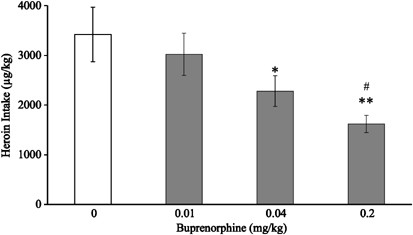
In Figure 10, a one-way (dose as the repeated-measures factor) within-subjects ANOVA on the data revealed a dose-dependent decrease of heroin intake in the rats (_n_=6) with increasing doses of buprenorphine, F(3, 15)=9.66, p<0.01. Student–Newman–Keuls post-hoc comparisons revealed significant differences at the 0.04 mg/kg dose (p<0.05) and 0.2 mg/kg dose (p<0.01), as compared with controls, and at the 0.2 mg/kg dose (p<0.01), as compared with the 0.01 mg/kg dose.
Figure 10
A dose-dependent decrease in heroin intake with increasing doses of buprenorphine is shown. Rats (_n_=6) from the primary group were injected with buprenorphine (0, 0.01, 0.04, and 0.2 mg/kg, s.c.) in a within-subjects Latin-square design (days 49–52). *p<0.01, 0.2 mg/kg vs control; **p<0.05, 0.04 mg/kg vs control; #p<0.05, 0.2 mg/kg vs 0.01 mg/kg.
DISCUSSION
The present study sought to develop and validate an animal model of opiate dependence using an unlimited access self-administration paradigm. The study demonstrated that rats given unlimited access to heroin would self-administer to the point of producing dependence. This result is consistent with previous animal studies showing that long/extended opiate exposure would produce an escalation in opiate self-administration (Jones and Prada, 1973; Young et al, 1977; Kilbey and Ellinwood, 1980; Bozarth and Wise, 1985; Ahmed et al, 2000; Sim-Selley et al, 2000; Morgan et al, 2002; Walker et al, 2003; Xi et al, 2004). It has been hypothesized that the increase in drug intake results from a gradual change in hedonic set point for the regulation of drug self-administration (Ahmed et al, 2000; Koob and Le Moal, 2001). This change is reflected in the gradual increase in the first 2 weeks of daily 23-h heroin self-administration sessions (Figures 1 and 2). Additionally, event recordings of responding for the drug within each 23-h session (Figure 3) show that all the animals begin to distribute their intake evenly throughout the session, starting around Day 14 and onward. This observation was confirmed by cosinor analyses. Body weights increased and grooming behavior was maintained throughout the duration of the study. The characterization of increased heroin intake in the rats was similar to that reported in previous extended opiate access studies (Bozarth and Wise, 1985; Ahmed et al, 2000).
The strength of the present model was the opportunity to examine changes in drug intake pattern across the sleep/wake cycle during the development of drug dependence. The changes observed in a representative rat (Figure 3) showed an increase in heroin self-administration beyond the dark phase and into the light phase to the point of producing an ‘around the clock’ escalation in drug intake. Although only one representative rat was chosen for this demonstration, the event recordings of all other rats in the present study showed a similar pattern of escalated heroin intake over time, as quantified in the increased MESOR of cosinor analysis. Cosinor analysis revealed a significant, progressive increase in MESOR with time (Table 1a) and a sudden positive change in nadir between Day 14 and 21, without increases in amplitude. This finding indicates that the whole drug intake function started to shift upward from Day 14 to 21 and beyond, reflecting the extension of heroin intake into the light cycle. In contrast, the amplitude increased up to Day 14 and then stabilized, which showed that the initial increase in heroin intake up to Day 14 took place almost exclusively during the dark cycle.
In addition, studies have shown that chronic opiate administration results in an increased wakefulness during the sleep (or light) phase of the sleep/wake cycle in rats (Young et al, 1977; Young and Khazan, 1987; Robert et al, 1999), cats (De Andres and Caballero, 1989), and human subject volunteers (Babor et al, 1976; Kay et al, 1981). In a direct electroencephalogram (EEG) examination of a heroin dose effect on sleep using nondependent opiate users, it was found that heroin produces a dose-related increase in wakefulness and shifts in sleep–waking states, and accordingly a dose-related decrease in total sleep, sleep efficiency, delta sleep, and REM sleep (Kay et al, 1981). Thus, an important factor contributing to the escalation of drug intake may be the disruption of sleep processes following continued drug access. This suggestion is supported further by studies showing that the lateral hypothalamic neuropeptide orexin (also called hypocretin) may regulate sleep, as well as arousal, feeding, and energy maintenance (see Willie et al, 2001; Georgescu et al, 2003; Boutrel and Koob, 2004; Sakurai, 2005). Moreover, given the lateral hypothalamus's role in reward and motivation (see Harris et al, 2005), orexin has been hypothesized to mediate responses to drugs of abuse (see DiLeone et al, 2003; Harris et al, 2005; Boutrel et al, 2006). A recent study has revealed that orexin neurons possess _mu_-opiate receptors and that orexin knockout mice show an attenuated response to naloxone-precipitated opiate withdrawal, suggesting that orexin neurons may contribute to physical dependence and expression of withdrawal (Georgescu et al, 2003). These findings raise the possibility that the dysregulation of sleep processes and feeding pattern across the sleep/wake cycle during the transition to opiate dependence may be mediated by concurrent changes in orexin's regulatory function in sleep, arousal, feeding, and energy maintenance.
The present data support the hypothesis that changes in food intake in heroin-dependent rats may serve as an important marker of the transition to opiate dependence. Daily, extended access to intravenous heroin profoundly blunted the circadian amplitude of food ingestion within 1 week, by markedly reducing nocturnal food intake, while increasing diurnal ingestion (Tables 1 and 2; Figures 4, 5, 6 and 7). Nocturnal intake decreased because rats consumed smaller and briefer meals, whereas diurnal intake increased due to increased meal frequency (Figure 6). The decrease in nocturnal intake was progressive, such that daily total food intake of dependent rats was significantly reduced as early as Day 7 of unlimited heroin access (Figures 6a and 7a). Although acute administration of experimenter (see Yeomans and Gray, 2002) and self-administration (van Ree et al, 1978) of opiates can stimulate feeding in rodents, repeated passive administration appears to have substantially different effects. Indeed, the rapid blunting of circadian ingestive amplitude and the progression towards decreased total daily food and water intake observed herein closely mirror results observed following repeated (5–10 days) passive administration of heroin (Thornhill et al, 1976, 1978; Bhakthan and Chiu, 1978), morphine (Thornhill and Saunders, 1983), and codeine (Thornhill et al, 1978) under schedules sufficient to induce dependence. The similar pattern of results observed in self- vs passive administration suggests that changes in food intake in the present model likely do not simply reflect competing costs of drug intake or the coincidental wakefulness of a dependent rat interrupting sleep to obtain drug and to ward off withdrawal. Rather, these changes in feeding are hypothesized to be early hallmarks or possibly even predictors of opiate dependence.
Further support for this hypothesis was seen in rats withdrawn from heroin. Thornhill et al (1976) showed that food intake in rats consistently returned to pre-heroin levels within 3 days of heroin withdrawal. Moreover, the temporal pattern of feeding gradually returned towards that in the pre-heroin period, with 70–85% of total daily food consumed during the dark, active phase (Thornhill et al, 1976). Although the present study did not directly assess this effect of heroin withdrawal on food intake, a head-to-head comparison of heroin vs saline rats (discussed further below) showed the characteristic shift towards reduced nocturnal and increased diurnal food intake in the heroin rats by Day 7, but a relatively unchanged pattern of food intake in saline rats that remained stable up to Day 14. Clinically, two-thirds of hospitalized, but otherwise healthy, heroin addicts reported reduced food and drink consumption, with their degree of anorexia and malnutrition correlating directly with their degree of addiction, as defined by daily drug consumption (Santolaria-Fernandez et al, 1995). Meals were frequently skipped and, when taken, were often ‘snacks’ (Santolaria-Fernandez et al, 1995), possibly consistent with the reduced acrophase consistency and nocturnal meal size observed herein with the cosinor analysis. Correspondingly, almost all (92.4%) heroin-dependent patients fell below the population mean for weight, albeit few dramatically so (Santolaria-Fernandez et al, 1995). Weight loss also distinguishes heroin dependence from alcoholism (Steer et al, 1985). Thus, decreases in food intake in heroin-dependent rats found herein suggest that the present animal model has strong face validity and that changes in feeding pattern can serve as early indicators of the transition to heroin dependence.
Blunting of circadian amplitude may mark opioid dependence as well, because opiate-dependent rats also exhibit blunted temperature rhythms (Thornhill et al, 1976) and impairment of both wakeful and sleep states (Robert et al, 1999) during intoxication. Interestingly, residual signs of a blunted behavioral arousal rhythm persist for weeks following detoxification into protracted withdrawal, suggesting that this may be a residual marker of opiate dependence (Stinus et al, 1998). Likewise, blunted or absent circadian rhythms for gonadal (Bolelli et al, 1979) and hypothalamic–pituitary–adrenal hormone levels (Facchinetti et al, 1985) have been observed in patients with heroin dependence. Each finding, like the present results, was associated with an increase in the nadir of the circadian rhythm.
It is important to emphasize further the value of circadian analysis of intake measures in this model through cosinor analysis. First, cosinor analysis quantified how escalation occurred—primarily in the dark cycle for the first 2 weeks of access, after which drug intake escalated across the entire 24-h day. Second, cosinor analysis showed via changes in the variability of the acrophase of responding that heroin came to have a more consistent regulatory importance to rats than another natural reinforcer. That is, rats began to control drug intake more regularly in time across the day than they regulated food intake (see Acrophase standard errors in Table 1a vs 1b). Third, the circadian analysis of food intake showed that self-administration of heroin produced the same blunting of dark/light amplitude that occurred after passive drug administration. Finally, the food and water cosinor analyses demonstrated that changes in the circadian pattern of drug intake across the day were specific to heroin, and were not observed with other reinforcers.
A possible alternative explanation for circadian changes in feeding is that the suppression of food (and thus also water) consumption in association with heroin self-administration only during the dark phase would be expected to induce compensatory food/water consumption in the light phase due to the multiple homeostatic mechanisms which defend the overall caloric intake, energy balance and maintenance of body weight—rather than reflect a process related to, or even a functional harbinger of, dependence. This interpretation is rooted in the role of the hypothalamus in maintaining homeostatic processes (see Bernardis and Bellinger, 1993, 1996). Under this perspective, increases in diurnal feeding would reflect a compensation for heroin-induced decreases in nocturnal feeding (see Tables 1a, b and Figures 4b, c). Arguing against this interpretation, however, even when heroin intake did escalate into the light phase, there was no corresponding decrease in the concurrent nadir of food intake. Also, from Day 14 to 35, the peak (dark phase maximum) and nadir (light phase minimum) of drug intake increased together by the same magnitude (see Table 1a and Figure 4b). Under the view that heroin only directly suppressed concurrent feeding, it should be predicted that from Day 14 to 35 the peak and nadir of feeding also should decrease together. However, this was not the case; the dark cycle feeding continued to decrease selectively (see Table 1b and Figure 4c). For these reasons, the compensatory energy balance explanation is not a strong alternative explanation for the increase in diurnal feeding, as it does not account for why only diurnal feeding is spared in the face of concurrent heroin self-administration.
The current study also examined whether the eating pattern of the rats changes as a function of time or experience in the self-administration chambers. This assessment was performed using a head-to-head comparison of meal intake changes over time in rats tethered with drug (heroin) delivery vs rats tethered with no drug (saline) delivery. Similar to the findings in the primary group of heroin rats, the heroin rats in this comparison experiment revealed decreases in nocturnal quantity and duration of feeding, as well as average meal size and meal duration within 1 week of heroin self-administration (Figure 7). The corresponding biorhythmic changes in food intake were found by Day 7 in heroin rats, but not saline controls. Altogether, these findings demonstrate that time or experience in the self-administration chambers may not be a major confound for changes in food intake pattern during the development of opiate dependence. Furthermore, the 2% relative decrease in body weight at Day 14 for the heroin rats suggests that an increase in heroin intake over time significantly retards body weight gain. This finding is in keeping with the slight ‘underweight’ condition found with heroin addicts (Santolaria-Fernandez et al, 1995).
Essential to the current model is the underlying conceptualization of drug dependence. The present study examined not only the physical definition of dependence (naloxone-precipitated withdrawal) but also what could be construed as a model for a symptom of the psychological definition of dependence (escalation in heroin intake over time and in response to a low-dose opiate receptor antagonist challenge). Consistent with the significant increase in heroin intake found by Day 14, a parallel increase in the physical signs of withdrawal was found. A particular consideration is whether the increase in drug-taking results from physical signs of withdrawal and/or tolerance. Although withdrawal and tolerance are major signs associated with drug dependence, neither of them is necessary or sufficient for defining drug dependence (O'Brien, 2001). However, according to the reward allostasis hypothesis (see Koob and Le Moal, 1997, 2001; a modification of Solomon and Corbit's (1974) classical opponent-process theory of motivation), the increase in heroin intake reflects an underlying chronic decrease in reward sensitivity (motivational symptoms of withdrawal) induced by prolonged drug exposure (Ahmed and Koob, 2004). Similar to a previous study where rats received 11-h daily heroin sessions (Ahmed et al, 2000), rats in the present study with continuous 23-h daily heroin access showed a stabilized, escalated heroin intake (see Figure 1, days 27–35) at a peak level at least twice greater than that prior to escalation. This finding provides further evidence of a change in set point for heroin self-administration (ie, drug reward) that could be responsible for the transition to drug dependence. To confirm fully this hypothesized change in reward set point, it would be necessary to show post-escalation vertical shifts in drug intake levels for various unit doses of self-injected heroin, with both a decrease in the effects of the drug (increased intake for all unit doses) and an increase in the motivation to take the drug (increased peak) (Ahmed et al, 2000; Ahmed and Koob, 2004). It is also understood that tolerance to the drug effects plays a role in shifting the dose–injection curve to the right. However, it has been posited that both tolerance to and the increased motivation for the drug effects result from the same underlying reward deficit (reward allostasis) and that both are required for the unique vertical shift of the dose–injection curve found after escalation of drug self-administration (Ahmed and Koob, 2004).
The major source of potential allostatic changes that drives the transition to drug dependence may be the changes in the brain systems associated with the development of the motivational aspects of drug withdrawal (ie, negative reinforcement) (Koob et al, 2004). Specifically, decreases in the function of dopamine, serotonin, and opioid peptides are hypothesized to mediate a shift in reward set point as well as recruit brain stress systems (eg, corticotropin-releasing factor) (Koob and Le Moal, 2001). All of these changes are hypothesized to be focused on a dysregulation of function within the neurocircuitry of ‘the extended amygdala’, which refers to a basal forebrain macrostructure composed of the bed nucleus of the stria terminalis, the central and medial amygdala, and a transition zone in the posterior medial part of the nucleus accumbens (eg, shell) (Heimer and Alheid, 1991). This system receives afferents from limbic and olfactory cortices and projects heavily to the hypothalamic and midbrain regions, linking the basal forebrain to the classical reward systems of the lateral hypothalamus via the medial forebrain bundle reward system (Koob et al, 2004). Possibly, this neurocircuitry provides further support for the suggestion that orexin/hypocretin activity contributes to the dysregulation of food intake patterns during the transition to opiate dependence.
The results that rats made dependent on heroin using the present model increased their heroin intake in response to a naloxone injection and decreased their responses for heroin to a buprenorphine injection support the major hypothesis that the underlying motivational mechanism for continued drug intake is the self-regulated reduction of negative affect associated with withdrawal and withdrawal-related stress (see Koob and Le Moal, 1997, 2001). The present finding that the partial opiate agonist buprenorphine produced a dose-dependent decrease in heroin intake in heroin-dependent rats is consistent with previous findings in opiate-dependent nonhuman primates (Mello et al, 1983; Winger et al, 1992) and humans (Mello and Mendelson, 1980; Comer et al, 2001, 2002), and as such provide some predictive validity for the current model. Interestingly, the doses selected for buprenorphine in the present study were effective in reducing the self-administration of other drugs of abuse in rats (Martin et al, 1983; Myers et al, 1984; Carroll and Lac, 1992; June et al, 1998). All low doses selected for naloxone were effective in increasing drug intake in heroin-dependent rats, similar in part to a previous study (Carrera et al, 1999). However, the highest dose (0.03 mg/kg) previously failed to produce the compensatory response in heron intake (Carrera et al, 1999). A possible explanation for increased heroin intake to the highest dose of naloxone in the current study may be the greater level of heroin dependence in the present group of rats that was tested after 7 weeks of 23-h daily heroin intravenous self-administration sessions, as compared with the previous group of rats (Carrera et al, 1999) that was tested after 2 weeks of a concurrent schedule of two 75-mg s.c. pellet implants and 1- or 3-h daily heroin intravenous self-administration sessions. Overall, this finding demonstrates the robust level of dependence produced by the present unlimited heroin access model.
In summary, the present unlimited access to heroin model revealed key changes in drug and food intake that occurred during the development of opiate dependence. The differential rate of change in drug vs food intake in rats with unlimited access to heroin suggests that food intake pattern changes may be a separate, earlier indicator of the transition to drug dependence. Furthermore, consistent with past animal (Young et al, 1977; Young and Khazan, 1987; Robert et al, 1999) and clinical research (Babor et al, 1976; Kay et al, 1981), the present study showed a dysregulation in drug and food intake patterns across the sleep/wake cycle over 35 days of unlimited access to heroin. Chronic drug use produced changes in meal size, meal duration, and body weight similar to the human condition (Santolaria-Fernandez et al, 1995). In addition, cosinor analyses of the data demonstrated reliable measures of biorhythmic changes in heroin and food intake produced by increased heroin intake over time. Finally, the results showing escalated heroin intake, escalated withdrawal signs, increased heroin intake in response to low-dose naloxone, and decreased heroin intake in response to buprenorphine support previous findings and provide strong validity for the unlimited access model of opiate dependence.
