The gigatonne gap in China’s carbon dioxide inventories (original) (raw)
- Letter
- Published: 10 June 2012
Nature Climate Change volume 2, pages 672–675 (2012) Cite this article
- 5829 Accesses
- 542 Citations
- 117 Altmetric
- Metrics details
Subjects
This article has been updated
Abstract
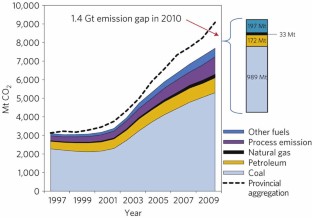
Reliable national statistics are fundamental for climate change science as well as for global negotiations about future emission targets and the allocation of responsibilities. China, the world’s top CO2 emitter1,2, has frequently been questioned about its data transparency and accuracy of energy and emission statistics 3,4,5,6,7. China implemented a top-down statistical system where energy statistics are compiled under the aegis of the National Bureau of Statistics (NBS) at the central government level, which oversees and coordinates the corresponding statistical departments at provincial and county levels8. The NBS publishes annually both national and provincial energy statistics. We compile the CO2 emission inventories for China and its 30 provinces for the period 1997–2010. However, CO2 emissions calculated on the basis of the two publicly available official energy data sets differ by 1.4 gigatonnes for 2010. The figure is equivalent to Japan’s annual CO2 emissions, the world’s fourth largest emitter, with 5% of the global total. Differences in reported coal consumption in coal washing and manufacturing are the main contributors to the discrepancy in official energy statistics. This paper presents an initial step to share and validate data and discuss methodologies in full transparency towards better energy and emission data for China.
This is a preview of subscription content, access via your institution
Access options
Subscribe to this journal
Receive 12 print issues and online access
$259.00 per year
only $21.58 per issue
Buy this article
- Purchase on SpringerLink
- Instant access to the full article PDF.
USD 39.95
Prices may be subject to local taxes which are calculated during checkout
Additional access options:
Figure 1: The sources of China’s CO2 emissions by fuel type during 1997–2010.
The alternative text for this image may have been generated using AI.
Figure 2: Comparison of China’s emission and energy statistics.

The alternative text for this image may have been generated using AI.
Figure 3: Comparison of industrial outputs in physical units between China’s national and provincial statistics in 2010.

The alternative text for this image may have been generated using AI.
Change history
14 June 2012
In the version of this Letter originally published online, the affiliation for Dabo Guan, Zhu Liu and Yong Geng was incorrect. This has been corrected in all versions of the Letter.
References
- Guan, D., Peters, G. P., Weber, C. L. & Hubacek, K. Journey to world top emitter—an analysis of the driving forces of China’s recent emissions surge. Geophys. Res. Lett. 36, L04709 (2009).
Article Google Scholar - Peters, G. P. et al. Rapid growth in CO2 emissions after the 2008–2009 global financial crisis. Nature Clim. Change 2, 2–4 (2012).
Article CAS Google Scholar - Liu, J. & Yang, H. China fights against statistical corruption. Science 325, 675–676 (2009).
Article CAS Google Scholar - Peters, G., Webber, C., Guan, D. & Hubacek, K. China’s growing CO2 emissions—A race between lifestyle changes and efficiency gains. Environ. Sci. Technol. 41, 5939–5944 (2007).
Article CAS Google Scholar - Sinton, J. E. Accuracy and reliability of China’s energy statistics. China Econom. Rev. 12, 372–383 (2001).
Google Scholar - Sinton, J. E. & Fridley, D. G. What goes up: Recent trends in China’s energy consumption. Energ. Policy 28, 671–687 (2000).
Article Google Scholar - Marland, G. Uncertainties in accounting for CO2 from fossil fuels. J. Industr. Ecol. 12, 136–139 (2008).
Article CAS Google Scholar - Holz, C. A. China’s statistical system in transition: Challenges, data problems, and institutional innovations. Rev. Income Wealth 50, 381–409 (2004).
Article Google Scholar - National Bureau of Statistics China Energy Statistical Yearbook (Various Years) (Department of Industry and Transport Statistics, Energy Bureau National Development Reform Commission, Eds, China Statistics Press, 1995–2011).
- IPCC Guidelines for National Greenhouse Gas Inventories (Intergovernmental Panel on Climate Change, 2006).
- Aden, N. Initial Assessment of NBS Energy Data Revisions (Ernest Orlando Lawrence Berkeley National Laboratory, China Energy Group, 2010).
Google Scholar - Wu, L., Kaneko, S. & Matsuoka, S. Driving forces behind the stagnancy of China’s energy-related CO2 emissions from 1996 to 1999: The relative importance of structural change, intensity change and scale change. Energ. Policy 33, 319–335 (2005).
Article Google Scholar - Streets, D. G. et al. Recent reductions in china’s greenhouse gas emissions. Science 294, 1835–1837 (2001).
Article CAS Google Scholar - Wu, H. C. The Chinese GDP growth rate puzzle: How fast has the chinese economy grown? Asian Econom. Paper 6, 1–23 (2007).
Article Google Scholar - Price, L., Wang, X. & Yun, J. China’s Top-1000 Energy-Consuming Enterprises Program: Reducing Energy Consumption of the 1000 Largest Industrial Enterprises in China (Ernest Orlando Lawrence Berkeley National Laboratory, 2008).
Google Scholar - China Coal Information Institute China Coal Industry Yearbook 2009 (Coal Industry Press, 2011).
- Price, L. et al. Energy use and carbon dioxide emissions from steel production in China. Energy 27, 429–446 (2002).
Article CAS Google Scholar - NDRC Overview of the 11th Five Year Plan for National Economic and Social Development. (National Development and Reform Commission, 2006).
- Geng, Y. Eco-indicators: Improve China’s sustainability targets. Nature 477, 162 (2011).
Google Scholar - Akimoto, H., Ohara, T., Kurokawa, J. & Horii, N. Verification of energy consumption in China during 1996–2003 by using satellite observational data. Atmos. Environ. 40, 7663–7667 (2006).
Article CAS Google Scholar - Jiao, L. & Stone, R. China looks to balance its carbon books. Science 334, 886–887 (2011).
Article CAS Google Scholar - Guan, D. & Hubacek, K. China can offer domestic emission cap-and-trade in post 2012. Environ. Sci. Technol. 44, 5327 (2010).
Article CAS Google Scholar - Fridley, D., Zheng, N. & Qin, Y. Inventory of China’s Energy-Related CO2 Emissions in 2008 (Ernest Orlando Lawrence Berkeley National Laboratory, China Energy Group, 2011).
Book Google Scholar - National Bureau of Statistics China Statistical Yearbook 2009 (China Statistics Press, 2010).
- Peters, G. P., Weber, C. & Liu, J. Construction of Chinese Energy and Emissions Inventory IndEcol Report 4/2006 (Norwegian University of Science and Technology, 2006).
- Guan, D., Hubacek, K., Weber, C. L., Peters, G. P. & Reiner, D. M. The drivers of Chinese CO2 emissions from 1980 to 2030. Glob. Environ. Change 18, 626–634 (2008).
Article Google Scholar - Minx, J. C. et al. A Carbonizing Dragon: China’s fast growing CO2 emissions revisited. Environ. Sci. Technol. 45, 9144–9153 (2011).
Article CAS Google Scholar - Weber, C. L., Peters,, Glen, P., Guan, D. & Hubacek, K. The contribution of chinese exports to climate change. Energ. Policy 36, 3572–3577 (2008).
Article Google Scholar - Guan, D. & Barker, T. S. Low carbon development in the least developed region: A case study of Guangyuan, Sichuan province, southwest China. Nat. Hazards 62, 243–254 (2012).
Article Google Scholar
Acknowledgements
This study was supported by the Natural Science Foundation of China (71033004), the Chinese Academy of Sciences (2008-318) and the Ministry of Science and Technology (2011BAJ06B01).
Author information
Authors and Affiliations
- Key Laboratory of Pollution Ecology and Environmental Engineering, Institute of Applied Ecology, Chinese Academy of Sciences, Shenyang 110016, China,
Dabo Guan, Zhu Liu & Yong Geng - School of Earth and Environment, University of Leeds, Leeds, LS2 9JT, UK
Dabo Guan - St Edmund’s College, University of Cambridge, Cambridge, CB3 0BN, UK
Dabo Guan - Graduate University of Chinese Academy of Sciences, Beijing, 100049, China
Zhu Liu - Department of Land Economy, University of Cambridge, Cambridge, CB3 9EP, UK
Sören Lindner - Department of Geographical Sciences, University of Maryland, College Park, Maryland 20742, USA
Klaus Hubacek
Authors
- Dabo Guan
- Zhu Liu
- Yong Geng
- Sören Lindner
- Klaus Hubacek
Contributions
D.G. and Z.L. designed the research; Z.L., S.L. and D.G. compiled the data; D.G. and Z.L. performed initial analysis; all authors contributed to the results’ interpretations and writing.
Corresponding authors
Correspondence toZhu Liu or Yong Geng.
Ethics declarations
Competing interests
The authors declare no competing financial interests.
Supplementary information
Rights and permissions
About this article
Cite this article
Guan, D., Liu, Z., Geng, Y. et al. The gigatonne gap in China’s carbon dioxide inventories.Nature Clim Change 2, 672–675 (2012). https://doi.org/10.1038/nclimate1560
- Received: 15 December 2011
- Accepted: 01 May 2012
- Published: 10 June 2012
- Issue date: September 2012
- DOI: https://doi.org/10.1038/nclimate1560