Pharmacological induction of pancreatic islet cell transdifferentiation: relevance to type I diabetes (original) (raw)
Main
The response of a tissue to stress/injury can involve cell death and proliferation. However, it has become increasingly recognized that changes in cellular differentiation state can have an important role.1 In type I diabetes (T1D), the established view has been that the primary pathophysiological event is _β_-cell apoptosis due to a _β_-cell specific autoimmune response,2 leading to profound _β_-cell deficiency. Thus, there has been great interest in inducing _β_-cell neogenesis, but there has been controversy over how and even whether _β_-cell regeneration occurs.3
Activation of dedicated stem/progenitor cells within the pancreas and transdifferentiation of other differentiated cell types to _β_-cells are two potential mechanisms. In the past, the prevailing paradigm has been that neogenesis proceeds by the activation of facultative _β_-cell stem/progenitors within pancreatic ducts.4, 5, 6, 7 However, more recent studies have not found evidence of robust _β_-cell neogenesis from ducts.8, 9, 10, 11 _β_-cell neogenesis from other cell types within the pancreas, including acinar12 and centroacinar13 cells has also been reported.
Recently, we demonstrated robust _β_-cell neogenesis by transdifferentiation from preexisting _α_-cells in a model of T1D where severe _β_-cell deficiency was induced by high-dose alloxan.14, 15 In this model, _β_-cell neogenesis from _α_-cells was stimulated by pancreatic duct ligation (PDL).9, 15 Surgical reversal of PDL led to the recovery of _β_-cell mass and function by a combination of _β_-cell replication and _β_-cell neogenesis, demonstrating that _β_-cell regeneration by _α_- to _β_-cell neogenesis could be a robust approach to diabetes therapy,16 but PDL, which involves major surgery, is not a practical approach to therapy. Importantly, the relevance of _α_- to _β_-cell transdifferentiation to human biology remained unclear, as previous studies were performed in rodents.
Here, we report the occurrence of efficient islet cell transdifferentiation using an entirely pharmacologically based approach where the peptide caerulein,17, 18 substituting for PDL, stimulated _β_-cell transdifferentiation from _α_-cells in mice rendered severely _β_-cell deficient by alloxan. Following caerulein plus alloxan, many of the neogenic _β_-cells went on to form _δ_-cells. In murine and human T1D, a similar process appeared to occur, where _α_-cells transdifferentiated into _β_-cells, which went on to form _δ_-cells. This led to a marked _δ_-cell excess in both murine and human T1D.
The finding of endocrine cell transdifferentiation in T1D supports a new paradigm where _β_-cells, in addition to undergoing destruction by inflammatory mediators, undergo a dynamic process of neogenesis from _α_-cells and transdifferentiation to _δ_-cells. Controlling the neogenic process could lead to a new approach to diabetes therapy.
Results
Caerulein plus alloxan induced _α_-cells transdifferentiation into _β_-cells
As expected,17, 19 caerulein-induced severe disruption of the acinar pancreas (Supplementary Figures 1A–D) associated with almost the complete loss of the acinar cell marker amylase (compare Supplementary Figures 1E and G). This was transient, with recovery by 11 days post caerulein injection (Supplementary Figures 1A–D). Caerulin injection induced marked infiltration with CD3-positive lymphocytes, in contrast with alloxan injection that did not induce lymphocytic infiltration (Supplementary Figures 1E–H). Caerulein had no effect on islet morphology or hormone expression (Supplementary Figures 1A–E). Alloxan induced _β_-cell ablation, which we found previously to be required for endocrine cell transdifferentiation9 (Supplementary Figures 1G and H).
In our previous study of _α_- to _β_-cell transdifferentiation, employing PDL plus alloxan to induce transdifferentiation,9 the evidence for transdifferentiation as a cause of the increased _β_-cell mass was the finding of a high frequency of intermediates with glucagon–insulin coexpression, as well as the presence of little _β_-cell replication or neogenesis within ducts.9 The high mortality following PDL plus alloxan hampered the genetic lineage tracing, which is considered to be the gold standard for determining lineage relationships. However, the alloxan plus caerulein model had lower mortality, allowing us to perform such studies.
For genetic lineage tracing of _α_-cells, we used mice expressing membrane-localized enhanced green fluorescent protein (eGFP; membrane-localized enhanced green fluorescent protein (mG)) on their _α_-cells while expressing membrane-localized Tomato (mT) on all other cells (Glu-mT/mG; Figure 1a). Pancreases from Glu-mT/mG mice treated with alloxan alone or alloxan plus caerulein were analyzed 20 and 38 days post alloxan injection. In mice treated with alloxan alone, the few remaining _β_-cells expressed mT. Following alloxan plus caerulein, insulin-positive cells expressing mG, indicating an origin from recombined _α_-cells, were easily detected (Figures 1b–e, h, quantified in i, Supplementary Movie 1). At day 20, 5.5% of mG-positive cells were positive for insulin, which translated to 18% of all _β_-cells. All such cells were in islets. No mG-positive cells expressing glucagon or insulin were ever found in the ducts (Supplementary Figure 2). Following alloxan alone, mG-positive cells expressing insulin were extremely rare (1% at day 20). At day 38 post caerulein plus alloxan, 9% of _β_-cells were mG-positive, compared with 1% following alloxan alone (Figure 1i). Considering that the _α_-cell recombination efficiency in this experiment was 62% (Figure 1), approximately 29% of _β_-cells present at 20 days following alloxan plus caerulein arose from _α_-cells. Thus, caerulein stimulated a dramatic increase in _α_- to _β_-cell transdifferentiation.
Figure 1
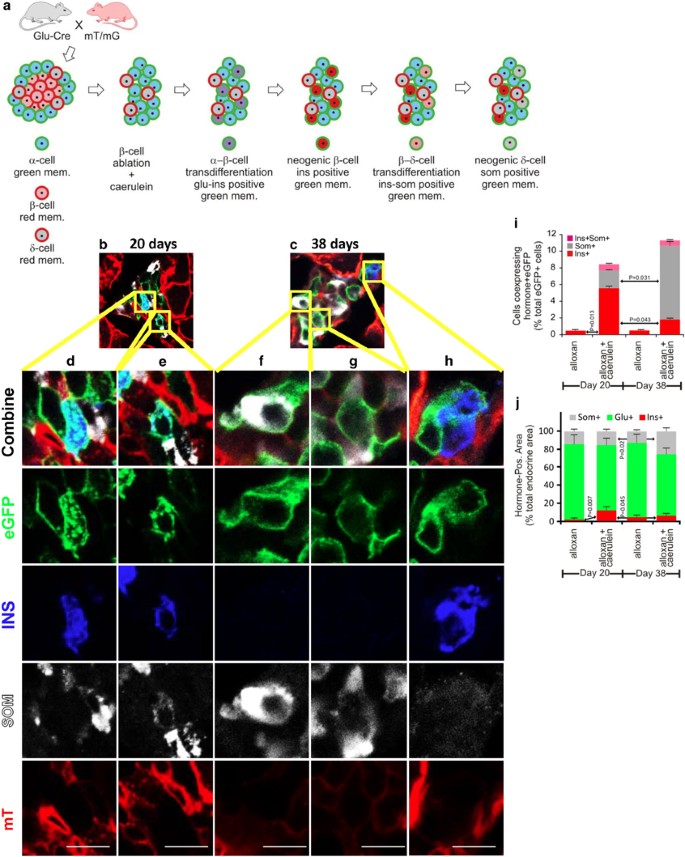
Genetic lineage tracing demonstrated transdifferentiation of _α_-cells to _β_- and _δ_-cells following alloxan plus caerulein. (a) Glu-mT/mG mice were injected with caerulein and alloxan as described in the Materials and Methods section. The recombination efficiency in _α_-cells was 0.62+/−0.047 (S.E.M.), calculated as the number of _α_-cells expressing eGFP/_α_-cells expressing eGFP(green) plus mT (red). (b and c) Representative low-power photomicrographs of islets from mice killed at days 20 and 38, respectively, showing transdifferentiated _β_- (blue) and _δ_-cells (white). (d–h) High-power views of the regions from b and c showing lineage-marked cells expressing insulin (d and h), somatostatin (f and g) or both (e). (i) Quantification of _β_- and _δ_- cell transdifferentiation from _α_-cells. Note that no eGFP-positive cells expressing somatostatin were detected after alloxan alone. (j) Quantification of the frequency of islet cell types during alloxan alone or alloxan+caerulein at days 20 and 38. For the day 20 time point, 317 cells islet cells were quantified in the alloxan alone condition and 605 cells were quantified in the alloxan plus caerulein condition. For the day 38 time point, 309 cells islet cells were quantified in the alloxan alone condition and 478 cells were quantified in the alloxan plus caerulein condition. Error bars are S.E.M. Scale bar for c–g=10 _μ_m
Caerulein-induced transdifferentiation of _α_-cells into _δ_-cells through a _β_-cell intermediate
A comparison between days 20 and 38 of the frequency of insulin-positive and somatostatin-positive cells revealed a substantial increase over time in mG-positive cells expressing somatostatin and a corresponding decrease in cells expressing insulin (Figures 1f and g, quantified in i). Following alloxan plus caerulein, somatostatin-positive cells expressing mG, indicating an origin from recombined _α_-cells, rose from 2.1% of mG-positive cells at day 20 to 8.2% at day 38 (Figures 1b–e and h, quantified in i, Supplementary Movie 1), but were absent from samples from mice treated with alloxan alone. A cell coexpressing mG, insulin and somatostatin is shown in Figure 1e, consistent with transdifferentiated _β_-cells going on to form _δ_-cells. Following alloxan alone, no cells coexpressing mG and somatostatin were found (Figure 1i and Supplementary Movie 1).
Transdifferentiation of _α_- cells induced by alloxan plus caerulein proceeded sequentially, with _β_-cells being formed initially, followed by _β_- to _δ_-cell transdifferentiation
Transdifferentiation of _α_-cells to _β_- and _δ_-cells could have arisen by two possible routes; either as two independent transdifferentiation processes: _α_- to _β_-cells and _α_- to _δ_-cells in parallel, or as a linear process where _α_-cells convert to _β_- and then to _δ_-cells. To distinguish between those possibilities, we undertook a time course analysis to evaluate the frequency of intermediates in the process of transdifferentiation. This was done with C57Bl/6 mice, with a higher dose of caerulein (50 _μ_g/kg/injection), increasing the number of transdifferentiating cells from 12+/−2.3 (Figure 1j) to 22+/−4 (Figure 2j).
Figure 2
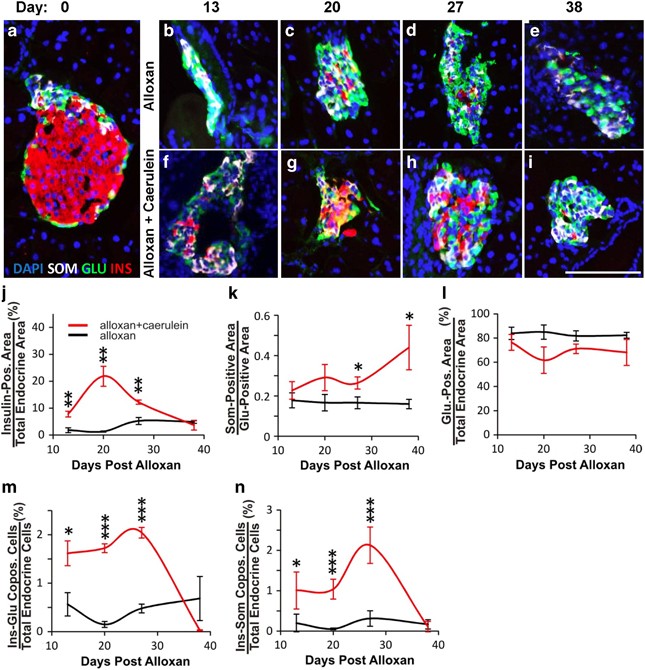
Time course analysis demonstrated the transdifferentiation from _α_- to _β_- to _δ_-cells following alloxan plus caerulein. Mice were killed and pancreas harvested at days 13, 20, 27 and 38 following the initiation of alloxan +/− caerulein treatment on day 1. (a) A typical islet of Langerhans from an untreated C57BL/6 mouse demonstrating a preponderance of _β_-cells (insulin-red) located internal to a ring of _α_-cells (glucagon-green) and _δ_-cells (somatostatin-white). DAPI (blue nuclear stain). (b–e) Islets from mice injected with alloxan alone demonstrated continued preponderance of _α_-cells, with few _δ_-cells or residual _β_-cells over time. (f–i) Islets from mice injected with alloxan plus caerulein demonstrated a dramatic increase of _β_- and _δ_-cells over time. (j) Quantification of insulin-positive area over time, demonstrating a peak of _β_-cell formation at day 20 following alloxan plus caerulein (red line), with no significant change following alloxan alone (black line). (k) Quantification of the somatostatin-positive area normalized to the glucagon-positive area to control for effects of _β_-cell ablation on the somatostatin-positive area, demonstrating a continued increase of _δ_-cell formation over time following alloxan plus caerulein, with no significant change following alloxan alone. (l) Quantification of glucagon-positive area over time, demonstrating a decrease in the number of _α_-cells following alloxan plus caerulein (red line), with no significant change following alloxan alone. (m) Quantification of insulin–glucagon copositive area over time, demonstrating an increase of cells coexpressing insulin and glucagon following alloxan plus caerulein until day 38, when such cells were no longer present. There was no significant change in insulin–glucagon copositive cells following alloxan alone, never rising above the background. (n) Quantification of insulin–somatostatin copositive area over time, demonstrating an increase of cells coexpressing insulin and somatostatin following alloxan plus caerulein, peaking at day 27 and disappearing by day 38. There was no significant change in insulin–somatostatin copositive cells following alloxan alone, never rising above the background. Error bars are S.E.M. *P<0.05, **P<0.005, ***P<0.0005. Scale bar=75 _μ_m
Mice were killed at days 13, 20, 27 and 38 following alloxan plus caerulein or alloxan alone. At day 13, islets in both groups consisted primarily of _α_-cells and _δ_-cells (Figures 2b and f, respectively-compare with normal islet in Figure 2a). However, at day 13, there were consistently more _β_-cells in islets of the alloxan plus caerulein group (7.8% of total endocrine cells) compared with the alloxan alone group (1.3% of total endocrine cells; Figure 2f versus b, quantified in j). This trend continued to day 20, when 22% of the total endocrine cells in the alloxan plus caerulein group expressed insulin (Figure 2g versus c, quantified in j), but the number of _β_-cells then declined at day 27 (Figure 2h versus d, quantified in j) and 3.7% at day 38 (Figure 2i versus e, quantified in j). Consistent with the lineage tracing study, the decreased number of _β_-cells occurred concomitantly with an increase in the number of _δ_-cells (Figures 2g–i, quantified in 2k). The number of _α_-cells did not change significantly (Figure 2l). This was expected, given our previous finding that _α_-cells replicate following PDL plus alloxan.14
The initial rise in _β_-cell number followed by a decline (Figure 2j), occurring concomitantly with a late rise in the number of _δ_-cells (Figure 2k), was consistent with the genetic lineage tracing experiment (Figure 1i). Thus, both the lineage tracing and time course experiments support a model where transdifferentiation occurred by a process where _α_-cells first converted into _β_-cells, with _δ_-cell formation occurring later.
Intermediate cells predicted to exist as a consequence of _α_- to _β_- to _δ_-cell transdifferentiation are present following alloxan plus caerulein
A sequential process of _α_- to _β_- to _δ_-cell transdifferentiation should lead to intermediates with glucagon–insulin or insulin–somatostatin but not glucagon–somatostatin coexpression, whereas if _δ_-cells formed directly from _α_-cells, intermediate cell types coexpressing glucagon and somatostatin should be found. As predicted by the _α_- to _β_- to _δ_-cell model, glucagon–insulin coexpression was high at day 13, the earliest time-point studied, declined at day 27 and persisted until day 38 (Figure 2m). Insulin–somatostatin coexpressing cells rose later, peaking at day 27 (Figure 2n). Glucagon–somatostatin coexpression was never found at any time-point.
The sequential model predicts that transcription factors expressed in _β_-cells should be found in cells with glucagon–insulin and insulin–somatostatin coexpression. Thus, we examined the expression of the transcription factors pancreas–duodenum homeobox 1 (PDX1) and NK homeobox 6.1 (NKX6.1). Both of the transcription factors are expressed in all _β_-cells, with NKX6.1 being highly _β_-cell specific,20, 21 while PDX1 is also expressed in a low percentage of _δ_-cells.22 Neither is detected in _α_-cells. Following alloxan plus caerulein, there was a large increase in islet cells coexpressing PDX1 and glucagon, reaching a peak at day 13 when almost 25% of glucagon-positive cells also expressed PDX1 (Figure 3a, quantified in e). Such cells were not found in untreated (Figure 3a, Day 0) or alloxan-injected mice (Supplementary Figure 3A, quantified in Figure 3e).
Figure 3
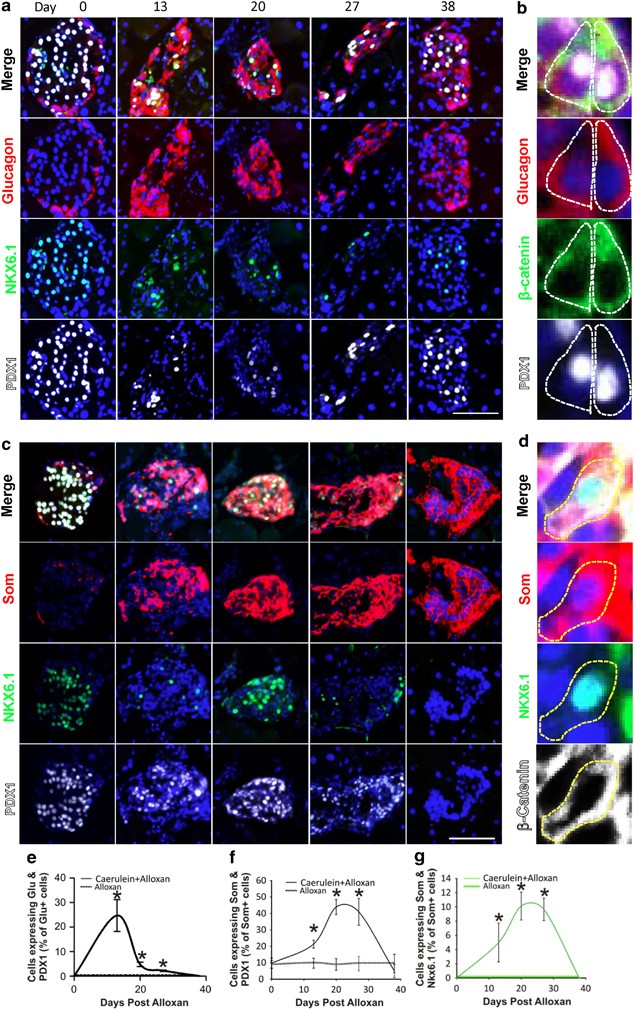
PDX1 and NKX6.1 expression in somatostatin- and glucagon-positive cells following alloxan plus caerulein. (a) Cells coexpressing PDX1 (white) and glucagon (red) were found transiently following alloxan plus caerulein, peaking at day 13 (quantified in e). Coexpression of glucagon and NKX6.1 (green) was not found. (b) _β_-catenin (green), which localizes primarily to the cell membrane, was used to outline cells to confirm coexpression of PDX1 (white) and glucagon (red) in the same cell. PDX1-glucagon coexpression frequently occurred in the absence of insulin expression (Supplementary Figure 4), suggesting that PDX1 induction was an early event in the process of _α_- to _β_-cell transdifferentiation. (c) Cells coexpressing NKX6.1 (green) and somatostatin (red) were found transiently following alloxan plus caerulein, peaking at day 20, but not after alloxan alone (quantified in g; see also Supplementary Figure 3B). Note that in many of the cells coexpressing NKX6.1 and somatostatin at day 20, NKX6.1 was present in the cytoplasm (additional examples in Supplementary Figure 5). (d) _β_-catenin (white) was used to outline cells to confirm the coexpression of NKX6.1 (green) and somatostatin (red). No such cells were found in islets from mice injected with alloxan alone (Supplementary Figure 3B). Further examination of the cells coexpressing NKX6.1 and somatostatin revealed that in cells expressing somatostatin and NKX6.1 but not insulin, the NKX6.1 was invariably cytoplasmic (area outlined in red in Supplementary Figure 5E).39 In cells that coexpressed NKX6.1, somatostatin and insulin, NKX6.1 was usually nuclear (Supplementary Figures 5C–F), but in rare cells was cytoplasmic. No cells coexpressing insulin and somatostatin but not NKX6.1 were found. Cytoplasmic expression of NKX6.1 has been described, with the suggestion that it is controlled by the redox state of the cell and that its localization may be important in Type II diabetes.39 PDX1 also exhibited a transient increase in expression in cells expressing somatostatin, peaking at day 20 (quantified in f), which did not occur following alloxan alone (Supplementary Figure 3) In alloxan-injected mice, expression of PDX1 in _δ_-cells remained constant over time at 9.5% (Supplementary Figure 3B, quantified in Figure 3f), but rose to more than 40% at day 20 in alloxan plus caerulein treated mice (Figure 3c, quantified in f). Scale bar=75 _μ_m
Because of its specificity for _β_-cells in the adult,20, 21 NKX6.1 was informative in revealing the sequence by which transdifferentiation occurred. Unlike PDX1, and in contrast to our previous study,9 no glucagon and NKX6.1 coexpression was found. With regard to _δ_-cell neogenesis, if _δ_-cells arose by a pathway involving a _β_-cell intermediate, there should be cells coexpressing somatostatin and NKX6.1, whereas if _δ_-cells arose directly from _α_-cells, NKX6.1 should never have been expressed and there should be no cells coexpressing somatostatin and NKX6.1. At day 20, 10% of the cells expressing somatostatin coexpressed NKX6.1 (Figure 3c, quantified in g). These observations support a model where _δ_-cell transdifferentiation from _α_-cells obligatorily passes through a _β_-cell intermediate.
Cellular replication is a central aspect of stem cell biology.23 In an independent experiment, mice were administered BrdU continuously following alloxan plus caerulein to mark cells that had replicated. Both BrdU-positive and negative cells that coexpressed insulin and somatostatin coexpression were found at day 20 (Supplementary Figure 6). This is consistent with our previous study of islet cell transdifferentiation9 and indicates that transdifferentiation occurred independently of replication.
In the time course experiment, six mice were maintained for at least 38 days following alloxan plus caerulein, from which two exhibited reduced blood glucose over time, whereas the others remained diabetic (Supplementary Figure 7A). The mice with lower blood glucose were killed at days 38 and 62. In contrast to mice treated with alloxan alone, where _α_-cells were the predominant islet cell type at day 38 (Supplementary Figure 7B), and the alloxan plus caerulein mice that remained diabetic at day 38 and where _δ_-cells predominated (Supplementary Figure 7C), the alloxan plus caerulein mice that became normoglycemic had many _β_-cells in their islets (Supplementary Figure 7D). The islets had an intermixing of _α_-, _β_- and _δ_-cells (Supplementary Figures 7D–H).
Induction of islet cell transdifferentiation by alloxan plus caerulein was islet autonomous
Previously, we and others9, 24 found that profound _β_-cell ablation was required to stimulate endocrine cell transdifferentiation. Moderate _β_-cell ablation (up to 80%) led to _β_-cell replication rather than transdifferentiation.25 This suggested that _α_-cells sensed the number of _β_-cells and only when that fell below a certain threshold did transdifferentiation occur. The sensing mechanism could be a local phenomenon where _α_-cells sensed the proximate _β_-cell number, while sensing of the total _β_-cell mass was also a possibility.
Because the extent of _β_-cell ablation following alloxan injection varied between islets, we were able to measure the extent of transdifferentiation in islets that differed in the number of preexisting _β_-cells that survived alloxan. Using genetic lineage marking to distinguish between preexisting _β_-cells and neogenic _β_-cells, we counted the number of preexisting (mT expressing) and neogenic (mG expressing) _β_-cells in each islet. In islets with efficient _β_-cell ablation, there were many neogenic _β_-cells (Figures 4a–c), whereas in islets with many _β_-cells that survived alloxan, there was little to no transdifferentiation, that is, the _β_-cells expressed mT on their membranes (Figures 4d–f). There was a threshold effect, with the vast majority of transdifferentiated _β_-cells being found in islets with 10 or fewer preexisting _β_-cells that survived alloxan treatment (Figure 4g, _P_=0.0016). Only two mG-positive _β_-cells were found in islets with greater than ten preexisting _β_-cells. The threshold effect is consistent with a locally acting sensing mechanism where each islet behaves autonomously with respect to _β_-cell neogenesis from _α_-cells.
Figure 4
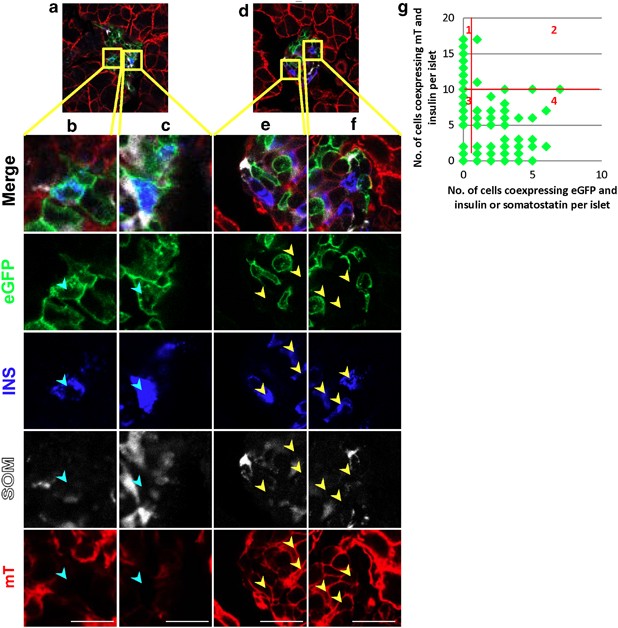
Endocrine cell transdifferentiation is islet autonomous. Photomicrographs of pancreas sections from lineage tracing mice killed 38 days following alloxan plus caerulein. (a) An islet with no preexisting _β_-cells (blue cytoplasmic insulin and red mT membrane fluorescence), demonstrating neogenic _β_-cells (blue cytoplasmic insulin and green eGFP membrane fluorescence; high-power views in b and c, neogenic cells marked with cyan arrowheads). (d) An islet with many preexisting _β_-cells (high-power views in e and f, preexisting cells marked with yellow arrowheads) demonstrating no neogenic _β_- or _δ_-cells. (g) Quantification of neogenic _β_- and _δ_- cells per islet. The number of preexisting _β_-cells in each islet (insulin+, mT+) was plotted against the number of neogenic _β_- plus _δ_-cells (insulin or somatostatin+, eGFP+) in that islet. The _P_-value for the difference between islets in which there were greater than 10 preexisting _β_-cells and at least one eGFP-positive cell expressing insulin or somatostatin (quadrant 2) versus islets in which there were ten or fewer _β_-cells expressing mT and at least one eGFP-positive cell expressing insulin or somatostatin (quadrant 4) was 0.0016, calculated using a two sample proportion test with continuity correction in R. Scale bar for b–f=10 _μ_m
Endocrine cell transdifferentiation in the NOD mouse model of T1D
A logical next step was to examine T1D, the prototypical disease that combines inflammation with _β_-cell deficiency, for evidence of islet cell transdifferentiation. As genetic lineage tracing is not available in NOD mice, hormone colocalization, which we and others have shown to indicate islet cell transdifferentiation,9, 26, 27 was used as a marker. As in the alloxan plus caerulein model, there was an increase in _δ_-cells in the islets of NOD mice as they progressed from prediabetic to diabetic (Figure 5a, quantified in b and Supplementary Text).
Figure 5
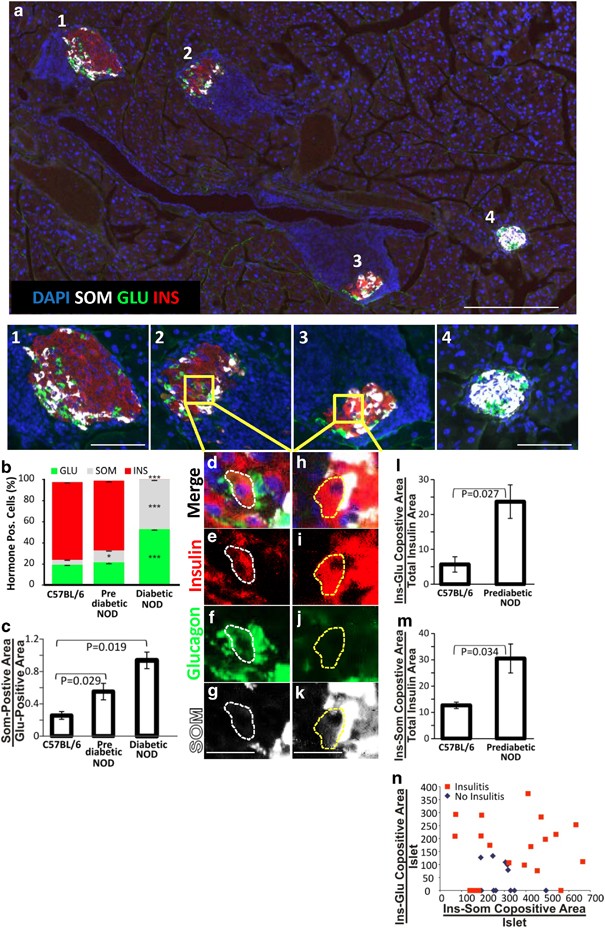
Endocrine cell transdifferentiation leads to an increase in _δ_-cells during the progression to diabetes in NOD mice. (a) A low-power view (scale bar=200 _μ_m) of a prediabetic NOD mouse pancreas, with higher digital magnification (scale bars=75 _μ_m) of four islets that represent different stages in the progression of autoimmune diabetes with Islet 1 having an intact core of _β_-cells in the islet core, Islet 2 exhibiting islet disorganization, Islet 3 exhibiting islet disorganization, _β_-cell loss and _δ_-cell increase and Islet 4 being composed almost entirely of _δ_-cells. Note that Islet 4 has no insulitis, typical of the late-stage diabetic NOD mouse. Confocal high-power images of islets 2 and 3 are shown in Supplementary Figure 9. (b) Quantification of the frequency of islet cell types in control, prediabetic and late-stage NOD mice. (c) δ/α ratio between control, prediabetic and late-stage NOD mice. Areas within the islet in which there is coexpression of multiple hormones, consistent with transdifferentiation, are shown in d–g (insulin and glucagon colocalization) and h–k (insulin and somatostatin colocalization). Scale bars for d–k=20 _μ_m. (l) Quantification of insulin and glucagon colocalization. (m) Quantification of insulin and somatostatin colocalization. Quantitative analysis of hormone colocalization was done using the ImageJ Mander’s coefficient algorithm on confocal images of islets. Confocal images of islets 2 and 3 are shown in Supplementary Figure 9. (n) Quantification in each islet of the relationship between cells coexpressing insulin and glucagon or insulin and somatostatin. Islets with hormone coexpression were plotted by the extent of coexpression and further subdivided by islets with (red squares) and without (blue diamonds) insulitis. Error bars are S.E.M. *P<0.05. ***P<0.001
Endocrine cell transdifferentiation in human T1D
To study transdifferentiation in human T1D (Supplementary Table 1), we first asked whether there was a _δ_-cell excess. As expected, islets were composed primarily of _α_-cells early in the course of disease (compare normal human pancreas in Figure 6a and Supplementary Figure 10 with early stage T1D pancreases in Figure 6b and Supplementary Figure 11). As the number of years of diabetes increased, so did the frequency of _δ_-cells (compare Figure 6b and Supplementary Figure 11 with Figure 6c and Supplementary Figure 12). The _δ_- to _α_-cell ratio demonstrated a statistically significant increase as a direct function of the number of years of diabetes, which did not occur in non-diabetic or type II diabetic patients (Figures 6e and f). In fact, the _δ_-/_α_-cell ratio decreased in type II diabetes with duration of diabetes (Figure 6d and Supplementary Figure 13, quantified in Figure 6f), most likely due to the _α_-cell hyperplasia that occurs.28
Figure 6
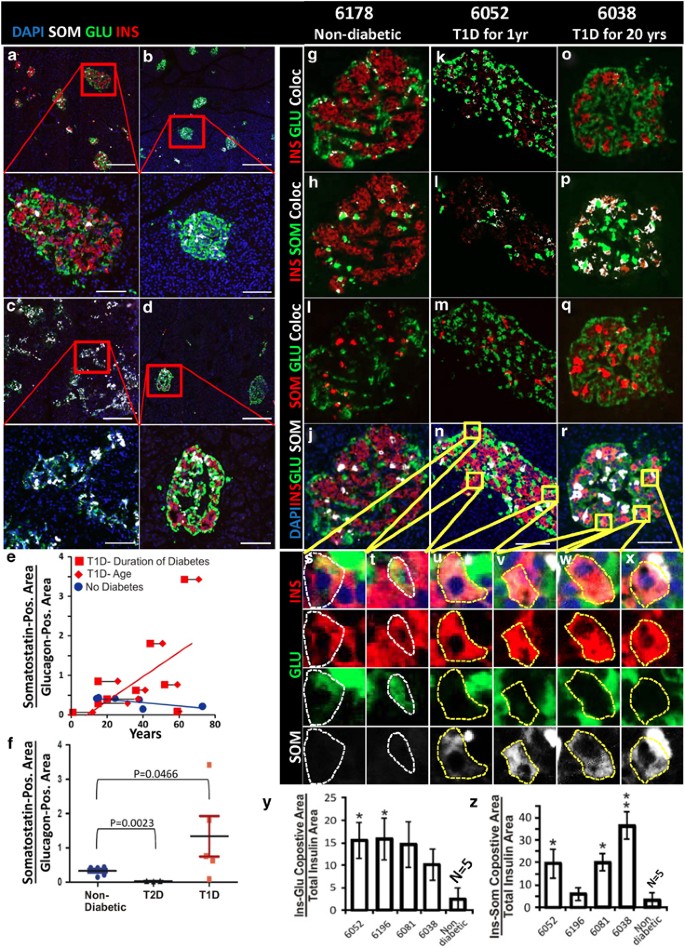
Pancreatic _δ_-cells increase over time in patients with T1D. (a) pancreas from non-diabetic donor (nPOD 6140), demonstrating normal islet morphology and hormone expression. (b) pancreas from nPOD Donor #6052 (T1D for 1 year), demonstrating the _α_-cell predominance found in most of the pancreas of this patient. (c) Pancreas from nPOD Donor #6159 (T1D for 44 years), demonstrating _δ_-cell predominance. (d) Pancreas from a patient with type II diabetes (T2D) for 20 years, demonstrating mild loss of _β_-cells and no increase in _δ_-cells. For a–d, scale bar=280 _μ_m for low-power images and=75 _μ_m for high-power images. (e) Quantification of the somatostatin-positive area normalized to the glucagon-positive area, demonstrating an increase over time with T1D. Red diamonds mark the age of type I diabetics and red squares mark the duration of T1D, connected by a black line for each patient. Blue circles mark the age of non-diabetic patients. Pearson’s coefficient for T1D was 0.61 and for non-diabetic patients was −0.74. (f) Quantification of the somatostatin-positive area normalized to the glucagon-positive area in patients with T1D greater than 20 years, compared with non-diabetic and type II diabetic patients, demonstrating a statistically significant increase in the number of _δ_-cells in the type I diabetic patients with years of disease. (g–r) Islet hormone coexpression in a non-diabetic patient (NPOD Donor #6178) (g–j), nPOD Donors #6052 and #6038, with T1D for 1 year (k–n) and 20 years (o–r), respectively. Coexpression was analyzed by the ImageJ colocalization analysis highlighter algorithm that analyzes two channels (red and green) and marks colocalized areas in white. Insulin and glucagon (red and green in g, k and o), insulin and somatostatin (red and green in h, l and p), and somatostatin and glucagon (red and green in i, m and q). Note that all of the colors from the Image J analysis are pseudocolors. True colors from the same islets are shown in j, n and r. Examples of insulin and glucagon coexpression are shown in high power in s and t (double positive areas are indicated by a dashed white line), and of insulin and somatostatin coexpression in u–x (double positive areas are indicated by a dashed yellow line). Quantification of insulin and glucagon coexpression is presented in y and for insulin and somatostatin in z in nPOD Donors #6052, #6196, #6081 and #6038 (Supplementary Table 1). These patients were selected because their pancreas had islets with a significant number of _β_-cells and only islets with greater than 20 _β_-cells were subjected to quantitative analysis. No colocalization between glucagon and somatostatin was found and so it could not be quantified. Coexpression was indistinguishable from background in the normal patient, but there was extensive insulin–glucagon coexpression in nPOD patients 6052, 6196 and 6081. Donors 6081 and 6038 had a high level of insulin and somatostatin coexpression. Quantification was performed on confocal images (Supplementary Figure 14). Error bars are S.E.M. of individual islets. Islets from five non-diabetic patients were pooled. Scale bar for i–t=75 _μ_m
For direct evidence of transdifferentiation, we examined for intermediates in the process, finding cells with glucagon–insulin or insulin–somatostatin coexpression in some patients (Figures 6k–x, quantified in y and z, Supplementary Figures 11 and 14), but not in all (Figure 6c, Supplementary Figure 12). Cells coexpressing islet hormones were not found in non-diabetic controls (Figures 6g–j, quantified in y and z, Supplementary Figures 10 and 14) or patients with type II diabetes (Figure 6d, Supplementary Figure 13). No glucagon–somatostatin coexpressing cells were found in any patient. As in the mouse, we found islet cells coexpressing insulin, somatostatin and NKX6.1 in T1D but not normal pancreases (Supplementary Figure 15, compare the non-diabetic patient in A–D where NKX6.1 was restricted to _β_-cells, with the T1D patient in E–G where there were cells that coexpressed insulin, somatostatin and NKX6.1).
Although the fact that some patients with T1D exhibited glucagon–insulin coexpression indicated that _α_-cells were transdifferentiating into _β_-cells, the possibility of direct conversion of _β_-cells into _δ_-cells remained. A 37-year-old female with T1D for 20 years (nPOD donor #6038) who had a substantial number of residual _β_-cells was informative had a significant number of _β_-cells in most islets (Figures 6o–r, Supplementary Figures 11D, 14D and E), and 33% coexpressed somatostatin (Figure 6z). Islets were found where essentially all of the insulin-positive cells coexpressed somatostatin, with no glucagon–insulin coexpressing cells (Figures 6o–r and v–x, Supplementary Figure 14D and E and J–M). This is most consistent with direct transdifferentiation from _β_- to _δ_-cells, but examination of additional patients will be required to determine how general this phenomenon is.
Discussion
Here, we demonstrate the existence of a novel pathway of islet cell neogenesis where _α_-cells transdifferentiate first to _β_-cells, with a subset going on to transdifferentiate into _δ_-cells. Transdifferentiation was induced by a single peptide, caerulein, which was sufficient in the context of severe _β_-cell deficiency to promote _α_- to _β_- to _δ_-cell transdifferentiation. A study of _β_-cell regeneration following profound _β_-cell ablation also found evidence of _α_- to _β_-cell transdifferentiation, but the efficiency of conversion was low.24 Ectopic expression of the transcription factor Pax4 under the control of the glucagon promoter led to conversion of duct cells into _β_-cells, further validating the ability of cells expressing glucagon to convert into _β_-cells.26, 29 However, an important difference is that we have not observed evidence of induction of transdifferentiating cells in the ducts, either here or in our previous study using PDL plus alloxan.9
Although the genetic lineage tracing proved conclusively the existence of transdifferentiation from _α_- to _β_- and _α_- to _δ_-cells, the time course analysis verified that the transdifferentiation sequence was from _α_- to _β_- to _δ_-cells. The temporal appearance of _δ_-cells and glucagon–insulin and insulin–somatostatin coexpressing intermediates, as well as the absence of glucagon–somatostatin coexpressing cells, is consistent with the transdifferentiation occurring from _α_- to _β_- to _δ_-cells, without direct _α_- to _δ_-cell transdifferentiation (Figure 7).
Figure 7
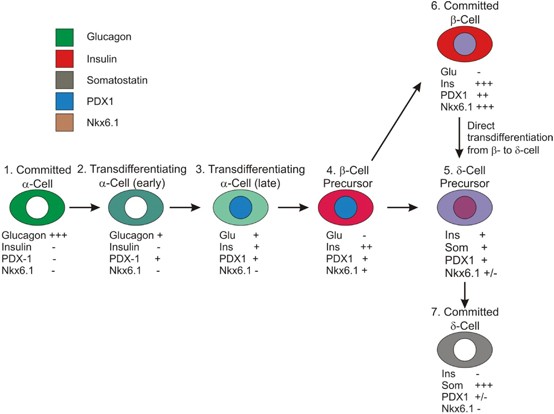
Model of pancreatic islet cell transdifferentiation. Intermediates in the transdifferentiation process are documented as follows: intermediate 2 is shown in Supplementary Figures 4C and D (surrounded by a white line), intermediate 3 in Supplementary Figure 4C (surrounded by a yellow line) and intermediate 5 in Supplementary Figure 5 and Figures 3c and d
Our data strongly indicate that hormone colocalization reflects transdifferentiation, as we never observed colocalization in normal mice. It was extremely rare even in the condition of pure _β_-cell ablation, studied previously by others.24 We never observed glucagon–somatostatin coexpressing cells, which might have occurred if the hormone colocalization was an artifact of immunostaining. Similar to us, other groups have found hormone colocalization only in settings where transdifferentiation occurred as demonstrated by genetic lineage tracing.26, 27 Consistent with our previous study of transdifferentiation following PDL plus alloxan,9 we never observed hormone colocalization in ducts, nor did we ever observe mG-positive cells in ducts.
_β_-cell dedifferentiation has been reported as occurring in response to deletion of FoxO1 and in type II diabetes.30, 31 The finding of a high level of glucagon–insulin colocalization in the setting of profound _β_-cell ablation argues against _β_-cell dedifferentiation occurring following alloxan plus caerulein. First, there were simply not sufficient residual _β_-cells following alloxan to account for the large number of cells coexpressing glucagon and insulin. Also, dedifferentiation resulted in the loss of _β_-cell identity, that is, _β_-cell markers such as insulin, PDX1 and NKX6.1, before redifferentiation along a different lineage.30 The glucagon–insulin and insulin–somatostatin coexpression, as well as somatostatin and NKX6.1, is not consistent with that phenomenon30 and argues for transdifferentiation as opposed to dedifferentiation and redifferentiation as the mechanism responsible for _α_- to _β_- to _δ_-cell conversion.
The _δ_-cell excess in murine32 and human T1D, with precisely the same intermediates as found in the alloxan plus caerulein model, demonstrates the relevance of endocrine cell transdifferentiation to autoimmune diabetes. However, endocrine cell transdifferentiation following alloxan plus caerulein occurred only in islets where there were few _β_-cells, whereas in T1D, transdifferentiation occurred in islets with a substantial number of residual _β_-cells, most likely reflecting a difference in the stimulus for transdifferentiation in autoimmunity versus that induced by caerulein. The simplest model that is consistent with the data presented here, postulating the existence of two factors, one positive and one repressive, is shown in Supplementary Figure 16.
In some human patients with T1D, islets were found with numerous _β_-cells, all of which coexpressed somatostatin, and with no evidence of _α_- to _β_-cell transdifferentiation, suggesting that direct _β_- to _δ_-cell transdifferentiation was taking place without an _α_-cell origin. Such islets were fairly normal in morphology, with a large number of _β_-cells located more centrally, all of which coexpressed somatostatin but with no glucagon–insulin colocalization. Analysis of additional patient samples, which are rare, will be of value in determining the degree to which this occurs in the general population of type I diabetics. Of importance, islet cell transdifferentiation was found to occur regardless of age or duration of diabetes, suggesting that stimulating this process might be a viable approach to therapy in individuals with longstanding T1D. This is in contrast to _β_-cell replication, the other major approach to _β_-cell regeneration, which declines markedly with age,33, 34, 35 but is consistent with our previous finding in the PDL plus alloxan model, where _α_- to _β_-cell transdifferentiation occurred in old mice.9
The dramatic _δ_-cell excess in murine and human T1D, combined with the observation that _β_-cells appear to be able to transdifferentiate directly into _δ_-cells, indicates that the conventional paradigm of T1D where _β_-cells are destroyed by autoimmunity is incomplete. Rather, in addition to autoimmune destruction of _β_-cells, the view of islet cell kinetics in T1D should be modified to take into account the endocrine cell transdifferentiation from _α_- to _β_-cells and _β_- to _δ_-cells. If the process of _β_- to _δ_-cell transdifferentiation is reversible, that may provide another route to _β_-cell regeneration in T1D. Regardless, the finding of efficient _α_- to _β_-cell transdifferentiation in T1D, as well as the finding that a single peptide is sufficient to drive transdifferentiation, raises the prospect that _β_-cell regeneration by the mobilization of _α_- and possibly _δ_-cells functioning as facultative _β_-cell stem cells may be feasible.
Materials and Methods
Mice
Glu-mT/mG mice for _α_-cell lineage tracing were a generous gift from Dr. Mark Huising (The Salk Institute for Biological Studies, La Jolla, California (USA)). Gt(ROSA)26Sor tm4(ACTB-tdTomato,-EGFP)Luo/J (The Jackson laboratory (Bar Harbor, Maine)–stock # 007576)36 were crossed with Glucagon–Cre mice, expressing cre recombinase under the control of the glucagon promoter.37 This transgene has been well characterized in multiple studies, exhibiting very low to undetectable background recombination.37, 38 F1 mice were genotyped and mice positive for both markers were selected for the study. The F1 mice (Glu-mT/mG) have the mT cassette deleted in _cre_-expressing cells, while a membrane-targeted eGFP (mG) cassette is activated. Thus, _α_-cells and cells derived from _α_-cells that underwent cre-mediated recombination have a green fluorescent membrane, whereas preexisting cells not arising from recombined _α_-cells have a red fluorescent membrane. To calculate the recombination efficiency in _α_-cells, 444 cells from 12 mice were counted.
C57BL/6 mice were purchased from Harlan Sprague Dawley, Inc. (Placentia, CA, USA). NOD mice were bred at the Sanford-Burnham Medical Research Institute, La Jolla, California. All animal experiments were approved by the Institutional Animal Care and Use Committee of the Sanford-Burnham Medical Research Institute in accordance with national regulations.
Alloxan plus caerulein
Mice were injected intravenously with 110 mg/kg alloxan (Sigma-Aldrich, St. Louis, MO, USA) in PBS (phosphate-buffered saline) at day 1. Mice with a blood glucose level greater than 500 mg/dl (OneTouch Ultra Mini, Johnson & Johnson, Milpitas, CA, USA) were randomized into two groups. One group was injected with caerulein (Sigma-Aldrich; six IP injections on days 1, 3 and 5). Lineage tracing studies were done with a caerulein dose of 7 mg/kg and the time course study with C57BL/6 mice used a dose of 10 mg/kg in PBS. Mice (alloxan alone and alloxan plus caerulein) were killed on days:
Day 13- Three C57BL/6 alloxan plus caerulein mice, three C57BL/6 alloxan alone mice.
Day 20- Three lineage tracing alloxan plus caerulein mice, three lineage tracing alloxan alone mice, seven C57BL/6 alloxan plus caerulein mice, seven C57BL/6 alloxan alone mice. Of the seven C57BL/6 alloxan plus caerulein mice and seven alloxan alone mice, one group from each (_n_=3) had BrdU (1 mg/ml, Sigma-Aldrich) added to the drinking water, whereas the second (_n_=4) had no BrdU added.
Day 27- Three C57BL/6 alloxan plus caerulein mice, three C57BL/6 alloxan alone mice.
Day 38- Three lineage tracing alloxan plus caerulein mice, three lineage tracing alloxan alone mice, four C57BL/6 alloxan plus caerulein and four C57BL/6 alloxan alone.
NOD mouse experiments
Twenty 8.5 month-old non-diabetic NOD mice (blood glucose levels 80–200 mg/dl) and five diabetic NOD mice (age 6–15 months-old) were killed. Of the 20 non-diabetic NOD mice, six had an islet morphology typical of early stages of diabetes–that is, some islets with insulitis, disorganized islet morphology and transdifferentiating cells. Fourteen non-diabetic mice had no evidence of islet autoimmunity and were not analyzed further.
Human pancreatic tissue
Human pancreatic tissue was obtained from the Network for Pancreatic Organ Donors with Diabetes (nPOD), a collaborative T1D research project sponsored by JDRF. Organ Procurement Organizations (OPO) partnering with nPOD to provide research resources are listed at http://www.jdrfnpod.org/our-partners.php. Use of that tissue was approved by the SBMRI IRB (IRB-2013-019-13). All images from nPOD samples are available from the nPOD at http://www.jdrfnpod.org/online-pathology.php. A summary of the human patients is in Supplementary Table 1.
Immunohistochemical staining
Tissue was fixed in 4% formaldehyde over night at 4 °C (USB; OH, USA), washed in PBS, followed by overnight in 30% sucrose at 4 °C, then embedded in OCT (Optimal Cutting Temperature) (Sakura Finetek; CA, USA) and frozen at 80 °C. Slides of 5-_μ_m thickness were washed four times with PBS and treated with 0.3% Triton in PBS for 10 min. Antigen retrieval (when applicable) was done using with CitriSolvTM (Fisher Scientific, PA, USA) for 7 or 10 min in sub-boiling temperature. After washing with PBS for 10 min, slides were incubated in blocking solution with 5% normal donkey serum (Jackson Immuno Research, PA, USA) for 60 min at room temperature. Human slides were fixed in 4% formaldehyde for 20 min at 4 °C, whereas all cryosections of 5-_μ_m thickness were incubated with antisera specific for insulin (1/200, guinea pig, USBIO, Swampscott, MA, USA), insulin (1/200, rabbit, Santa Cruz Biotechnology, Santa Cruz, CA, USA), glucagon (1/2000, mouse, Sigma-Aldrich), somatostatin (1/200, goat, Santa Cruz Biotechnology), PDX1 (1/2000, goat, Abcam, Cambridge, MA, USA), NKX6.1 (1/1000, mouse, Beta Cell Biology Consortium, Nashville, TN, USA), 5-bromodeoxyuridine (BrdU; mouse, GE healthcare, Piscataway, NJ, USA). Secondary antibodies for detection of guinea pig, rabbit, goat or mouse antibodies were labeled with: Alexa Fluor 488 (Invitrogen, Carlsbad, CA, USA), Alexa Fluor 649 (Jackson ImmunoResearch Laboratories, West Grove, PA, USA), Rhodamine Red (Jackson ImmunoResearch Laboratories), Cy5 (Jackson ImmunoResearch Laboratories) and Dylight 405 (Jackson ImmunoResearch Laboratories). Nuclei were visualized with DAPI (4',6-diamidino-2- phenylindole; Sigma-Aldrich).
Imaging and image analysis
All slides were scanned at a magnification of × 20 using the Aperio Scanscope FL system (Aperio Technologies Inc., Vista, CA, USA). The appropriate dyes were assigned and illumination levels were calibrated using a preset procedure, the parameters were saved and applied to all slides. The acquired digital images represent whole tissue sections. Each section was 6-_μ_m thick and calculations per islet reflect a section through that islet. Sections were evaluated for image quality. All acquired images were subsequently placed in dedicated project folders, and stored on a designated local server. Slides were viewed and analyzed using the web-based Image Scope viewer. Slides were quantified using the ‘Area Quantification FL’ algorithm (version 11 Aperio Technologies Inc.). The algorithm was optimized using a preset procedure and the subsequent macro was saved and applied to all slides.
Confocal images of the lineage experiment were acquired using Zeiss LSM710 or 780 confocal microscopes (Zeiss, Jena, Germany) at the Waitt Advanced Biophotonics Center Core Facility of the Salk Institute for Biological Sciences. Other confocal images were acquired using Olympus Fluoview FV1000 (Olympus Optical, Tokyo, Japan) at the SBMRI Imaging Core Facility.
Images of islet cells from the lineage tracing experiment were scored as expressing eGFP or mT on their plasma membranes. Only cells that had continuous, unbroken staining for the membrane markers were included in the analysis of hormone expression. Quantification and determination of double- and triple-positive cells was done using the Aperio Scanscope FL system as described above. Four slides that were 100 _μ_M apart were analyzed from each C57BL/6 or NOD mouse. Confocal images were analyzed with ImageJ (NIH, Bethesda, MD, USA) for visualized colocalization (colocalization highlighter algorithm) and quantified (Mander’s coefficient algorithm). Human samples were scanned (Aperio Scanscope FL system) and analyzed as described above. A complete set of the confocal images used for this analysis is in Supplementary Movie 1.
Statistics
Because an a priori hypothesis was being tested, _P_-values were calculated as one-tailed homoscedastic Student’s _t_-tests except in Figure 4g, where a two-sample proportion test was used.
Abbreviations
T1D:
type I diabetes
PDL:
pancreatic duct ligation
eGFP:
enhanced green fluorescent protein
mG:
membrane-localized enhanced green fluorescent protein
mT:
membrane-localized Tomato
Glu:
glucagon
PDX1:
pancreas–duodenum homeobox 1
Nkx6.1:
NK homeobox 6.1
nPOD:
Network for Pancreatic Organ Donors with Diabetes
References
- Eguizabal C, Montserrat N, Veiga A, Izpisua Belmonte JC . Dedifferentiation, transdifferentiation, and reprogramming: future directions in regenerative medicine. Semin Reprod Med 2013; 31: 82–94.
Article Google Scholar - Atkinson MA, Eisenbarth GS, Michels AW . Type 1 diabetes. Lancet 2013; S0140-6736: 60594–60597.
Google Scholar - Levine F, Itkin-Ansari P . beta-cell Regeneration: neogenesis, replication or both? J Mol Med (Berl) 2008; 86: 247–258.
Article CAS Google Scholar - Inada A, Nienaber C, Katsuta H, Fujitani Y, Levine J, Morita R et al. Carbonic anhydrase II-positive pancreatic cells are progenitors for both endocrine and exocrine pancreas after birth. Proc Natl Acad Sci USA 2008; 105: 19915–19919.
Article CAS Google Scholar - Bonner-Weir S, Inada A, Yatoh S, Li WC, Aye T, Toschi E et al. Transdifferentiation of pancreatic ductal cells to endocrine beta-cells. Biochem Soc Trans. 2008; 36 (Pt 3): 353–356.
Article CAS Google Scholar - Hao E, Tyrberg B, Itkin-Ansari P, Lakey JR, Geron I, Monosov EZ et al. Beta-cell differentiation from nonendocrine epithelial cells of the adult human pancreas. Nat Med 2006; 12: 310–316.
Article CAS Google Scholar - Xu X, D’Hoker J, Stange G, Bonne S, De Leu N, Xiao X et al. Beta cells can be generated from endogenous progenitors in injured adult mouse pancreas. Cell 2008; 132: 197–207.
Article CAS Google Scholar - Lee SH, Hao E, Levine F . beta-Cell replication and islet neogenesis following partial pancreatectomy. Islets 2011; 3: 188–195.
Article Google Scholar - Chung CH, Hao E, Piran R, Keinan E, Levine F . Pancreatic beta-cell neogenesis by direct conversion from mature alpha-cells. Stem Cells. 2010; 28: 1630–1638.
Article CAS Google Scholar - Rankin MM, Wilbur CJ, Rak K, Shields EJ, Granger A, Kushner JA et al. Beta cells are not generated in pancreatic duct ligation induced injury in adult mice. Diabetes 2013; 62: 1634–1645.
Article CAS Google Scholar - Xiao X, Chen Z, Shiota C, Prasadan K, Guo P, El-Gohary Y et al. No evidence for beta cell neogenesis in murine adult pancreas. J Clin Invest 2013; 123: 2207–2217.
Article CAS Google Scholar - Baeyens L, Lemper M, Leuckx G, De Groef S, Bonfanti P, Stange G et al. Transient cytokine treatment induces acinar cell reprogramming and regenerates functional beta cell mass in diabetic mice. Nat Biotechnol 2013; 32: 76–83.
Article Google Scholar - Nagasao J, Yoshioka K, Amasaki H, Mutoh K . Centroacinar and intercalated duct cells as potential precursors of pancreatic endocrine cells in rats treated with streptozotocin. Ann Anat 2003; 185: 211–216.
Article Google Scholar - Chung CH, Hao EG, Piran R, Keinan E, Levine F . Pancreatic beta-cell neogenesis by direct conversion from mature alpha-cells. Stem Cells 2010; 28: 1630–1638.
Article CAS Google Scholar - Chung CH, Levine F . Adult pancreatic alpha-cells: a new source of cells for beta-cell regeneration. Rev Diabet Stud 2010; 7: 124–131.
Article Google Scholar - Hao E, Lee SH, Levine F . Efficient beta-Cell regeneration by a combination of neogenesis and replication following beta-cell ablation and reversal of pancreatic duct ligation. Stem Cells 2013; 31: 2388–2395.
Article CAS Google Scholar - Lerch MM, Gorelick FS . Models of acute and chronic pancreatitis. Gastroenterology 2013; 144: 1180–1193.
Article Google Scholar - Zaninovic V, Gukovskaya AS, Gukovsky I, Mouria M, Pandol SJ . Cerulein upregulates ICAM-1 in pancreatic acinar cells, which mediates neutrophil adhesion to these cells. Am J Physiol Gastrointest Liver Physiol 2000; 279: G666–G676.
Article CAS Google Scholar - Jensen JN, Cameron E, Garay MV, Starkey TW, Gianani R, Jensen J . Recapitulation of elements of embryonic development in adult mouse pancreatic regeneration. Gastroenterology 2005; 128: 728–741.
Article CAS Google Scholar - Jensen J, Serup P, Karlsen C, Nielsen TF, Madsen OD . mRNA profiling of rat islet tumors reveals nkx 6.1 as a beta-cell- specific homeodomain transcription factor. J Biol Chem 1996; 271: 18749–18758.
Article CAS Google Scholar - Sander M, Sussel L, Conners J, Scheel D, Kalamaras J, Dela Cruz F et al. Homeobox gene Nkx6.1 lies downstream of Nkx2.2 in the major pathway of beta-cell formation in the pancreas. Development 2000; 127: 5533–5540.
CAS PubMed Google Scholar - Peshavaria M, Gamer L, Henderson E, Teitelman G, Wright CV, Stein R . XIHbox 8, an endoderm-specific Xenopus homeodomain protein, is closely related to a mammalian insulin gene transcription factor. Mol Endocrinol 1994; 8: 806–816.
CAS PubMed Google Scholar - Neumuller RA, Knoblich JA . Dividing cellular asymmetry: asymmetric cell division and its implications for stem cells and cancer. Genes Dev 2009; 23: 2675–2699.
Article Google Scholar - Thorel F, Nepote V, Avril I, Kohno K, Desgraz R, Chera S et al. Conversion of adult pancreatic alpha-cells to beta-cells after extreme beta-cell loss. Nature 2010; 464: 1149–1154.
Article CAS Google Scholar - Nir T, Melton DA, Dor Y . Recovery from diabetes in mice by beta cell regeneration. J Clin Invest 2007; 117: 2553–2561.
Article CAS Google Scholar - Al-Hasani K, Pfeifer A, Courtney M, Ben-Othman N, Gjernes E, Vieira A et al. Adult duct-lining cells can reprogram into beta-like cells able to counter repeated cycles of toxin-induced diabetes. Dev Cell 2013; 26: 86–100.
Article CAS Google Scholar - Wilcox CL, Terry NA, Walp ER, Lee RA, May CL . Pancreatic alpha-cell specific deletion of mouse Arx leads to alpha-cell identity loss. PLoS One 2013; 8: e66214.
Article CAS Google Scholar - Lee SH, Demeterco C, Geron I, Abrahamsson A, Levine F, Itkin-Ansari P . Islet specific Wnt activation in human type II diabetes. Exp Diabetes Res 2008; 2008: 728763.
Article Google Scholar - Collombat P, Xu X, Ravassard P, Sosa-Pineda B, Dussaud S, Billestrup N et al. The ectopic expression of Pax4 in the mouse pancreas converts progenitor cells into alpha and subsequently beta cells. Cell 2009; 138: 449–462.
Article CAS Google Scholar - Talchai C, Xuan S, Lin HV, Sussel L, Accili D . Pancreatic beta cell dedifferentiation as a mechanism of diabetic beta cell failure. Cell 2012; 150: 1223–1234.
Article CAS Google Scholar - Fiori JL, Shin YK, Kim W, Krzysik-Walker SM, Gonzalez-Mariscal I, Carlson OD et al. Resveratrol prevents beta-cell dedifferentiation in nonhuman primates given a high-fat/high-sugar diet. Diabetes 2013; 62: 3500–3513.
Article Google Scholar - Reddy S, Chai RC, Rodrigues JA, Hsu TH, Robinson E . Presence of residual beta cells and co-existing islet autoimmunity in the NOD mouse during longstanding diabetes: a combined histochemical and immunohistochemical study. J Mol Histol 2008; 39: 25–36.
Article CAS Google Scholar - Teta M, Long SY, Wartschow LM, Rankin MM, Kushner JA . Very slow turnover of beta-cells in aged adult mice. Diabetes 2005; 54: 2557–2567.
Article CAS Google Scholar - Perl S, Kushner JA, Buchholz BA, Meeker AK, Stein GM, Hsieh M et al. Significant human beta-cell turnover is limited to the first three decades of life as determined by in vivo thymidine analog incorporation and radiocarbon dating. J Clin Endocrinol Metab 2010; 95: E234–E239.
Article CAS Google Scholar - Lee SH, Itkin-Ansari P, Levine F . CENP-A, a protein required for chromosome segregation in mitosis, declines with age in islet but not exocrine cells. Aging (Albany NY) 2010; 2: 785–790.
Article CAS Google Scholar - Muzumdar MD, Tasic B, Miyamichi K, Li L, Luo L . A global double-fluorescent Cre reporter mouse. Genesis 2007; 45: 593–605.
Article CAS Google Scholar - Herrera PL . Adult insulin- and glucagon-producing cells differentiate from two independent cell lineages. Development 2000; 127: 2317–2322.
CAS PubMed Google Scholar - Quoix N, Cheng-Xue R, Guiot Y, Herrera PL, Henquin JC, Gilon P . The GluCre-ROSA26EYFP mouse: a new model for easy identification of living pancreatic alpha-cells. FEBS Lett 2007; 581: 4235–4240.
Article CAS Google Scholar - Guo S, Dai C, Guo M, Taylor B, Harmon JS, Sander M et al. Inactivatixon of specific beta cell transcription factors in type 2 diabetes. J Clin Invest 2013; 123: 3305–3316.
Article CAS Google Scholar
Acknowledgements
This work was supported by the Sanford Children’s Health Research Center, BetaBat (in the Framework Program 7 of the European Community) and CIRM grant TG2-01162. We are grateful for assistance from SBMRI Core personnel Guillermina Garcia and Robbin Newlin (Histopathology), Leslie Boyd and Ed Monosov (Cell Imaging), Xiayu (Stacy) Huang (statistics; bioinformatics). We acknowledge Dr. Mark Huising of the Salk Institute for providing the gcg-cre × mTmG mice used for the lineage tracing study and for acquiring confocal images of these mice. We thank Ze’ev Ronai for a helpful discussion and nPOD for providing slides of human pancreatic tissue.
Author information
Authors and Affiliations
- Sanford Children’s Health Research Center, Sanford-Burnham Medical Research Institute, La Jolla, 92037, CA, USA
R Piran, S-H Lee & F Levine - Infectious and Inflammatory Disease Center, Sanford-Burnham Medical Research Institute, La Jolla, 92037, CA, USA
C-R Li & L M Bradley - Animal Facility, Sanford-Burnham Medical Research Institute, La Jolla, 92037, CA, USA
A Charbono
Authors
- R Piran
- S-H Lee
- C-R Li
- A Charbono
- L M Bradley
- F Levine
Corresponding author
Correspondence toF Levine.
Ethics declarations
Competing interests
The authors declare no conflict of interest.
Additional information
Edited by H-U Simon
Supplementary Information accompanies this paper on Cell Death and Disease website
Supplementary information
Rights and permissions
Cell Death and Disease is an open-access journal published by Nature Publishing Group. This work is licensed under a Creative Commons Attribution-NonCommercial-ShareAlike 3.0 Unported License. The images or other third party material in this article are included in the article’s Creative Commons license, unless indicated otherwise in the credit line; if the material is not included under the Creative Commons license, users will need to obtain permission from the license holder to reproduce the material. To view a copy of this license, visit http://creativecommons.org/licenses/by-nc-sa/3.0/
About this article
Cite this article
Piran, R., Lee, SH., Li, CR. et al. Pharmacological induction of pancreatic islet cell transdifferentiation: relevance to type I diabetes.Cell Death Dis 5, e1357 (2014). https://doi.org/10.1038/cddis.2014.311
- Received: 30 March 2014
- Revised: 19 May 2014
- Accepted: 16 June 2014
- Published: 31 July 2014
- Issue date: July 2014
- DOI: https://doi.org/10.1038/cddis.2014.311