Approaching 1.5 °C: how will we know we’ve reached this crucial warming mark? (original) (raw)
The world is already more than 1 °C warmer on average than it was before industrial times, owing to greenhouse gases released from human activities. And that value is rising. The Intergovernmental Panel on Climate Change (IPCC) projects that there is at least a 50% chance that long-term global warming will overshoot 1.5 °C in the next decade, even with ambitious emissions cuts.
That matters because this target is written into the 2015 Paris climate agreement. Breaching it will trigger questions on what needs to be done to meet the agreement’s goal — to curb human-induced climate change. For example, its aim of “pursuing efforts to limit the temperature increase to 1.5 °C” would then mean taking action to reverse global warming, not just stopping it — a much greater demand. A breach will also inevitably prompt assessments of the observed impacts of exceeding 1.5 °C.
It might come as a surprise, then, to hear that the Paris statement contains no formally agreed way of defining the present level of global warming. The pact does not even define ‘temperature increase’ explicitly and unambiguously. Without an agreed metric, there can be no consensus on when the 1.5 °C level has been reached. This is likely to result in distraction and delay just at the point when climate action is most urgent.
 Is it too late to keep global warming below 1.5 °C? The challenge in 7 charts
A key issue is that global temperatures do not increase smoothly. The brief ups and downs that occur over weeks to years owing to natural climate variability (caused, for instance, by El Niño events and the effects of gases given off by volcanic activity) are superimposed on the long-term warming trend from human influences. For example, the global mean temperature rise exceeded 1.5 °C briefly for a month or more in 2016, 2017, 2019, 2020 and 2023.
As far as the Paris agreement is concerned, it’s recognized that such brief warm spells don’t count as breaching 1.5 °C. And even an anomalously warm year would not do so. The World Meteorological Organization (WMO) predicts there is a 66% chance that the global mean temperature excess will go above 1.5 °C for at least one year in the next 5 years1. However, even this is likely to be a temporary anomaly.
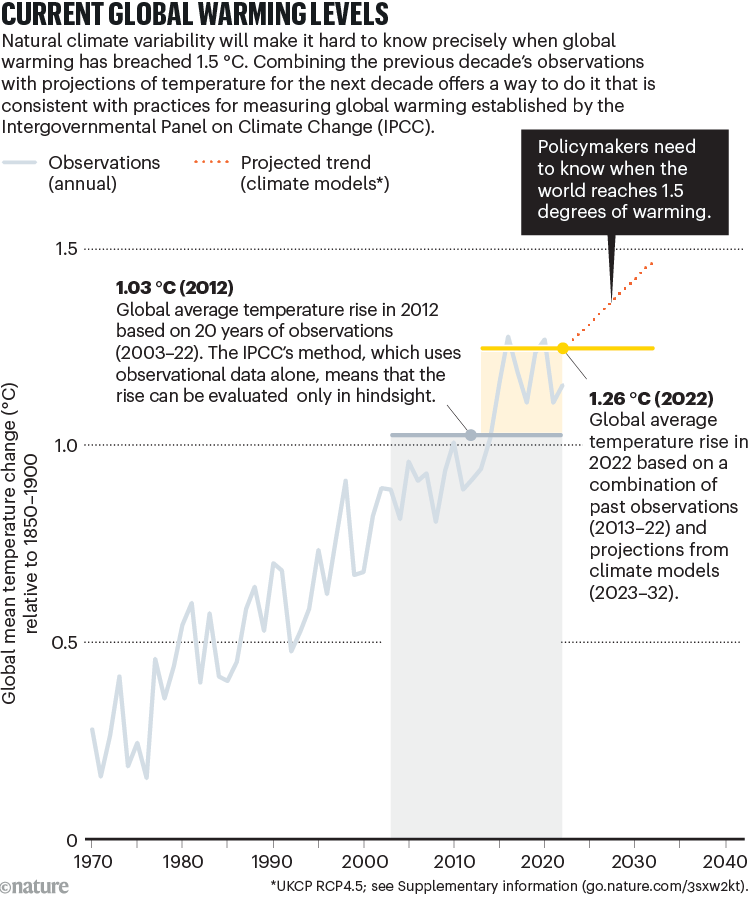
What would count as passing 1.5 °C? A method is needed for filtering out such natural climate cycles. To smooth temperature wiggles in model projections of future climate, the latest IPCC assessment report, AR6, defined the 1.5 °C mark and other global warming levels (GWLs) in terms of projected 20-year averages relative to the average for 1850–1900. The year of exceedance of a GWL is the midpoint of the 20-year period at that level. By this definition, 1.5 °C of warming would be confirmed once the observed temperature rise has reached that level, on average, over a 20-year period — in other words, a decade after crossing the 1.5 °C level. That risks a delay in recognizing and reacting to the crossing point (see ‘Current global warming levels’).

Source: analysis by R. A. Betts et al.
Researchers and the policy community need to agree urgently on a metric for determining the current level of global warming for policy purposes. Once defined, the metric should be formally adopted for use in the context of the Paris agreement. It should be consistent with established IPCC practices, and should allow the crossing of 1.5 °C to be recognized without delay. Here, we propose a starting point for such a metric.
Multiple metrics
In observational records of climate, the average global temperature over the past two decades (2003–22) has been 1.03 °C above that for 1850–1900 (although uncertainties in the data mean that the true value could be as low as 0.87 °C or as high as 1.13 °C; see Supplementary information)2. And measurements from 2002 to 2021 indicate that warming first passed 1 °C in 2011. But we don’t know what the 20-year average is now, centred around 2023.
Assuming the world stays on its current warming trajectory, IPCC projections suggest that 1.5 °C will be breached around 2030, give or take a decade3. But, on the basis of 20-year averages, the passing of 1.5 °C would not be formally recognized until around 2040.
Shortening the period over which the average is calculated doesn’t help much. Ten-year averages4 are reasonably representative of longer-term averages5 and reduce the delay to five years. But that is still a long time when action is needed urgently. Shortening the average period further isn’t useful, because natural variability then dominates.
 Climate loss-and-damage funding: how to get money to where it’s needed fast
A more instantaneous indicator of the current level of long-term warming is needed. Several such methods are already in use. These include: finding the end point of a linear trend over the past 30 years (see go.nature.com/3ssvpwx); using more sophisticated methods for statistical smoothing over short time frames (see go.nature.com/3mqsr7g); and calculating the human contribution to warming from data on changes in the concentrations of greenhouse gases and aerosols6.
Each method can offer a slightly different estimate of current warming, depending on which data, algorithms and assumptions are used. Nonetheless, there is broad agreement on some things, such as that warming in 2022 was about 1.24 °C (with an uncertainty range between 1.0 °C and 1.6 °C), and that 1.0 °C warming was exceeded around 2011 or 2012.
There have been times when the differences between methods were greater, either because the rate of warming changed rapidly so a linear trend did not represent the long-term change, or because large natural variability led to a difference between the observed warming and the human contribution. For example, there is less agreement on the year in which 0.5 °C of warming was exceeded, put at some time between 1982 and 1988. This demonstrates the potential for confusion on recognizing the crossing of 1.5 °C if a single indicator is not agreed.
However, there are two key problems with using any of these indicators in the context of the Paris agreement. Both stem from the need for consistency with existing IPCC practice.
Informing policy
First, to inform policy, the indicator for monitoring the approach to 1.5 °C must be future-proof — later changes in the definition could undermine the credibility of using GWLs for scientific advice. Any definition must be consistent with how 1.5 °C is already defined by the IPCC; that is, using 20-year averages attached to a midpoint.

Corals were moved to land for safety when a July heatwave warmed waters near Florida.Credit: Carolyn Cole/Los Angeles Times via Getty
Second, the metric should be consistent with how the 1.5 °C level will be defined after it has retreated into the past — as a baseline for future impact assessments. The IPCC already uses long-term averages over recent decades for such baselines; it does not use the end point of 30-year trends or statistical smoothing. And, importantly, baseline periods for impact studies are defined in terms of observed temperature change, not calculations of human-induced warming, because the impacts depend on the actual temperature experienced.
The instantaneous metrics are inconsistent with these requirements. And the IPCC method alone will not suffice — 20 years of observed data will not be available in the exceedance year, because it is only halfway through the 20-year period. Another approach is needed.
A new approach
We propose a new indicator — the 20-year average temperature rise centred around the current year. This is estimated by blending observations for the past 10 years with climate model projections or forecasts for the next 10 years, and taking an average over the combined 20-year period. This ‘current global warming level’ (CGWL) indicator meets our two criteria — it allows consistency with established IPCC definitions, and provides an instantaneous indicator of current warming.
 Climate loss-and-damage funding: a mechanism to make it work