High‐throughput sequencing for biology and medicine (original) (raw)
Genome sequencing technologies have advanced rapidly, dramatically decreasing cost and increasing throughput. But beyond faster and cheaper, these advances have also stimulated the development of innovative new experimental approaches, and are opening new doors in human medicine and health.
Introduction
Sequencing has progressed far beyond the analysis of DNA sequences, and is now routinely used to analyze other biological components such as RNA and protein, as well as how they interact in complex networks. In addition, increasing throughput and decreasing costs are making medical applications of sequencing a reality. Below we review various applications of next‐generation sequencing as we experience it today and also describe future prospects and challenges, with a particular focus on human biology.
Next‐generation sequencing (also ‘Next‐gen sequencing’ or NGS) refers to DNA sequencing methods that came to existence in the last decade after earlier capillary sequencing methods that relied upon ‘Sanger sequencing’ (Sanger et al, 1977). As opposed to the Sanger method of chain‐termination sequencing, NGS methods are highly parallelized processes that enable the sequencing of thousands to millions of molecules at once. Popular NGS methods include pyrosequencing developed by 454 Life Sciences (now Roche), which makes use of luciferase to read out signals as individual nucleotides are added to DNA templates, Illumina sequencing that uses reversible dye‐terminator techniques that adds a single nucleotide to the DNA template in each cycle and SOLiD sequencing by Life Technologies that sequences by preferential ligation of fixed‐length oligonucleotides. A recent review outlines a general timeline of the evolution of sequencing technologies and their features (Pareek et al, 2011). But these advances did not merely make the sequencing of DNA and RNA cheaper and more efficient; they have also helped create innovative new experimental approaches that delve deeper into the molecular mechanisms of genome organization and cellular function.
A prime example of the advances that have been facilitated by new sequencing technologies is the NHGRI‐funded ENCODE project, which was launched in late 2003, based largely upon methods first developed in yeast (Iyer et al, 2001; Horak and Snyder, 2002) (Table I). The pilot phase of ENCODE relied heavily on microarray‐based assays to analyze 1% of the human genome in unprecedented depth (Birney et al, 2007). With credit to advances in high‐throughput sequencing, researchers expanded the scope of this project to include the whole human genome (Bernstein et al, 2012). A total of ∼1650 high‐throughput experiments were performed to analyze transcriptomes and map elements, and identify methylation patterns in the human genome. This multi‐institution consortia project has assigned biochemical activities to 80% of the genome, particularly annotating the portion of the genome that lies outside the well‐studied protein‐coding regions, including mapping over four million regulatory regions. This information has also enabled researchers to map genetic variants to gene regulatory regions and assess indirect links to disease (Boyle et al, 2012). Similar projects annotating the genome have also been performed for Drosophila melanogaster (Consortium et al, 2010), Caenorhabditis elegans (Gerstein et al, 2010) and mouse (Stamatoyannopoulos et al, 2012).
Table I The various NGS assays employed in the ENCODE project to annotate the human genome
Here, we provide an overview of the new fields of biology that were made possible by advancements in DNA and RNA sequencing technologies. We briefly review techniques that were made more efficient, higher‐throughput, higher‐resolution and genome‐wide with the introduction of sequencing, and also discuss fundamentally new types of analyses that rely heavily on the constantly improving sequencing technologies. Their relevance in the clinical context is also highlighted.
Genomes, variation and epigenomics
Genome sequencing with next‐generation technologies was first applied to bacterial genomes using 454 technology (Smith et al, 2007). Decreasing costs have made these technologies a sufficiently commonplace that a large number of different organisms have been sequenced. As of June 2012, according to the Genomes Online Database, a total of 3920 bacterial and 854 different eukaryotic genomes have been completely sequenced (Pagani et al, 2012). Although resequencing new lines and closely related organisms is readily achieved, there are still significant challenges (Snyder et al, 2010). Different DNA sequencing platforms have different biases and abilities to call variants (Clark et al, 2011; Lam et al, 2012). Short indels (insertions and deletions) and larger structural variants are also particularly difficult to call (see below). De novo genome assembly can be attempted from short reads, but this remains difficult and leads to short contigs. Increasing read length and accuracy will greatly enhance our abilities to accurately sequence genomes de novo, which will also enable more precise mapping of variants between individuals.
Genome sequence and structural variation
In addition to the sequencing of the genomes of different organisms, projects to characterize the DNA sequence of individuals have gathered pace, and whole‐genome sequencing of humans is becoming commonplace (Gonzaga‐Jauregui et al, 2012). The reduced costs, increased accuracy and lowered data turn‐around time associated with NGS have enabled clinicians and medical researchers to identify susceptibility markers and inherited disease traits (see ‘Medical Genomic Sequencing’). Identifying damaging polymorphisms in coding regions (exonic variants) and those present in other functional regions (discussed below) of the genome are an integral part of clinical genomics. In order to achieve this goal, several groups are studying human genomic variation by sequencing or genotyping large number of individuals, including multi‐institute consortia projects such as the 1000 Genomes Project (Consortium, 2010), the Personal Genome Project (Ball et al, 2012), the HapMap project (Consortium, 2003) and the pan‐Asian single‐nucleotide polymorphism (SNP) project (Abdulla et al, 2009). The different human genome sequencing projects have revealed that individuals have ∼3.1–4 M SNPs between one another and the reference sequence (Consortium, 2003; Frazer et al, 2007), and, thus far, a total of over 30 M SNPs have been discovered from human genome sequencing projects. Studies have been successful in linking variants with a range of conditions, a catalogue of which is available at dbGaP, the database of Genotype and Phenotype (Mailman et al, 2007).
One area that has been particularly challenging in the sequencing of human genomes and other complex genomes are structural variations (SVs): large (>1 kb) segments of the genome that are duplicated, deleted or rearranged relative to reference sequences and among individuals (Figures 1A and B). Early microarray experiments indicated that SVs were abundant in the human genome (Louie et al, 2003; Conrad et al, 2006; Redon et al, 2006), although it was the advent of NGS that revealed that this is much more prevalent than previously appreciated (Ng et al, 2005; Chiu et al, 2006; Dunn et al, 2007; Korbel et al, 2007; Ng et al, 2007). Presently, four different approaches are used to map structural variants in genomes (Snyder et al, 2010). These include paired‐end mapping (Korbel et al, 2007), read depth (Abyzov et al, 2011), split reads (Zhang et al, 2011) and mapping sequences to breakpoint junctions (Kidd et al, 2010). Each has its own biases, but typically all four are used to help identify SVs. SVs affect genes as well as transcription factor‐binding sites, resulting in altered expression profiles of downstream genes (Snyder et al, 2010). Copy number variation has also been known to be associated with various diseases including glomerulonephritis (Aitman et al, 2006), Crohn's disease (McCarroll et al, 2008), HIV‐1/AIDS (Gonzalez et al, 2005) and psoriasis (de Cid et al, 2009). Although much work remains to be done, it is clear that SVs have a significant impact on disease regulation and health, making this an important class of elements to map in eukaryotic genomes.
Figure 1
The alternative text for this image may have been generated using AI.
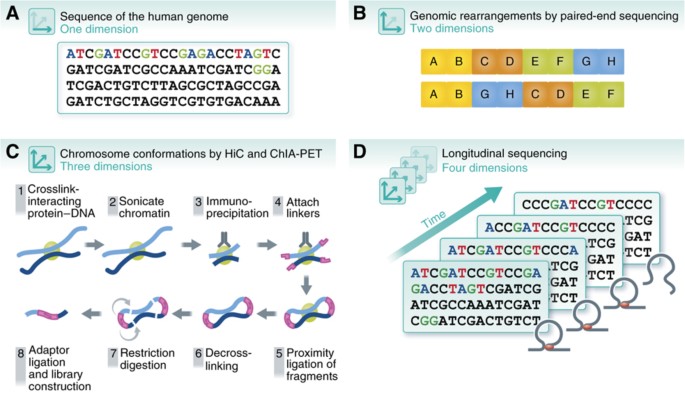
Dimensionality of the genome. The understanding of the human genome has expanded with advances of sequencing technologies, from (A) 1D sequencing of the human genome to (B) 2D mapping of SVs using methods such as paired‐end sequencing, (C) 3D genome‐wide chromosomal conformation capture using ChIA‐PET and Hi‐C, and (D) four dimensions across time.
Mapping higher‐order organization in eukaryotic genomes
New sequencing technologies have also enabled the mapping of three‐dimensional (3D) DNA interactions that were previously not possible on a genomic scale and resolution (Figure 1C). DNA analyses first became 3D with the development of chromosome conformation capture techniques such as 3C, 4C and 5C (Dekker et al, 2002; Dekker, 2006; Dostie et al, 2006; Simonis et al, 2006; Zhao et al, 2006; Dostie and Dekker, 2007). However, these techniques offered 3D mapping of DNA interactions only within regions where interactions were already expected (hypothesis‐driven). Further, primers had to be designed for each region, which made it very low throughput. With the invention of Hi‐C, which utilizes NGS on cross‐linked DNA fragments that have been sheared and digested to an optimal size to identify all DNA regions that are physically close together, genome‐wide mapping of chromosomal 3D structures became possible, at least at low resolution (20–100 kb) (Lieberman‐Aiden et al, 2009; Zhang et al, 2012b).
These newly developed sequencing methods provided important new insights into the global organization of eukaryotic genomes that were previously unattainable. Analyses of individual regions revealed that some distantly located regulatory elements, such as promoters, enhancers and insulators, come into close proximity to better mediate their activities (Branco and Pombo, 2006; Woodcock, 2006; Fraser and Bickmore, 2007; Osborne and Eskiw, 2008). Transcription factor‐mediated 3D interactions obtained using immunoprecipitation followed by paired‐end sequencing (ChIA‐PET) (Fullwood et al, 2009a, Fullwood et al, 2009b, Fullwood et al, 2010) revealed extensive interaction between enhancer and promoter regions, often encoded at long distances from one another on the chromosome (Fullwood et al, 2009a; Handoko et al, 2011; Li et al, 2012). These large‐scale analyses also revealed that chromosomal regions are organized together into territories of similar biological activity, such as active and inactive domains. These topological domains seem to be conserved across multiple cell types and mammalian species (Lieberman‐Aiden et al, 2009; Cremer and Cremer, 2010; Sung and Hager, 2011; Dixon et al, 2012). Figure 1 summarizes some of the ways that high‐throughput sequencing technologies have extended our understanding of the structural organization of genomes.
DNA and histone modification
Besides deciphering the sequence of genomes, NGS has also enabled the mapping of epigenetic marks such as DNA methylation (DNAm) and histone modification patterns in a genome‐wide manner (Figure 2).
Figure 2

The alternative text for this image may have been generated using AI.
Sequencing technologies and their uses. Various NGS methods can precisely map and quantify chromatin features, DNA modifications and several specific steps in the cascade of information from transcription to translation. These technologies can be applied in a variety of medically relevant settings, including uncovering regulatory mechanisms and expression profiles that distinguish normal and cancer cells, and identifying disease biomarkers, particularly regulatory variants that fall outside of protein‐coding regions. Together, these methods can be used for integrated personal omics profiling to map all regulatory and functional elements in an individual. Using this basal profile, dynamics of the various components can be studied in the context of disease, infection, treatment options, and so on. Such studies will be the cornerstone of personalized and predictive medicine.
Methylation of cytosine residues in DNA is the most studied epigenetic marker and is known to silence parts of the genome by inducing chromatin condensation (Newell‐Price et al, 2000). DNAm can be stably inherited in multiple cell divisions, thereby enabling it to regulate biological processes, such as cellular differentiation (Reik, 2007), tissue‐specific transcriptional regulation (Lister et al, 2009), cell identity (Feldman et al, 2006; Feng et al, 2006) and genomic imprinting (Li et al, 1993). Hypermethylation of the promoters of tumor‐suppressor genes has also been linked to retinoblastoma, colorectal cancer, leukemia, breast and ovarian cancers (Baylin, 2005). Such knowledge of hypermethylation is crucial in treatments, such as in the case of acute myeloid leukemia, where treatment with DNA methyl transferase inhibitor azacytidine has been shown to be successful in clinical trials (Silverman et al, 2002). Precise mapping of these methylation patterns genome wide has only been made possible by various NGS techniques, including methylated DNA immunoprecipitation (Taiwo et al, 2012), MethylC‐seq (Lister et al, 2009) and reduced representation bisulfite sequencing (RRBS) (Meissner et al, 2005). The latter two methods make use of sodium bisulfite conversion of unmethylated cytosine to uracil for identification of methylation patterns.
The nucleosomes around which DNA is bound are composed of dimers made up of four basic proteins—H2A–H2B and H3–H4—which are modified post‐translationally in a variety of ways, including acetylation, methylation, phosphorylation and sumoylation. Histone modification sites can be identified in a genome‐wide manner by the same method used to detect proteins bound to DNA (ChIP‐seq), using antibodies that specifically recognize the chemical modifications. Using such a method, 39 different histone modifications were revealed in CD4+ T cells, which were used to delineate between promoters and enhancers (Wang et al, 2008). More recently, the ENCODE project mapped 12 types of histone modifications in 46 cell types (Bernstein et al, 2012), revealing cell type‐specific patterns of histone modifications.
Depending on the particular modification on nucleosomes, specific regulatory proteins can be recruited to the site, resulting in the activation or repression of nearby genes (Barski et al, 2007). Histone modification is thus a very important epigenetic mark that directly affects gene regulation, and aberrant modifications have been linked to gene dysregulation in disease in multiple studies. Scanning for five histone marks in 183 primary prostate cancer tissues, two subgroups with distinct patterns of histone modifications were obtained that had distinct risks of tumor recurrence, demonstrating the predictive power of histone marks in disease prognosis (Seligson et al, 2005). Aberrant activity of histone‐modifying enzymes, such as the histone deacetylases, histone acetyl transferases and histone methyl transferases, or their cofactors, like _S_‐adenosyl methionine and acetyl coenzyme A, results in global changes in histone modification. Apart from using inhibitors to these proteins (Park et al, 2004), site‐directed, targeted restoration of the modifications might be a useful and important treatment strategy.
Transcriptomes and other functional elements in genomes
Beyond genome sequencing and interaction analyses, NGS has also enabled the global mapping of the transcriptome using RNA‐sequencing (RNA‐seq). High‐throughput methods have enabled detection and quantification of transcripts, discovery of novel isoforms and linking of their expression to genomic variants (allele‐specific variation). Significant interest also lies in uncovering the role of various regulatory factors in controlling the expression of genes, such as transcription factors and non‐coding RNAs (Figure 2). We review these aspects in detail in the following sections.
Transcript detection and quantification
Microarray technologies provided the first practical technique for measuring genome‐wide transcript levels. However, microarrays were only applicable to studying known genes, had significant problems with cross‐hybridization and high noise levels, and had a limited dynamic range of only ∼200 fold (Wang et al, 2009a). Much more accurate measurement of mRNA levels became possible with the introduction of RNA‐seq, which was invented in both yeast (Nagalakshmi et al, 2008; Wilhelm et al, 2010) and mammalian cells (Cloonan et al, 2008; Mortazavi et al, 2008). This method employs the high‐throughput sequencing of cDNA fragments generated from a library of total RNA or fractionated RNA. It allows unambiguous mapping to unique regions of the genome and hence, essentially, there is little or no background noise. RNA‐seq allows the precise quantification of transcripts and exons, and also the analysis of transcript isoforms with at least a 5000‐fold dynamic range (Wang et al, 2009b). Not only is RNA‐seq able to quantify more accurately the transcriptome consisting of known genes, it is also a great tool for identifying novel genes and RNAs that microarray technologies could not achieve. This includes the identification of novel expressed fusion genes using paired‐end RNA‐seq (Edgren et al, 2011), as well as the discovery of new non‐coding RNAs such as lincRNAs (Prensner et al, 2011).
Mapping transcript isoforms involves precise mapping of reads to known and potential splice junctions or the use of assembly to generate transcript isoforms followed by mapping to genomic regions. Eukaryotic transcriptomes are quite complex, and an average of five or more transcript isoforms have been reported for each gene (Birney et al, 2007). This figure is likely an underestimate as additional novel transcript isoforms may be discovered with increased sequencing depth (Ameur et al, 2010; Wu et al, 2010). Paired‐end sequencing allows better mapping of transcript isoforms (Ameur et al, 2010; Wu et al, 2010), although the precise deduction of the ensemble of gene transcripts from multi‐exon genes still remains a significant challenge. Increased read length will better enable the complexity of transcripts that are produced. RNA‐seq also enables mapping allele‐specific expression (ASE) (Zhang et al, 2009) and the identification of editing sites (Li et al, 2009), both of which are extensive in eukaryotic transcriptomes (Chen et al, 2012).
The ability to detect and accurately quantify transcript levels using NGS technologies has significant impacts in the clinic. Altered expression of specific isoforms have been identified to be detrimental in ischemic stroke (Gretarsdottir et al, 2003) and type 2 diabetes (Horikawa et al, 2000) among others; ASE of the TGF beta type 1 receptor confers genetic predisposition to colorectal cancer (Valle et al, 2008); and ASE of proapoptotic gene DAPK1 is associated with chronic lymphocytic leukemia (Lynch et al, 2002). Allelic imbalances that result in altered gene expression profiles were compared across oral squamous cell carcinoma tumors and matched normal tissues (Tuch et al, 2010). These genes were enriched in cancer‐related functions and indicate that allelic imbalance is an underlying cause of cancer etiology. Transcriptome profiling using RNA‐seq also revealed several novel transcripts and gene fusions in melanoma (Berger et al, 2010) and Alzheimer's disease (Twine et al, 2011), emphasizing the importance of high‐throughput sequencing in the understanding of human diseases.
Profiling transcript production and ribosome‐bound mRNAs
Transcript abundance is only one measure for analyzing the expression of gene products. Recently, it has become possible to measure the production of nascent RNAs by bromo‐uridinating nuclear run‐on RNA molecules and sequencing them (GRO‐Seq, for Global Run‐On Sequencing) (Core et al, 2008) or by immunoprecipitation of RNA polymerase followed by sequencing the bound RNA fragments, a process called NET‐seq (Churchman and Weissman, 2001; Churchman and Weissman, 2011). The dynamics of transcript synthesis and decay can also be tracked using dynamic transcriptome analysis (DTA) (Miller et al, 2011). These methods not only identify RNA polymerase II‐bound transcripts but also the direction of transcription and its rate of decay. These efforts have revealed promoter‐proximal pausing and active genes. More than twice the number of active genes has also been discovered in the lung fibroblast, as compared with the number of active genes obtained from a microarray of the same cell line (Core et al, 2008).
In addition to transcriptional control, protein expression is controlled at the level of translation. Ingolia et al (2009) developed Ribo‐Seq to measure the quantities of ribosome‐bound fragments by first freezing ribosomes and using the translation inhibitor cycloheximide. The mRNA is then digested and the resulting fragments sequenced to reveal mRNA regions occupied by ribosomes. The quantification of ribosome‐bound regions is used as a proxy for translation efficiency. These studies have revealed that many upstream ORFs in mRNA are bound to ribosomes, that many non‐ATG codons are used, and that ribosome occupancy and mRNA show a partial correlation. Thus, high‐throughput sequencing has provided considerable insight into many levels of gene expression.
Genome‐wide identification of protein–DNA interactions
Much of gene regulation is thought to occur at the level of transcriptional control, and the binding sites of transcription factors are associated with regulation of gene expression. Experimental identification of these sites has been an area of high interest and constant improvement. The first experiments to map transcription factor‐binding sites genome wide used chromatin immunoprecipitation (ChIP) of a transcription factor of interest followed by recovery of the associated DNA and probing on DNA microarrays (ChIP–chip) (Iyer et al, 2001; Horak and Snyder, 2002). This method, however, was noisy and expensive to apply to large genomes. Sequencing technologies made widespread application of genomic ChIP profiling to the human genome practical. Protein–DNA interactions based on NGS (ChIP‐seq) not only provided clear indications of transcription factor‐binding sites at high resolution, but also enabled genome‐wide mapping of histone marks (Figure 2). ChIP‐seq (Johnson et al, 2007; Robertson et al, 2007) was similar to ChIP–chip in that DNA associated with a transcription factor or histone modification of interest was enriched by immunoprecipitation, but was followed by NGS of the DNA and mapping the sequence reads back to the genome (Robertson et al, 2007) rather than hybridization to a microarray. ChIP‐seq has been applied to many studies such as global analyses of several DNA‐binding regions (as in the ENCODE project), as well as mapping regulatory differences between individuals and in disease settings. Genome‐wide binding profiles across 10 individuals (lymphoblastoid cell lines) for two transcription factors, NFκB and PolII, revealed significant binding differences between any two individuals (7.5% for NFkB and 25% for PolII‐binding sites). These also correlate to the expression of the downstream target genes (Kasowski et al, 2010). In another example, polymorphisms in a gene desert associated to coronary artery disease were found to affect STAT1 binding, resulting in altered expression of neighboring genes. These long‐range enhancer interactions support the importance of regulatory polymorphisms as disease biomarkers (Harismendy et al, 2011).
Other complementary techniques to globally identify potential regulatory regions include the identification of DNAse1 hypersensitive sites, using formaldehyde‐assisted isolation of regulatory elements (FAIRE) (Nammo et al, 2011) and Sono‐Seq (Auerbach et al, 2009) (Figure 2). These methods globally map large numbers of potential regulatory sites across the human genome, although in most cases what these elements bind is not known.
Besides proteins that map to chromosomes, RNA species such as long non‐coding RNAs (lncRNA) are also important regulators of the chromatin structure and are involved in several biological processes (Wang and Chang, 2011). An effective method, ChIRP (chromatin isolation by RNA purification), has been developed (Chu et al, 2011), which can effectively detect the interaction of lncRNAs and chromatin in a genome‐wide scale (Figure 2). LncRNA is crosslinked with glutaraldehyde and hybridized to oligonucleotide tiles. The sequence bound to the complex is then determined using NGS.
Medical genomic sequencing
Genomic sequencing will have an enormous impact on the field of medicine. Until recently, cost and throughput limitations have made general clinical applications infeasible. Currently, though, the price of about 5000USD for a normal human genome sequence (not counting analysis) and fast throughput (several days to a few weeks) is rapidly making medical sequencing practical. Indeed, high‐throughput sequencing has already been used to help diagnose highly genetically heterogeneous disorders, such as X‐linked intellectual disability, congenital disorders of glycosylation and congenital muscular dystrophies (Zhang et al, 2012a); to detect carrier status for rare genetic disorders (Tester and Ackerman, 2011; Zhang et al, 2012a); and to provide less‐invasive detection of fetal aneuploidy through the sequencing of free fetal DNA (Fan et al, 2008, 2012).
While this is a promising start for high‐throughput sequencing in the clinic, these technologies must be used with caution as they have non‐negligible false‐positive and false‐negative rates owing to sequencing errors and amplification biases, which need to be improved upon with optimized library construction methods, improved sequencing technologies or filtering algorithms. Nonetheless, medical sequencing could potentially be applied in a wide range of settings in the future. Here, we highlight three main areas: cancer, hard‐to‐diagnose diseases and personalized medicine.
Genome sequencing in cancer
Cancer is a genetic disease, both in predisposition and somatic growth. High‐throughput sequencing of cancer genomes has been a major factor in the understanding of the genetics of this complex disease. Exome sequencing, RNA sequencing, paired‐end sequencing and whole‐genome sequencing of cancer genomes have led to a dramatic increase in the number of known recurrent somatic alterations, such as mutations, amplifications, deletions and translocations (Bass et al, 2011; Salzman et al, 2011; Fujimoto et al, 2012).
These studies have revealed many interesting findings. As a recent example, using paired‐end sequencing, Inaki et al (2011) discovered that approximately half of all structural rearrangements in breast cancer genomes result in fusion transcripts, where single segmental tandem duplication spanning multiple genes is a major source. They estimated that 44% of these fusion transcripts are potentially translated, and found a novel RPS6KB1–VMP1 fusion gene that is recurrent in a third of breast cancer samples analyzed, with potential association with prognosis. Simultaneously, Hillmer et al (2011) applied paired‐end sequencing on cancer and non‐cancer human genomes, and found that non‐cancer genomes contain more inversion, deletions and insertions, whereas cancer genomes are dominated by duplications, translocations and complex rearrangements. Recent works from Korbel et al and others have found that cancer genomes lacking p53 often contain genomic regions that undergo extensive rearrangements called ‘chromothripsis’, suggestive of complex chromosome shattering and rejoining in a single event (Nowell, 1976; Korbel et al, 2007; Stratton et al, 2009; Kloosterman et al, 2011; Stephens et al, 2011; Tubio and Estivill, 2011; Rausch et al, 2012). Much work has also been done on matched tumor–normal pairs and revealed that extensive somatic SNVs and SVs occur in cancer genomes (Kumar et al, 2011; Wei et al, 2011; Banerji et al, 2012; Wang et al, 2012; Zang et al, 2012).
One important medical conclusion that has emerged from this work is that every tumor is genetically different but that common pathways are often activated. Thus, the sequencing of cancer genomes can help reveal the activated pathways and the information used to suggest therapeutic treatments. As an example, the detection of novel fusion transcripts in a difficult diagnostic case of acute promyelocytic leukemia that were previously missed in a regular diagnosis was used to influence the medical care of the patient (Welch et al, 2011). In addition, sequencing of carefully selected samples could lead to interesting discoveries of cancer evolution and mutational processes (Nik‐Zainal et al, 2012a, 2012b).
Genome sequencing for clinical assessment of ‘mysterious’ diseases
Whole‐genome and ‐exome sequencing is likely to prove useful in the diagnosis of rare diseases and in selecting the optimal individualized treatment option for patients. This approach typically involves the use of families; sequencing of affected individuals and relatives along with inheritance patterns is used to deduce variants that are associated with a disease. Whole‐exome sequencing performed on a four‐member family led to the discovery of the causative gene for Miller's syndrome, an extremely rare condition that gives rise to micrognathia and cleft lips among other features (Ng et al, 2010). Nicholas Volker received a bone marrow transplant after his genome sequence indicated he had a mutation on the X chromosome that led to an inherited immune disorder that was giving him multiple problems. With the new diagnosis at hand, Volker was successfully treated and his severe inflammatory bowel disease alleviated (Worthey et al, 2011). Richard Gibbs describes using complete genome sequences of twins diagnosed with dopa‐responsive dystonia to identify the appropriate treatment option, which eventually resulted in significant clinical improvements of the twins (Bainbridge et al, 2011). With multiple examples of whole‐genome sequencing aiding the diagnosis and treatment of tough medical cases, sequencing in medical care is promising. However, it should be noted that in many cases, whole‐genome sequencing of families does not always reveal the causative mutation. In some cases, it may suggest a list of possible candidates and in others, no obvious gene candidate is revealed. Clearly, a major bottleneck is the interpretation of gene variants and their effect on human health.
Personal genome sequencing for detecting medically actionable risks
Whole‐genome sequencing and transcriptome analyses have shed light on mutations and expression alterations in individuals and in disease states. However, until recently, the power of genome sequencing for otherwise healthy individuals was unknown. Moreover, the integration of multiple different sequencing technologies amplifies the amount of information one can derive from medical examples by many fold. A recent example by Chen et al examined the power of personal genome sequencing of a healthy person to access disease risk, using integrated multiple ‘omics’ data sets of a single individual in what they termed integrated personal omics profiling (Chen et al, 2012) (Figures 1D and 2). This study sequenced the genome of an individual at high accuracy and followed the transcriptomic, metabolomic and proteomic profiles of the single individual over a 14‐month period. The integrated analysis not only allowed more complete understanding of the individual's genetic make‐up and disease risks, but also tracked the emergence of type 2 diabetes. The extensive study revealed how various biological systems function and change together over the course of time as well as during the transition from a healthy to diseased state. The dynamic and complex nature of the human biological system emphasizes that such longitudinal monitoring of trends and changes may be the future of disease monitoring and even diagnosis.
However, many obstacles still lie between current medical practice and this kind of in‐depth longitudinal patient monitoring. For one, the amount of time, money and effort needed to process such massive amounts of data for each patient is not practical at present. Further, the cost benefits of longitudinal patient monitoring in tracking disease onset and progression need to be more comprehensively assessed. Despite these formidable challenges, one cannot deny the promise such information holds for improving medical treatment and health management.
Single‐cell sequencing
Biological research often involves the analysis of tissues, cell populations and whole organisms. However, much variation occurs at the single‐cell level where understanding of each individual cell is crucial for the analysis of the entire system. Cancer cells, for example, are heterogeneous populations of multiple clonal expansions, and analyzing a tumor as one entity could mask many important characteristics of the tumor. The ideal approach to such systems biology thus requires analyzing ‘parts’ of these systems individually, using methods and technologies that can extract data at few or single‐cell levels (Schubert, 2011).
Single‐cell sequencing in cancer
Most sequencing techniques that have been developed to date require DNA or RNA from over 105 cells (Metzker, 2008; Schuster, 2008; Metzker, 2010). This is a significant problem in solid tumors because of the heterogeneous nature of the tumors. In addition to multiclonal populations of cancer cells within each solid tumor, non‐cancerous cells, such as blood cells and fibroblasts, are also present (Heppner, 1984; Marusyk and Polyak, 2010). This complex mixture of cells complicates analyses of data obtained from tumor sequencing, and signals from cancer cells tend to be masked by that from other cells. Determining gene expression and copy number by ‘averaging’ across these complex cell populations is also far from ideal, and can give a measurement that is vastly different from the truth at the level of the individual cell (Wang and Bodovitz, 2010). Thus, separating these distinct cell populations and analyzing them individually is critical to a more thorough and accurate understanding of cancer. Laser capture microdissection is a method used to isolate tumor cells from their neighboring normal cell counterparts, in an attempt to get ‘pure’ tumor cells for sequencing (Espina et al, 2006a, Espina et al, 2006b, Espina et al 2007). Flow cytometry can also do the same, for tumor cells that are known to have a specific protein that is differentially expressed as compared with normal cells (Glogovac et al, 1996; van Beijnum et al, 2008). However, the heterogeneity of tumors still serves as a major problem, masking signals and making it difficult to differentiate signal from noise in bulk tissue analyses. Single‐cell analysis using cytological methods and aCGH is possible, but only at limited resolution and coverage (Mark et al, 1998; Le Caignec et al, 2006; Fiegler et al, 2007; Fuhrmann et al, 2008; Hannemann et al, 2011).
Recent advances in single‐cell sequencing enable significantly higher resolution than has been previously achieved. Navin et al was the first group to analyze tumors in such a manner. Using breast cancer as a model, they sequenced 100 single nuclei from distinct sections of a polygenomic breast tumor to obtain 50‐kb copy number profiles, and showed that the tumor originated from three clonal subpopulations. They then sequenced another 100 single nuclei from a monogenomic primary tumor with matched liver metastasis, demonstrating that the primary tumor was from a single clonal expansion, and that the metastasis had arose from one of the cells in the primary tumor (Navin et al, 2011).
The Beijing Genomics Institute team extended this further by developing a high‐throughput single‐cell sequencing method that could reach single‐nucleotide resolution. This technique was applied to conduct single‐cell exome analysis of the JAK‐2 negative neoplasm (Hou et al, 2012). Results demonstrated that this type of neoplasm arise from a single clonal expansion, and many novel mutated genes were identified (at >96% accuracy) that could be further explored for therapeutic purposes. The same technique was applied to a solid tumor of clear cell renal cell carcinoma, which revealed greater genetic complexity of the cancer than previously expected (Hou et al, 2012; Xu et al, 2012).
Taken together, it has been demonstrated that single‐cell analyses of highly heterogeneous tissues provide much clearer intratumoral genetic pictures and developmental histories than previous bulk tissue sequencing. These developments finally allow tumor populations to be probed at an extremely high resolution with significantly lower noise signals from any non‐cancerous cells and different subclones. This platform will serve to improve our understanding of how tumors develop, expand and progress.
Potential clinical applications of single‐cell sequencing include detection of rare circulating tumor cells. These circulating tumor cells that are found in bodily fluids, such as the blood or urine, can now be isolated by microfluidic methods (Lien et al, 2010; Dickson et al, 2011; Xia et al, 2011; O'Flaherty et al, 2012). Genomics analyses can then be applied to the patients’ DNA and RNA without the need of even a biopsy, which could be useful for both diagnosis and prognosis of the cancer in a non‐invasive way. Single‐cell sequencing of the biopsied tumor could also reveal if there is a multiclonal subpopulation of the cells as shown by Navin et al, and better personalized treatment options targeting the different mutations and aberrations in the subpopulations can be offered (Navin et al, 2011).
To make this a reality in clinics, work has to be done to compare single‐cell diagnosis and prognosis of cancer to the current gold standards of clinical diagnosis and prognosis. Given the many different types of cancer, single‐cell sequencing may only be useful for certain cancer types, depending on the amount of circulating tumor cells and the impact of clonality on the prognosis of each cancer subtype.
Single‐cell sequencing in embryonic stem cell developmental biology
Previously, transcriptome analyses and whole‐genome sequencing required a large number of cells, which made it inherently difficult to study gene expression or genomic variation within rare totipotent and pluripotent cell populations or within early embryos consisting of only a limited number of cells. How so many cell types can be derived from each pluripotent stem cell, and how each stem cell ‘knows’ how to behave differently, has been an area of intense research. Indeed, within early animal embryos, each cell is likely to express specific transcriptional programs that define its eventual developmental fate (Gage and Verma, 2003; Sylvester and Longaker, 2004).
With the emergence of technologies that allow single‐cell expression analysis, expression programs in 64‐cell human blastocysts were determined resulting in the identification of distinct markers uniquely expressed in the different cell types of the blastocyst (Guo et al, 2010). Single‐cell RNA sequencing enabled an even more in‐depth and comprehensive analysis of the stem cell transcriptome at a genome‐wide manner. With such capabilities, Tang et al (2009) identified over 1500 previously unknown splice junctions that could be critical for oogenesis.
Further comprehensive analysis of complex biological systems using single‐cell approaches will undoubtedly provide new insights. It will likely reveal the myriad of underlying biological states that exist (e.g., cell cycle) as well as the role that stochastic events have in the formulation of complex cellular and developmental processes. For instance, although genetically identical cells in the same tissue type are usually analyzed as a homogenous population, they really are not (Elowitz et al, 2002). It has been suggested in multiple occasions that crosstalk happens between genetically identical cells (Elowitz et al, 2002; Sachs et al, 2005; Maheshri and O'Shea, 2007; Raj and van Oudenaarden, 2008; Snijder et al, 2009). Much is known about what happens within a cell, but knowledge of how information is transmitted from one cell to another, how cells communicate to accommodate variability, is very much lacking. There remains much to be discovered about how normal cells interact with one another, and how they function to maintain a homeostatic status despite high cell‐to‐cell variability. Resolution and depth have served as one of the most major obstacles in achieving this (Elowitz et al, 2002). With the new ability to analyze large populations of single‐cell transcriptomes by high‐throughput single‐cell RNA sequencing, a largely unchartered realm of molecular biology will finally be accessible (Pelkmans, 2012).
Future developments
High‐throughput sequencing, with its rapidly decreasing costs and increasing applications, is replacing many other research technologies. For example, gene expression studies are slowly moving from expression array technologies to RNA sequencing for the higher resolution, lower biases and ability to discover novel transcripts and mutations. With the availability of deeply sequenced RNA‐seq data sets and high‐resolution variation information, it has been possible to delineate allele‐specific binding of transcription factors and allele‐specific binding based on the maternal‐ versus paternal‐derived alleles (Rozowsky et al, 2011). As more personal genomes become available, the functional elements can be mapped specifically to the individual's own genetic information. Cytogenetics is being replaced by paired‐end sequencing to identify genomic rearrangements and copy number variants at a much higher resolution and throughput.
Nonetheless, significant challenges remain with NGS. These include data processing and storage. In 5 years’ time, we are likely to have sequenced more than a million human genomes. Where and how these data will be stored will be a big problem. Another significant challenge is genome interpretation. This includes not only the analysis of genomes for functional elements but the understanding of the significance of variants in individual genomes on human phenotypes and disease. All these add to the still‐impractical costs of vast sequencing applications in the clinic. Although sequencing costs have dipped tremendously in recent years, further decrease in costs have to occur before more ambitious applications, such as whole‐genome sequencing and longitudinal monitoring, can have a chance in the clinic.
Cost–benefit analyses of sequencing applications in the clinic have to be conducted before actual medical application. Comparison with currently available techniques needs to be done, and a decision made to whether such screens should be made routine or only under exceptional cases. The benefits of sequencing applications in the medical clinic definitely look promising, but much remains to be done in ironing out minute details to make it practical and applicable.
With many people's genomes sequenced, security also becomes an important factor. How will these information be stored, and who will have access to them? Will the individuals know every detail of their genome, or only those pertinent to disease diagnosis or treatment? How can we prevent the possible emergence of ‘genetic discrimination’? Ethical issues will definitely emerge with the commonalization of personal genomes, and these issues need to be resolved before we arrive there.
Our current knowledge and understanding of the human genome still lies largely in the coding regions of the genome. SNPs and SVs that are discovered in non‐coding regions are generally dismissed as ‘less important’ and ‘not causal’. Although this approach allows us to prioritize and focus resources on the more probable damaging mutations, the effects of non‐coding regions in regulation and human disease are becoming more evident. Based on the wealth of non‐genic functional regulatory regions obtained from the ENCODE project, RegulomeDB has been developed as a resource for integrating and cross‐validating polymorphisms to the regulatory regions (Boyle et al, 2012). Disease‐associated SNPs obtained from GWAS studies might point to gene deserts, but could essentially lie in regulatory sites of downstream genes. Often, the SNP that is in linkage disequilibrium with the reported SNP might be more informative (Boyle et al, 2012). It is necessary, in the future, to develop ways to map sequencing data onto currently difficult‐to‐map regions, such as highly repetitive and low‐expressed regions. Sequencing technology is rapidly improving, but the analytical capabilities to understand everything that is being generated by the sequencers is lagging far behind. We need to advance the computational technologies as we progress towards the systemic use of high‐throughput sequencing in research and medicine.
References
- Abdulla MA, Ahmed I, Assawamakin A, Bhak J, Brahmachari SK, Calacal GC, Chaurasia A, Chen CH, Chen J, Chen YT, Chu J, Cutiongco‐de la Paz EM, De Ungria MC, Delfin FC, Edo J, Fuchareon S, Ghang H, Gojobori T, Han J, Ho SF et al (2009) Mapping human genetic diversity in Asia. Science 326: 1541–1545
Google Scholar - Abyzov A, Urban AE, Snyder M, Gerstein M (2011) CNVnator: an approach to discover, genotype, and characterize typical and atypical CNVs from family and population genome sequencing. Genome Res 21: 974–984
Google Scholar - Aitman TJ, Dong R, Vyse TJ, Norsworthy PJ, Johnson MD, Smith J, Mangion J, Roberton‐Lowe C, Marshall AJ, Petretto E, Hodges MD, Bhangal G, Patel SG, Sheehan‐Rooney K, Duda M, Cook PR, Evans DJ, Domin J, Flint J, Boyle JJ et al (2006) Copy number polymorphism in Fcgr3 predisposes to glomerulonephritis in rats and humans. Nature 439: 851–855
Google Scholar - Ameur A, Wetterbom A, Feuk L, Gyllensten U (2010) Global and unbiased detection of splice junctions from RNA‐seq data. Genome Biol 11: R34
Google Scholar - Auerbach RK, Euskirchen G, Rozowsky J, Lamarre‐Vincent N, Moqtaderi Z, Lefrancois P, Struhl K, Gerstein M, Snyder M (2009) Mapping accessible chromatin regions using Sono‐Seq. Proc Natl Acad Sci USA 106: 14926–14931
Google Scholar - Bainbridge MN, Wiszniewski W, Murdock DR, Friedman J, Gonzaga‐Jauregui C, Newsham I, Reid JG, Fink JK, Morgan MB, Gingras M‐C, Muzny DM, Hoang LD, Yousaf S, Lupski JR, Gibbs RA (2011) Whole‐genome sequencing for optimized patient management. Sci Translational Med 3: 87re83
Google Scholar - Ball MP, Thakuria JV, Zaranek AW, Clegg T, Rosenbaum AM, Wu X, Angrist M, Bhak J, Bobe J, Callow MJ, Cano C, Chou MF, Chung WK, Douglas SM, Estep PW, Gore A, Hulick P, Labarga A, Lee J‐H, Lunshof JE et al (2012) A public resource facilitating clinical use of genomes. Proc Natl Acad Sci USA 109: 11920–11927
Google Scholar - Banerji S, Cibulskis K, Rangel‐Escareno C, Brown KK, Carter SL, Frederick AM, Lawrence MS, Sivachenko AY, Sougnez C, Zou L, Cortes ML, Fernandez‐Lopez JC, Peng S, Ardlie KG, Auclair D, Bautista‐Pina V, Duke F, Francis J, Jung J, Maffuz‐Aziz A et al (2012) Sequence analysis of mutations and translocations across breast cancer subtypes. Nature 486: 405–409
Google Scholar - Barski A, Cuddapah S, Cui K, Roh TY, Schones DE, Wang Z, Wei G, Chepelev I, Zhao K (2007) High‐resolution profiling of histone methylations in the human genome. Cell 129: 823–837
Google Scholar - Bass AJ, Lawrence MS, Brace LE, Ramos AH, Drier Y, Cibulskis K, Sougnez C, Voet D, Saksena G, Sivachenko A, Jing R, Parkin M, Pugh T, Verhaak RG, Stransky N, Boutin AT, Barretina J, Solit DB, Vakiani E, Shao W et al (2011) Genomic sequencing of colorectal adenocarcinomas identifies a recurrent VTI1A‐TCF7L2 fusion. Nat Genet 43: 964–968
Google Scholar - Baylin SB (2005) DNA methylation and gene silencing in cancer. Nat Clin Pract Oncol 2: Suppl 1S4–11
Google Scholar - Berger MF, Levin JZ, Vijayendran K, Sivachenko A, Adiconis X, Maguire J, Johnson LA, Robinson J, Verhaak RG, Sougnez C, Onofrio RC, Ziaugra L, Cibulskis K, Laine E, Barretina J, Winckler W, Fisher DE, Getz G, Meyerson M, Jaffe DB et al (2010) Integrative analysis of the melanoma transcriptome. Genome Res 20: 413–427
Google Scholar - Bernstein BE, Birney E, Dunham I, Green ED, Gunter C, Snyder M (2012) An integrated encyclopedia of DNA elements in the human genome. Nature 489: 57–74
Google Scholar - Birney E, Stamatoyannopoulos JA, Dutta A, Guigo R, Gingeras TR, Margulies EH, Weng Z, Snyder M, Dermitzakis ET, Thurman RE, Kuehn MS, Taylor CM, Neph S, Koch CM, Asthana S, Malhotra A, Adzhubei I, Greenbaum JA, Andrews RM, Flicek P et al (2007) Identification and analysis of functional elements in 1% of the human genome by the ENCODE pilot project. Nature 447: 799–816
Google Scholar - Boyle AP, Hong EL, Hariharan M, Cheng Y, Schaub MA, Kasowski M, Karczewski KJ, Park J, Hitz BC, Weng S, Cherry JM, Snyder M (2012) Annotation of functional variation in personal genomes using regulomedb. Genome Res 22: 1790–1797
Google Scholar - Branco MR, Pombo A (2006) Intermingling of chromosome territories in interphase suggests role in translocations and transcription‐dependent associations. PLoS Biol 4: 780–788
Google Scholar - Chen R, Mias George I, Li‐Pook‐Than J, Jiang L, Lam Hugo YK, Chen R, Miriami E, Karczewski Konrad J, Hariharan M, Dewey Frederick E, Cheng Y, Clark Michael J, Im H, Habegger L, Balasubramanian S, O'Huallachain M, Dudley Joel T, Hillenmeyer S, Haraksingh R, Sharon D et al (2012) Personal omics profiling reveals dynamic molecular and medical phenotypes. Cell 148: 1293–1307
Google Scholar - Chiu KP, Wong C‐H, Chen Q, Ariyaratne P, Ooi HS, Wei C‐L, Sung W‐KK, Ruan Y (2006) PET‐Tool: a software suite for comprehensive processing and managing of Paired‐End diTag (PET) sequence data. BMC Bioinform 7:
- Chu C, Qu K, Zhong Franklin L, Artandi Steven E, Chang Howard Y (2011) Genomic maps of long noncoding RNA occupancy reveal principles of RNA‐chromatin interactions. Mol Cell 44: 667–678
Google Scholar - Churchman LS, Weissman JS (2001) Native elongating transcript sequencing (NET‐seq). In Current Protocols in Molecular Biology John Wiley & Sons, Inc.
- Churchman LS, Weissman JS (2011) Nascent transcript sequencing visualizes transcription at nucleotide resolution. Nature 469: 368–373
Google Scholar - Clark MJ, Chen R, Lam HY, Karczewski KJ, Euskirchen G, Butte AJ, Snyder M (2011) Performance comparison of exome DNA sequencing technologies. Nat Biotechnol 29: 908–914
Google Scholar - Cloonan N, Forrest AR, Kolle G, Gardiner BB, Faulkner GJ, Brown MK, Taylor DF, Steptoe AL, Wani S, Bethel G, Robertson AJ, Perkins AC, Bruce SJ, Lee CC, Ranade SS, Peckham HE, Manning JM, McKernan KJ, Grimmond SM (2008) Stem cell transcriptome profiling via massive‐scale mRNA sequencing. Nat Methods 5: 613–619
Google Scholar - Conrad DF, Andrews TD, Carter NP, Hurles ME, Pritchard JK (2006) A high‐resolution survey of deletion polymorphism in the human genome. Nat Genet 38: 75–81
Google Scholar - Consortium GP (2010) A map of human genome variation from population‐scale sequencing. Nature 467: 1061–1073
Google Scholar - Consortium IH (2003) The International HapMap Project. Nature 426: 789–796
Google Scholar - Consortium TM, Roy S, Ernst J, Kharchenko PV, Kheradpour P, Negre N, Eaton ML, Landolin JM, Bristow CA, Ma L, Lin MF, Washietl S, Arshinoff BI, Ay F, Meyer PE, Robine N, Washington NL, Di Stefano L, Berezikov E, Brown CD et al (2010) Identification of functional elements and regulatory circuits by Drosophila modENCODE. Science 330: 1787–1797
Google Scholar - Core LJ, Waterfall JJ, Lis JT (2008) Nascent RNA sequencing reveals widespread pausing and divergent initiation at human promoters. Science 322: 1845–1848
Google Scholar - Crawford GE, Holt IE, Whittle J, Webb BD, Tai D, Davis S, Margulies EH, Chen Y, Bernat JA, Ginsburg D, Zhou D, Luo S, Vasicek TJ, Daly MJ, Wolfsberg TG, Collins FS (2006) Genome‐wide mapping of DNase hypersensitive sites using massively parallel signature sequencing (MPSS). Genome Res 16: 123–131
Google Scholar - Cremer T, Cremer M (2010) Chromosome Territories. Cold Spring Harbor Perspect Biol 2: 292–301
Google Scholar - de Cid R, Riveira‐Munoz E, Zeeuwen PL, Robarge J, Liao W, Dannhauser EN, Giardina E, Stuart PE, Nair R, Helms C, Escaramis G, Ballana E, Martin‐Ezquerra G, den Heijer M, Kamsteeg M, Joosten I, Eichler EE, Lazaro C, Pujol RM, Armengol L et al (2009) Deletion of the late cornified envelope LCE3B and LCE3C genes as a susceptibility factor for psoriasis. Nat Genet 41: 211–215
Google Scholar - Dekker J (2006) The three 'C's of chromosome conformation capture: controls, controls, controls. Nat Methods 3: 17–21
Google Scholar - Dekker J, Rippe K, Dekker M, Kleckner N (2002) Capturing chromosome conformation. Science 295: 1306–1311
Google Scholar - Dickson MN, Tsinberg P, Tang Z, Bischoff FZ, Wilson T, Leonard EF (2011) Efficient capture of circulating tumor cells with a novel immunocytochemical microfluidic device. Biomicrofluidics 5: 034119
Google Scholar - Dixon JR, Selvaraj S, Yue F, Kim A, Li Y, Shen Y, Hu M, Liu JS, Ren B (2012) Topological domains in mammalian genomes identified by analysis of chromatin interactions. Nature 485: 376–380
Google Scholar - Dostie J, Dekker J (2007) Mapping networks of physical interactions between genomic elements using 5C technology. Nat Protocols 2: 988–1002
Google Scholar - Dostie J, Richmond TA, Arnaout RA, Selzer RR, Lee WL, Honan TA, Rubio ED, Krumm A, Lamb J, Nusbaum C, Green RD, Dekker J (2006) Chromosome conformation capture carbon copy (5C): a massively parallel solution for mapping interactions between genomic elements. Genome Res 16: 1299–1309
Google Scholar - Dunn JJ, McCorkle SR, Everett L, Anderson CW (2007) Paired‐end genomic signature tags: a method for the functional analysis of genomes and epigenomes. Genet Eng (NY) 28: 159–173
Google Scholar - Edgren H, Murumagi A, Kangaspeska S, Nicorici D, Hongisto V, Kleivi K, Rye I, Nyberg S, Wolf M, Borresen‐Dale A‐L, Kallioniemi O (2011) Identification of fusion genes in breast cancer by paired‐end RNA‐sequencing. Genome Biol 12: R6
Google Scholar - Elowitz MB, Levine AJ, Siggia ED, Swain PS (2002) Stochastic gene expression in a single cell. Science 297: 1183–1186
Google Scholar - Espina V, Heiby M, Pierobon M, Liotta LA (2007) Laser capture microdissection technology. Expert Rev Mol Diagn 7: 647–657
Google Scholar - Espina V, Milia J, Wu G, Cowherd S, Liotta LA (2006a) Laser capture microdissection. In Methods in Molecular Medicine Taatjes DJMBT (ed) (Vol. 319) pp 213–229
- Espina V, Wulfkuhle JD, Calvert VS, VanMeter A, Zhou W, Coukos G, Geho DH, Petricoin EF III, Liotta LA (2006b) Laser‐capture microdissection. Nat Protoc 1: 586–603
Google Scholar - Fan HC, Blumenfeld YJ, Chitkara U, Hudgins L, Quake SR (2008) Noninvasive diagnosis of fetal aneuploidy by shotgun sequencing DNA from maternal blood. Proc Natl Acad Sci USA 105: 16266–16271
Google Scholar - Fan HC, Gu W, Wang J, Blumenfeld YJ, El‐Sayed YY, Quake SR (2012) Non‐invasive prenatal measurement of the fetal genome. Nature 487: 320–324
Google Scholar - Feldman N, Gerson A, Fang J, Li E, Zhang Y, Shinkai Y, Cedar H, Bergman Y (2006) G9a‐mediated irreversible epigenetic inactivation of Oct‐3/4 during early embryogenesis. Nat Cell Biol 8: 188–194
Google Scholar - Feng YQ, Desprat R, Fu H, Olivier E, Lin CM, Lobell A, Gowda SN, Aladjem MI, Bouhassira EE (2006) DNA methylation supports intrinsic epigenetic memory in mammalian cells. PLoS Genet 2: e65
Google Scholar - Fiegler H, Geigl JB, Langer S, Rigler D, Porter K, Unger K, Carter NP, Speicher MR (2007) High resolution array‐CGH analysis of single cells. Nucleic Acids Res 35:
- Fraser P, Bickmore W (2007) Nuclear organization of the genome and the potential for gene regulation. Nature 447: 413–417
Google Scholar - Frazer KA, Ballinger DG, Cox DR, Hinds DA, Stuve LL, Gibbs RA, Belmont JW, Boudreau A, Hardenbol P, Leal SM, Pasternak S, Wheeler DA, Willis TD, Yu F, Yang H, Zeng C, Gao Y, Hu H, Hu W, Li C et al (2007) A second generation human haplotype map of over 3.1 million SNPs. Nature 449: 851–861
Google Scholar - Fuhrmann C, Schmidt‐Kittler O, Stoecklein NH, Petat‐Dutter K, Vay C, Bockler K, Reinhardt R, Ragg T, Klein CA (2008) High‐resolution array comparative genomic hybridization of single micrometastatic tumor cells. Nucleic Acids Res 36: e39
Google Scholar - Fujimoto A, Totoki Y, Abe T, Boroevich KA, Hosoda F, Nguyen HH, Aoki M, Hosono N, Kubo M, Miya F, Arai Y, Takahashi H, Shirakihara T, Nagasaki M, Shibuya T, Nakano K, Watanabe‐Makino K, Tanaka H, Nakamura H, Kusuda J et al (2012) Whole‐genome sequencing of liver cancers identifies etiological influences on mutation patterns and recurrent mutations in chromatin regulators. Nat Genet 44: 760–764
Google Scholar - Fullwood MJ, Han Y, Wei C‐L, Ruan X, Ruan Y (2010) Chromatin interaction analysis using paired‐end tag sequencing. In Current Protocols in Molecular Biology Ausubel Frederick M (ed) Chapter 21: 25
- Fullwood MJ, Liu MH, Pan YF, Liu J, Xu H, Bin Mohamed Y, Orlov YL, Velkov S, Ho A, Mei PH, Chew EGY, Huang PYH, Welboren W‐J, Han Y, Ooi HS, Ariyaratne PN, Vega VB, Luo Y, Tan PY, Choy PY et al (2009a) An oestrogen‐receptor‐alpha‐bound human chromatin interactome. Nature 462: 58–64
Google Scholar - Fullwood MJ, Wei C‐L, Liu ET, Ruan Y (2009b) Next‐generation DNA sequencing of paired‐end tags (PET) for transcriptome and genome analyses. Genome Res 19: 521–532
Google Scholar - Fullwood MJ, Wei CL, Liu ET, Ruan Y (2009c) Next‐generation DNA sequencing of paired‐end tags (PET) for transcriptome and genome analyses. Genome Res 19: 521–532
Google Scholar - Gage FH, Verma IM (2003) Stem cells at the dawn of the 21st centurym ‐ Introduction. Proc Natl Acad Sci USA 100: 11817–11818
Google Scholar - Gerstein MB, Lu ZJ, Van Nostrand EL, Cheng C, Arshinoff BI, Liu T, Yip KY, Robilotto R, Rechtsteiner A, Ikegami K, Alves P, Chateigner A, Perry M, Morris M, Auerbach RK, Feng X, Leng J, Vielle A, Niu W, Rhrissorrakrai K et al (2010) Integrative analysis of the Caenorhabditis elegans genome by the modENCODE project. Science 330: 1775–1787
Google Scholar - Giresi PG, Kim J, McDaniell RM, Iyer VR, Lieb JD (2007) FAIRE (formaldehyde‐assisted isolation of regulatory elements) isolates active regulatory elements from human chromatin. Genome Res 17: 877–885
Google Scholar - Glogovac JK, Porter PL, Banker DE, Rabinovitch PS (1996) Cytokeratin labeling of breast cancer cells extracted from paraffin‐embedded tissue for bivariate flow cytometric analysis. Cytometry 24: 260–267
Google Scholar - Gonzaga‐Jauregui C, Lupski JR, Gibbs RA (2012) Human Genome Sequencing in Health and Disease. Annu Rev Med 63: 35–61
Google Scholar - Gonzalez E, Kulkarni H, Bolivar H, Mangano A, Sanchez R, Catano G, Nibbs RJ, Freedman BI, Quinones MP, Bamshad MJ, Murthy KK, Rovin BH, Bradley W, Clark RA, Anderson SA, O'Connell R J, Agan BK, Ahuja SS, Bologna R, Sen L et al (2005) The influence of CCL3L1 gene‐containing segmental duplications on HIV‐1/AIDS susceptibility. Science 307: 1434–1440
Google Scholar - Gretarsdottir S, Thorleifsson G, Reynisdottir ST, Manolescu A, Jonsdottir S, Jonsdottir T, Gudmundsdottir T, Bjarnadottir SM, Einarsson OB, Gudjonsdottir HM, Hawkins M, Gudmundsson G, Gudmundsdottir H, Andrason H, Gudmundsdottir AS, Sigurdardottir M, Chou TT, Nahmias J, Goss S, Sveinbjornsdottir S et al (2003) The gene encoding phosphodiesterase 4D confers risk of ischemic stroke. Nat Genet 35: 131–138
Google Scholar - Guo G, Huss M, Tong GQ, Wang C, Li Sun L, Clarke ND, Robson P (2010) Resolution of cell fate decisions revealed by single‐cell gene expression analysis from zygote to blastocyst. Dev Cell 18: 675–685
Google Scholar - Handoko L, Xu H, Li G, Ngan CY, Chew E, Schnapp M, Lee CWH, Ye C, Ping JLH, Mulawadi F, Wong E, Sheng J, Zhang Y, Poh T, Chan CS, Kunarso G, Shahab A, Bourque G, Cacheux‐Rataboul V, Sung W‐K et al (2011) CTCF‐mediated functional chromatin interactome in pluripotent cells. Nat Genet 43: 630–U198
Google Scholar - Hannemann J, Meyer‐Staeckling S, Kemming D, Alpers I, Joosse SA, Pospisil H, Kurtz S, Goerndt J, Pueschel K, Riethdorf S, Pantel K, Brandt B (2011) Quantitative high‐resolution genomic analysis of single cancer cells. Plos One 6: e26362
Google Scholar - Harismendy O, Notani D, Song X, Rahim NG, Tanasa B, Heintzman N, Ren B, Fu XD, Topol EJ, Rosenfeld MG, Frazer KA (2011) 9p21 DNA variants associated with coronary artery disease impair interferon‐gamma signalling response. Nature 470: 264–268
Google Scholar - Heppner GH (1984) Tumor heterogeneity. Cancer Res 44: 2259–2265
Google Scholar - Hesselberth JR, Chen X, Zhang Z, Sabo PJ, Sandstrom R, Reynolds AP, Thurman RE, Neph S, Kuehn MS, Noble WS, Fields S, Stamatoyannopoulos JA (2009) Global mapping of protein‐DNA interactions in vivo by digital genomic footprinting. Nat Methods 6: 283–289
Google Scholar - Hillmer AM, Yao F, Inaki K, Lee WH, Ariyaratne PN, Teo ASM, Woo XY, Zhang Z, Zhao H, Chen JP, Zhu F, So JBY, Salto‐Tellez M, Poh WT, Zawack KFB, Nagarajan N, Gao S, Li G, Kumar V, Lim HPJ et al (2011) Comprehensive long‐span paired‐end‐tag mapping reveals characteristic patterns of structural variations in epithelial cancer genomes. Genome Res 21: 665–675
Google Scholar - Horak CE, Snyder M (2002) ChIP‐chip: a genomic approach for identifying transcription factor binding sites. Methods Enzymol 350: 469–483
Google Scholar - Horikawa Y, Oda N, Cox NJ, Li X, Orho‐Melander M, Hara M, Hinokio Y, Lindner TH, Mashima H, Schwarz PE, del Bosque‐Plata L, Oda Y, Yoshiuchi I, Colilla S, Polonsky KS, Wei S, Concannon P, Iwasaki N, Schulze J, Baier LJ et al (2000) Genetic variation in the gene encoding calpain‐10 is associated with type 2 diabetes mellitus. Nat Genet 26: 163–175
Google Scholar - Hou Y, Song L, Zhu P, Zhang B, Tao Y, Xu X, Li F, Wu K, Liang J, Shao D, Wu H, Ye X, Ye C, Wu R, Jian M, Chen Y, Xie W, Zhang R, Chen L, Liu X et al (2012) Single‐cell exome sequencing and monoclonal evolution of a JAK2‐negative myeloproliferative neoplasm. Cell 148: 873–885
Google Scholar - Inaki K, Hillmer AM, Ukil L, Yao F, Woo XY, Vardy LA, Zawack KFB, Lee CWH, Ariyaratne PN, Chan YS, Desai KV, Bergh J, Hall P, Putti TC, Ong WL, Shahab A, Cacheux‐Rataboul V, Karuturi RKM, Sung W‐K, Ruan X et al (2011) Transcriptional consequences of genomic structural aberrations in breast cancer. Genome Res 21: 676–687
Google Scholar - Ingolia NT, Ghaemmaghami S, Newman JR, Weissman JS (2009) Genome‐wide analysis in vivo of translation with nucleotide resolution using ribosome profiling. Science 324: 218–223
Google Scholar - Iyer VR, Horak CE, Scafe CS, Botstein D, Snyder M, Brown PO (2001) Genomic binding sites of the yeast cell‐cycle transcription factors SBF and MBF. Nature 409: 533–538
Google Scholar - Johnson DS, Mortazavi A, Myers RM, Wold B (2007) Genome‐wide mapping of in vivo protein‐DNA interactions. Science 316: 1497–1502
Google Scholar - Kasowski M, Grubert F, Heffelfinger C, Hariharan M, Asabere A, Waszak SM, Habegger L, Rozowsky J, Shi M, Urban AE, Hong MY, Karczewski KJ, Huber W, Weissman SM, Gerstein MB, Korbel JO, Snyder M (2010) Variation in transcription factor binding among humans. Science 328: 232–235
Google Scholar - Kidd JM, Graves T, Newman TL, Fulton R, Hayden HS, Malig M, Kallicki J, Kaul R, Wilson RK, Eichler EE (2010) A human genome structural variation sequencing resource reveals insights into mutational mechanisms. Cell 143: 837–847
Google Scholar - Kloosterman WP, Hoogstraat M, Paling O, Tavakoli‐Yaraki M, Renkens I, Vermaat JS, van Roosmalen MJ, van Lieshout S, Nijman IJ, Roessingh W, van't Slot R, van de Belt J, Guryev V, Koudijs M, Voest E, Cuppen E (2011) Chromothripsis is a common mechanism driving genomic rearrangements in primary and metastatic colorectal cancer. Genome Biol 12: R103
Google Scholar - Kodzius R, Kojima M, Nishiyori H, Nakamura M, Fukuda S, Tagami M, Sasaki D, Imamura K, Kai C, Harbers M, Hayashizaki Y, Carninci P (2006) CAGE: cap analysis of gene expression. Nat Methods 3: 211–222
Google Scholar - Korbel JO, Urban AE, Affourtit JP, Godwin B, Grubert F, Simons JF, Kim PM, Palejev D, Carriero NJ, Du L, Taillon BE, Chen Z, Tanzer A, Saunders ACE, Chi J, Yang F, Carter NP, Hurles ME, Weissman SM, Harkins TT et al (2007) Paired‐end mapping reveals extensive structural variation in the human genome. Science 318: 420–426
Google Scholar - Kumar A, White TA, MacKenzie AP, Clegg N, Lee C, Dumpit RF, Coleman I, Ng SB, Salipante SJ, Rieder MJ, Nickerson DA, Corey E, Lange PH, Morrissey C, Vessella RL, Nelson PS, Shendure J (2011) Exome sequencing identifies a spectrum of mutation frequencies in advanced and lethal prostate cancers. Proc Natl Acad Sci USA 108: 17087–17092
Google Scholar - Lam HY, Clark MJ, Chen R, Natsoulis G, O'Huallachain M, Dewey FE, Habegger L, Ashley EA, Gerstein MB, Butte AJ, Ji HP, Snyder M (2012) Performance comparison of whole‐genome sequencing platforms. Nat Biotechnol 30: 562
Google Scholar - Le Caignec C, Spits C, Sermon K, De Rycke M, Thienpont B, Debrock S, Staessen C, Moreau Y, Fryns JP, Van Steirteghem A, Liebaers I, Vermeesch JR (2006) Single‐cell chromosomal imbalances detection by array CGH. Nucleic Acids Res 34: e68
Google Scholar - Li E, Beard C, Jaenisch R (1993) Role for DNA methylation in genomic imprinting. Nature 366: 362–365
Google Scholar - Li G, Ruan X, Auerbach RK, Sandhu KS, Zheng M, Wang P, Poh HM, Goh Y, Lim J, Zhang J, Sim HS, Peh SQ, Mulawadi FH, Ong CT, Orlov YL, Hong S, Zhang Z, Landt S, Raha D, Euskirchen G et al (2012) Extensive promoter‐centered chromatin interactions provide a topological basis for transcription regulation. Cell 148: 84–98
Google Scholar - Li JB, Levanon EY, Yoon JK, Aach J, Xie B, Leproust E, Zhang K, Gao Y, Church GM (2009) Genome‐wide identification of human RNA editing sites by parallel DNA capturing and sequencing. Science 324: 1210–1213
Google Scholar - Lieberman‐Aiden E, van Berkum NL, Williams L, Imakaev M, Ragoczy T, Telling A, Amit I, Lajoie BR, Sabo PJ, Dorschner MO, Sandstrom R, Bernstein B, Bender MA, Groudine M, Gnirke A, Stamatoyannopoulos J, Mirny LA, Lander ES, Dekker J (2009) Comprehensive mapping of long‐range interactions reveals folding principles of the human genome. Science 326: 289–293
Google Scholar - Lien K‐Y, Chuang Y‐H, Hung L‐Y, Hsu K‐F, Lai W‐W, Ho C‐L, Chou C‐Y, Lee G‐B (2010) Rapid isolation and detection of cancer cells by utilizing integrated microfluidic systems. Lab Chip 10: 2875–2886
Google Scholar - Lister R, Pelizzola M, Dowen RH, Hawkins RD, Hon G, Tonti‐Filippini J, Nery JR, Lee L, Ye Z, Ngo QM, Edsall L, Antosiewicz‐Bourget J, Stewart R, Ruotti V, Millar AH, Thomson JA, Ren B, Ecker JR (2009) Human DNA methylomes at base resolution show widespread epigenomic differences. Nature 462: 315–322
Google Scholar - Louie E, Ott J, Majewski J (2003) Nucleotide frequency variation across human genes. Genome Res 13: 2594–2601
Google Scholar - Lynch HT, Weisenburger DD, Quinn‐Laquer B, Watson P, Lynch JF, Sanger WG (2002) Hereditary chronic lymphocytic leukemia: an extended family study and literature review. Am J Med Genet 115: 113–117
Google Scholar - Maheshri N, O'Shea EK (2007) Living with noisy genes: how cells function reliably with inherent variability in gene expression. Annu Rev Biophys Biomol Struct 36: 413–434
Google Scholar - Mailman MD, Feolo M, Jin Y, Kimura M, Tryka K, Bagoutdinov R, Hao L, Kiang A, Paschall J, Phan L, Popova N, Pretel S, Ziyabari L, Lee M, Shao Y, Wang ZY, Sirotkin K, Ward M, Kholodov M, Zbicz K et al (2007) The NCBI dbGaP database of genotypes and phenotypes. Nat Genet 39: 1181–1186
Google Scholar - Mark HFL, Rehan J, Mark S, Santoro K, Zolnierz K (1998) Fluorescence in situ hybridization analysis of single‐cell trisomies for determination of clonality. Cancer Genet Cytogenet 102: 1–5
Google Scholar - Marusyk A, Polyak K (2010) Tumor heterogeneity: causes and consequences. Biochim Biophys Acta‐Rev Cancer 1805: 105–117
Google Scholar - McCarroll SA, Huett A, Kuballa P, Chilewski SD, Landry A, Goyette P, Zody MC, Hall JL, Brant SR, Cho JH, Duerr RH, Silverberg MS, Taylor KD, Rioux JD, Altshuler D, Daly MJ, Xavier RJ (2008) Deletion polymorphism upstream of IRGM associated with altered IRGM expression and Crohn's disease. Nat Genet 40: 1107–1112
Google Scholar - Meissner A, Gnirke A, Bell GW, Ramsahoye B, Lander ES, Jaenisch R (2005) Reduced representation bisulfite sequencing for comparative high‐resolution DNA methylation analysis. Nucleic Acids Res 33: 5868–5877
Google Scholar - Metzker ML (2008) Advances in Next‐Generation DNA Sequencing Technologies
- Metzker ML (2010) Applications of next‐generation sequencing. Sequencing technologies ‐ the next generation. Nat Rev Genet 11: 31–46
Google Scholar - Miller C, Schwalb B, Maier K, Schulz D, Dumcke S, Zacher B, Mayer A, Sydow J, Marcinowski L, Dolken L, Martin DE, Tresch A, Cramer P (2011) Dynamic transcriptome analysis measures rates of mRNA synthesis and decay in yeast. Mol Syst Biol 7: 458
Google Scholar - Mortazavi A, Williams BA, McCue K, Schaeffer L, Wold B (2008) Mapping and quantifying mammalian transcriptomes by RNA‐Seq. Nat Methods 5: 621–628
Google Scholar - Nagalakshmi U, Wang Z, Waern K, Shou C, Raha D, Gerstein M, Snyder M (2008) The transcriptional landscape of the yeast genome defined by RNA sequencing. Science 320: 1344–1349
Google Scholar - Nammo T, Rodriguez‐Segui SA, Ferrer J (2011) Mapping open chromatin with formaldehyde‐assisted isolation of regulatory elements. Methods Mol Biol 791: 287–296
Google Scholar - Navin N, Kendall J, Troge J, Andrews P, Rodgers L, McIndoo J, Cook K, Stepansky A, Levy D, Esposito D, Muthuswamy L, Krasnitz A, McCombie WR, Hicks J, Wigler M (2011) Tumour evolution inferred by single‐cell sequencing. Nature 472: 90–94
Google Scholar - Newell‐Price J, Clark AJ, King P (2000) DNA methylation and silencing of gene expression. Trends Endocrinol Metab 11: 142–148
Google Scholar - Ng P, Wei C‐L, Ruan Y (2007) Paired‐end diTagging for transcriptome and genome analysis. In Current Protocols in Molecular Biology Ausubel Frederick M (ed), Chapter 21 Hoboken, NJ, USA: John Wiley and Sons, Inc.,
- Ng P, Wei CL, Sung WK, Chiu KP, Lipovich L, Ang CC, Gupta S, Shahab A, Ridwan A, Wong CH, Liu ET, Ruan Y (2005) Gene identification signature (GIS) analysis for transcriptome characterization and genome annotation. Nat Methods 2: 105–111
Google Scholar - Ng S, Buckingham K, Lee C, Bigham AW, Tabor HK, Dent KM, Huff CD, Shannon PT, Jabs EW, Nickerson DA, Shendure J, Bamshad MJ (2010) Exome sequencing identifies the cause of a mendelian disorder. Nat Genet 42: 30–35
Google Scholar - Nik‐Zainal S, Alexandrov Ludmil B, Wedge David C, Van Loo P, Greenman Christopher D, Raine K, Jones D, Hinton J, Marshall J, Stebbings Lucy A, Menzies A, Martin S, Leung K, Chen L, Leroy C, Ramakrishna M, Rance R, Lau King W, Mudie Laura J, Varela I et al (2012a) Mutational processes molding the genomes of 21 breast cancers. Cell 149: 979–993
Google Scholar - Nik‐Zainal S, Van Loo P, Wedge David C, Alexandrov Ludmil B, Greenman Christopher D, Lau King W, Raine K, Jones D, Marshall J, Ramakrishna M, Shlien A, Cooke Susanna L, Hinton J, Menzies A, Stebbings Lucy A, Leroy C, Jia M, Rance R, Mudie Laura J, Gamble Stephen J et al (2012b) The life history of 21 breast cancers. Cell 149: 994–1007
Google Scholar - Nowell PC (1976) Clonal evolution of tumor‐cell populations. Science 194: 23–28
Google Scholar - O'Flaherty JD, Gray S, Richard D, Fennell D, O'Leary JJ, Blackhall FH, O'Byrne KJ (2012) Circulating tumour cells, their role in metastasis and their clinical utility in lung cancer. Lung Cancer 76: 19–25
Google Scholar - Osborne CS, Eskiw CH (2008) Where shall we meet? A role for genome organisation and nuclear sub‐compartments in mediating interchromosomal interactions. J Cell Biochem 104: 1553–1561
Google Scholar - Pagani I, Liolios K, Jansson J, Chen IM, Smirnova T, Nosrat B, Markowitz VM, Kyrpides NC (2012) The Genomes OnLine Database (GOLD) v.4: status of genomic and metagenomic projects and their associated metadata. Nucleic Acids Res 40: D571–D579
- Pareek CS, Smoczynski R, Tretyn A (2011) Sequencing technologies and genome sequencing. J Appl Genet 52: 413–435
Google Scholar - Park JH, Jung Y, Kim TY, Kim SG, Jong HS, Lee JW, Kim DK, Lee JS, Kim NK, Bang YJ (2004) Class I histone deacetylase‐selective novel synthetic inhibitors potently inhibit human tumor proliferation. Clin Cancer Res 10: 5271–5281
Google Scholar - Pelkmans L (2012) Using cell‐to‐cell variability—a new era in molecular biology. Science 336: 425–426
Google Scholar - Prensner JR, Iyer MK, Balbin OA, Dhanasekaran SM, Cao Q, Brenner JC, Laxman B, Asangani IA, Grasso CS, Kominsky HD, Cao X, Jing X, Wang X, Siddiqui J, Wei JT, Robinson D, Iyer HK, Palanisamy N, Maher CA, Chinnaiyan AM (2011) Transcriptome sequencing across a prostate cancer cohort identifies PCAT‐1, an unannotated lincRNA implicated in disease progression. Nat Biotech 29: 742–749
Google Scholar - Raj A, van Oudenaarden A (2008) Nature, nurture, or chance: stochastic gene expression and its consequences. Cell 135: 216–226
Google Scholar - Rausch T, Jones David TW, Zapatka M, Stütz Adrian M, Zichner T, Weischenfeldt J, Jäger N, Remke M, Shih D, Northcott Paul A, Pfaff E, Tica J, Wang Q, Massimi L, Witt H, Bender S, Pleier S, Cin H, Hawkins C, Beck C et al (2012) Genome sequencing of pediatric medulloblastoma links catastrophic dna rearrangements with TP53 mutations. Cell 148: 59–71
Google Scholar - Redon R, Ishikawa S, Fitch KR, Feuk L, Perry GH, Andrews TD, Fiegler H, Shapero MH, Carson AR, Chen W, Cho EK, Dallaire S, Freeman JL, Gonzalez JR, Gratacos M, Huang J, Kalaitzopoulos D, Komura D, MacDonald JR, Marshall CR et al (2006) Global variation in copy number in the human genome. Nature 444: 444–454
Google Scholar - Reik W (2007) Stability and flexibility of epigenetic gene regulation in mammalian development. Nature 447: 425–432
Google Scholar - Robertson G, Hirst M, Bainbridge M, Bilenky M, Zhao Y, Zeng T, Euskirchen G, Bernier B, Varhol R, Delaney A, Thiessen N, Griffith OL, He A, Marra M, Snyder M, Jones S (2007) Genome‐wide profiles of STAT1 DNA association using chromatin immunoprecipitation and massively parallel sequencing. Nat Methods 4: 651–657
Google Scholar - Rozowsky J, Abyzov A, Wang J, Alves P, Raha D, Harmanci A, Leng J, Bjornson R, Kong Y, Kitabayashi N, Bhardwaj N, Rubin M, Snyder M, Gerstein M (2011) AlleleSeq: analysis of allele‐specific expression and binding in a network framework. Mol Syst Biol 7: 522
Google Scholar - Sachs K, Perez O, Pe'er D, Lauffenburger DA, Nolan GP (2005) Causal protein‐signaling networks derived from multiparameter single‐cell data. Science 308: 523–529
Google Scholar - Salzman J, Marinelli RJ, Wang PL, Green AE, Nielsen JS, Nelson BH, Drescher CW, Brown PO (2011) ESRRA‐C11orf20 is a recurrent gene fusion in serous ovarian carcinoma. PLoS Biol 9: e1001156
Google Scholar - Sanger F, Nicklen S, Coulson AR (1977) DNA sequencing with chain‐terminating inhibitors. Proc Natl Acad Sci USA 74: 5463–5467
Google Scholar - Schubert C (2011) Technology feature the deepest differences. Nature 480: 133–137
Google Scholar - Schuster SC (2008) Next‐generation sequencing transforms today's biology. Nat Methods 5: 16–18
Google Scholar - Seligson DB, Horvath S, Shi T, Yu H, Tze S, Grunstein M, Kurdistani SK (2005) Global histone modification patterns predict risk of prostate cancer recurrence. Nature 435: 1262–1266
Google Scholar - Silverman LR, Demakos EP, Peterson BL, Kornblith AB, Holland JC, Odchimar‐Reissig R, Stone RM, Nelson D, Powell BL, DeCastro CM, Ellerton J, Larson RA, Schiffer CA, Holland JF (2002) Randomized controlled trial of azacitidine in patients with the myelodysplastic syndrome: a study of the cancer and leukemia group B. J Clin Oncol 20: 2429–2440
Google Scholar - Simonis M, Klous P, Splinter E, Moshkin Y, Willemsen R, de Wit E, van Steensel B, de Laat W (2006) Nuclear organization of active and inactive chromatin domains uncovered by chromosome conformation capture‐on‐chip (4C). Nat Genet 38: 1348–1354
Google Scholar - Smith MG, Gianoulis TA, Pukatzki S, Mekalanos JJ, Ornston LN, Gerstein M, Snyder M (2007) New insights into Acinetobacter baumannii pathogenesis revealed by high‐density pyrosequencing and transposon mutagenesis. Genes Dev 21: 601–614
Google Scholar - Smith ZD, Gu H, Bock C, Gnirke A, Meissner A (2009) High‐throughput bisulfite sequencing in mammalian genomes. Methods 48: 226–232
Google Scholar - Snijder B, Sacher R, Ramo P, Damm E‐M, Liberali P, Pelkmans L (2009) Population context determines cell‐to‐cell variability in endocytosis and virus infection. Nature 461: 520–523
Google Scholar - Snyder M, Du J, Gerstein M (2010) Personal genome sequencing: current approaches and challenges. Genes Dev 24: 423–431
Google Scholar - Stamatoyannopoulos JA, Snyder M, Hardison R, Ren B, Gingeras T, Gilbert DM, Groudine M, Bender M, Kaul R, Canfield T, Giste E, Johnson A, Zhang M, Balasundaram G, Byron R, Roach V, Sabo PJ, Sandstrom R, Stehling AS, Thurman RE et al (2012) An encyclopedia of mouse DNA elements (Mouse ENCODE). Genome Biol 13: 418
Google Scholar - Stephens PJ, Greenman CD, Fu B, Yang F, Bignell GR, Mudie LJ, Pleasance ED, Lau KW, Beare D, Stebbings LA, McLaren S, Lin M‐L, McBride DJ, Varela I, Nik‐Zainal S, Leroy C, Jia M, Menzies A, Butler AP, Teague JW et al (2011) Massive genomic rearrangement acquired in a single catastrophic event during cancer development.. Cell 144: 27–40
Google Scholar - Stratton MR, Campbell PJ, Futreal PA (2009) The cancer genome. Nature 458: 719–724
Google Scholar - Sung MH, Hager GL (2011) More to Hi‐C than meets the eye. Nat Genet 43: 1047–1048
Google Scholar - Sylvester KG, Longaker MT (2004) Stem cells ‐ review and update. Arch Surg 139: 93–99
Google Scholar - Taiwo O, Wilson GA, Morris T, Seisenberger S, Reik W, Pearce D, Beck S, Butcher LM (2012) Methylome analysis using MeDIP‐seq with low DNA concentrations. Nat Protoc 7: 617–636
Google Scholar - Tang F, Barbacioru C, Wang Y, Nordman E, Lee C, Xu N, Wang X, Bodeau J, Tuch BB, Siddiqui A, Lao K, Surani MA (2009) mRNA‐Seq whole‐transcriptome analysis of a single cell. Nat Meth 6: 377–382
Google Scholar - Tester DJ, Ackerman MJ (2011) Genetic testing for potentially lethal, highly treatable inherited cardiomyopathies/channelopathies in clinical practice. Circulation 123: 1021–1037
Google Scholar - Tubio JMC, Estivill X (2011) Cancer: when catastrophe strikes a cell. Nature 470: 476–477
Google Scholar - Tuch BB, Laborde RR, Xu X, Gu J, Chung CB, Monighetti CK, Stanley SJ, Olsen KD, Kasperbauer JL, Moore EJ, Broomer AJ, Tan R, Brzoska PM, Muller MW, Siddiqui AS, Asmann YW, Sun Y, Kuersten S, Barker MA, De La Vega FM et al (2010) Tumor transcriptome sequencing reveals allelic expression imbalances associated with copy number alterations. PLoS One 5: e9317
Google Scholar - Twine NA, Janitz K, Wilkins MR, Janitz M (2011) Whole transcriptome sequencing reveals gene expression and splicing differences in brain regions affected by Alzheimer's disease. PLoS One 6: e16266
Google Scholar - Valle L, Serena‐Acedo T, Liyanarachchi S, Hampel H, Comeras I, Li Z, Zeng Q, Zhang HT, Pennison MJ, Sadim M, Pasche B, Tanner SM, de la Chapelle A (2008) Germline allele‐specific expression of TGFBR1 confers an increased risk of colorectal cancer. Science 321: 1361–1365
Google Scholar - van Beijnum JR, Rousch M, Castermans K, van der Linden E, Griffioen AW (2008) Isolation of endothelial cells from fresh tissues. Nat Protoc 3: 1085–1091
Google Scholar - Waern K, Nagalakshmi U, Snyder M (2011) RNA sequencing. Methods Mol Biol 759: 125–132
Google Scholar - Wang D, Bodovitz S (2010) Single cell analysis: the new frontier in ‘omics’. Trends Biotech 28: 281–290
Google Scholar - Wang KC, Chang HY (2011) Molecular mechanisms of long noncoding RNAs. Mol Cell 43: 904–914
Google Scholar - Wang L, Tsutsumi S, Kawaguchi T, Nagasaki K, Tatsuno K, Yamamoto S, Sang F, Sonoda K, Sugawara M, Saiura A, Hirono S, Yamaue H, Miki Y, Isomura M, Totoki Y, Nagae G, Isagawa T, Ueda H, Murayama‐Hosokawa S, Shibata T et al (2012) Whole‐exome sequencing of human pancreatic cancers and characterization of genomic instability caused by MLH1 haploinsufficiency and complete deficiency. Genome Res 22: 208–219
Google Scholar - Wang Z, Zang C, Cui K, Schones DE, Barski A, Peng W, Zhao K (2009a) Genome‐wide mapping of HATs and HDACs reveals distinct functions in active and inactive genes. Cell 138: 1019–1031
Google Scholar - Wang Z, Zang C, Rosenfeld JA, Schones DE, Barski A, Cuddapah S, Cui K, Roh TY, Peng W, Zhang MQ, Zhao K (2008) Combinatorial patterns of histone acetylations and methylations in the human genome. Nat Genet 40: 897–903
Google Scholar - Wei X, Walia V, Lin JC, Teer JK, Prickett TD, Gartner J, Davis S, Stemke‐Hale K, Davies MA, Gershenwald JE, Robinson W, Robinson S, Rosenberg SA, Samuels Y (2011) Exome sequencing identifies GRIN2A as frequently mutated in melanoma. Nat Genet 43: 442–446
Google Scholar - Welch JS, Westervelt P, Ding L, Larson DE, Klco JM, Kulkarni S, Wallis J, Chen K, Payton JE, Fulton RS, Veizer J, Schmidt H, Vickery TL, Heath S, Watson MA, Tomasson MH, Link DC, Graubert TA, DiPersio JF, Mardis ER et al (2011) Use of whole‐genome sequencing to diagnose a cryptic fusion oncogene. JAMA 305: 1577–1584
Google Scholar - Wilhelm BT, Marguerat S, Goodhead I, Bahler J (2010) Defining transcribed regions using RNA‐seq. Nat Protoc 5: 255–266
Google Scholar - Woodcock CL (2006) Chromatin architecture. Curr Opin Struct Biol 16: 213–220
Google Scholar - Worthey EA, Mayer AN, Syverson GD, Helbling D, Bonacci BB, Decker B, Serpe JM, Dasu T, Tschannen MR, Veith RL, Basehore MJ, Broeckel U, Tomita‐Mitchell A, Arca MJ, Casper JT, Margolis DA, Bick DP, Hessner MJ, Routes JM, Verbsky JW et al (2011) Making a definitive diagnosis: successful clinical application of whole exome sequencing in a child with intractable inflammatory bowel disease. Genet Med 13: 255–262
Google Scholar - Wu JQ, Habegger L, Noisa P, Szekely A, Qiu C, Hutchison S, Raha D, Egholm M, Lin H, Weissman S, Cui W, Gerstein M, Snyder M (2010) Dynamic transcriptomes during neural differentiation of human embryonic stem cells revealed by short, long, and paired‐end sequencing. Proc Natl Acad Sci USA 107: 5254–5259
Google Scholar - Xia J, Chen X, Zhou CZ, Li YG, Peng ZH (2011) Development of a low‐cost magnetic microfluidic chip for circulating tumour cell capture. Iet Nanobiotechnol 5: 114–120
Google Scholar - Xu X, Hou Y, Yin X, Bao L, Tang A, Song L, Li F, Tsang S, Wu K, Wu H, He W, Zeng L, Xing M, Wu R, Jiang H, Liu X, Cao D, Guo G, Hu X, Gui Y et al (2012) Single‐cell exome sequencing reveals single‐nucleotide mutation characteristics of a kidney tumor. Cell 148: 886–895
Google Scholar - Zang ZJ, Cutcutache I, Poon SL, Zhang SL, McPherson JR, Tao J, Rajasegaran V, Heng HL, Deng N, Gan A, Lim KH, Ong CK, Huang D, Chin SY, Tan IB, Ng CCY, Yu W, Wu Y, Lee M, Wu J et al (2012) Exome sequencing of gastric adenocarcinoma identifies recurrent somatic mutations in cell adhesion and chromatin remodeling genes. Nat Genet 44: 570–574
Google Scholar - Zhang K, Li JB, Gao Y, Egli D, Xie B, Deng J, Li Z, Lee JH, Aach J, Leproust EM, Eggan K, Church GM (2009) Digital RNA allelotyping reveals tissue‐specific and allele‐specific gene expression in human. Nat Methods 6: 613–618
Google Scholar - Zhang W, Cui H, Wong LJC (2012a) Application of next generation sequencing to molecular diagnosis of inherited diseases. Top Curr Chem; e‐pub ahead of print 11 May 2012; doi:10.1007/128_2012_325
- Zhang Y, McCord RP, Ho YJ, Lajoie BR, Hildebrand DG, Simon AC, Becker MS, Alt FW, Dekker J (2012b) Spatial organization of the mouse genome and its role in recurrent chromosomal translocations. Cell 148: 908–921
Google Scholar - Zhang Z, Du J, Lam H, Abyzov A, Urban A, Snyder M, Gerstein M (2011) Identification of genomic indels and structural variations using split reads. BMC Genomics 12: 375
Google Scholar - Zhao Z, Tavoosidana G, Sjolinder M, Gondor A, Mariano P, Wang S, Kanduri C, Lezcano M, Singh Sandhu K, Singh U, Pant V, Tiwari V, Kurukuti S, Ohlsson R (2006) Circular chromosome conformation capture (4C) uncovers extensive networks of epigenetically regulated intra‐ and interchromosomal interactions. Nat Genet 38: 1341–1347
Google Scholar - Wang Z, Gerstein M, Snyder M (2009b) RNA‐seq: a revolutionary tool for transcriptomics. Nat Rev Genet 10: 57–63
Google Scholar