T-cell priming by dendritic cells in lymph nodes occurs in three distinct phases (original) (raw)
Naive T cells recirculate continually between the blood and LNs to search for antigen4. The intranodal encounter of a peptide–major histocompatibility complex (MHC) complex that is recognized by a T-cell antigen receptor (TCR) will only result in full-fledged T cell activation upon co-stimulation provided by mature DCs. These professional antigen-presenting cells collect antigens in peripheral tissues and migrate to LNs through lymph vessels. T-cell priming by DCs induces activation markers, cytokine secretion, and proliferation. Several reports have analysed the dynamics of T-cell–DC interactions in excised LNs, but the methods and results have been variable and it is unknown how the absence of lymph and blood flow or innervation influences T-cell–DC interactions1,2,3,5. There is therefore still no comprehensive description of what happens in a truly physiological setting when naive T cells enter LNs that contain antigen-presenting DCs.
We have used two-photon microscopy6 to study lymphocyte migration and interactions with DCs within popliteal LNs of anaesthetized mice. Our preparation preserved physiological blood and lymph flow7, whereas, in our hands, lymph flow was compromised when we attempted to adapt the well-established inguinal lymph-node preparation to two-photon imaging8,9 (not shown). Recipient mice received footpad injections of fluorescent DCs, which entered lymph vessels and accumulated in the popliteal LN during the following day. Differentially tagged TCR transgenic CD8+T cells were injected intravenously 18 h later (Fig. 1a). T cells homed rapidly through high endothelial venules (HEVs) into popliteal LNs7, where they constituted 1–2% of all CD8+ cells 2 h after injection. At this point, further lymphocyte homing was blocked by the injection of anti-L-selectin10. This ensured that all imaged T cells had entered popliteal LNs during the initial 2-h window and enabled us to study synchronized resident cells during the subsequent 2 days.
Figure 1: Surface phenotype and migratory properties of DCs in popliteal LNs.
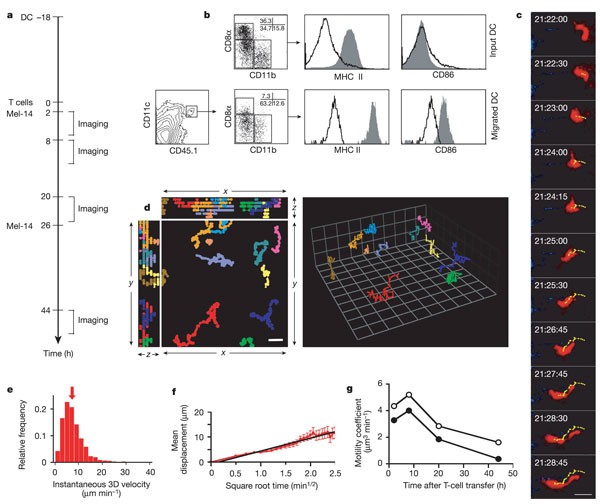
a, Experimental protocol. Antigen-pulsed or unpulsed DCs were injected into recipient footpads 18 h before adoptive transfer of T cells. Animals received anti-L-selectin monoclonal antibody Mel-14 2 h and 26 h later, and popliteal LNs were imaged at different times thereafter. b–f, Data from unpulsed DCs at 2–3 h after T-cell injection. b, CD11c+CD45.1+ donor DCs were examined by flow cytometry before injection into the footpad of CD45.2+ recipients (input DC) and after their migration into LNs (migrated DC) for subset composition (CD8α, CD11b) and maturation state (MHC class II, CD86). c, Intravital two-photon micrographs of a representative intranodal CMTMR-labelled DC (see also Supplementary Information 5). The migratory path of the DC was illustrated by tracking the 3D centroid (yellow dots) in successive image stacks. Time after DC injection is shown. The mean 3D velocity of this cell was 8.4 µm min-1. Scale bar, 20 µm. d, Representative tracks of migrating DCs depicted in x_–_y, x_–_z and y_–_z views (left; scale bar, 20 µm) and displayed in 3D (right; grid squares are 20.6 µm × 20.6 µm). e, Frequency histograms of 3D instantaneous velocities (n = 840). Arrow indicates median (6.6 µm min-1). f, Mean displacement plot for DCs shown in e. The straight line denotes the regression function of the initial, linear segment of curve (_r_2 = 0.95). The motility coefficient M was calculated from the slope of the regression line as M = x_2/6_t, where x is the displacement at time t (ref. 2), and was 4.35 µm3 min-1. g, Time course of motility coefficients for unpulsed (open circles) and antigen-pulsed (filled circles) DCs.
Initially, we examined the phenotype of injected DCs that migrated to draining LNs (Fig. 1b). Immature splenic CD11c+ DCs from CD45.1+ donors were injected into CD45.2+ congenic recipients. Because immature DCs express little or no CCR7—a chemokine receptor required for DC migration into lymphatics and within LNs11—we co-injected lipopolysaccharide (LPS; 10 ng), which induces DC maturation and CCR7 expression12. Consequently, DCs recovered from popliteal LNs were mature and either CD11b+CD8α- or CD11b-CD8αlow/-. CD8αhigh input DCs were rarely detected in LNs. This might reflect an inability of CD8αhigh DCs to migrate to LNs, or the downregulation of CD8α during transit.
To examine DCs in situ, we administered footpad injections of red fluorescent DCs and analysed their behaviour within popliteal LNs. After 20 h a fraction of migrated DCs (about 20–50%) resided in the subcapsular sinus and the superficial cortex. The remainder congregated in distinct regions within the deep cortex, where they localized with homed T cells (Supplementary Fig. S1a). A reason for the non-uniform distribution of DCs in the T cell area became apparent after fluorescein isothiocyanate–dextran injection to delineate blood vessels. In line with recent observations13, many DCs lined up around HEVs in strategic positions to interact with newly homed T cells (Supplementary Fig. S1b; Supplementary Information 2, 3). This distribution pattern became less apparent at day 2 or 3 after injection (Supplementary Information 4).
One day after injection, DCs in T-cell areas were remarkably motile, whether they presented antigen to T cells or not (Fig. 1c–g; Supplementary Information 5). The median three-dimensional (3D) instantaneous velocity was 6.6 µm min-1 (Fig. 1e), which is in good agreement with measurements of two-dimensional velocities in explanted LNs3. Individual DCs followed random paths without apparent directional bias. Even sessile DCs constantly extended and retracted dendrites and pseudopods. The motility of both antigen-pulsed and control DCs was highest between 2 and 8 h after T-cell transfer (20–26 h after DC injection) and decreased over time (Fig. 1f, g; Supplementary Information 5). This progressive decrease in motility might reflect DC ‘exhaustion’, which has been proposed to occur after LPS activation14.
Migratory dynamics in LNs were closely dependent on physiological conditions: T cells and DCs stopped migrating and assumed a round shape within minutes after cardiovascular arrest (Supplementary Information 6), even with a tissue temperature maintained at 36 °C, a requirement for interstitial T-cell migration2. In living animals without DC injection, intranodal T cells moved rapidly, reaching peak 3D velocities of 40 µm min-1 (Fig. 2a–c; Supplementary Information 7). In LNs draining DC-injected footpads, 3D velocities were equivalent (Fig. 2c, d) but T cells turned at steeper angles and covered a smaller volume of the paracortex, resulting in decreased motility coefficients, even when DCs carried no antigen (Fig. 2e, f). Mean T-cell displacement plots in the antigen-containing LNs revealed a plateau at about 15 µm displacement (Fig. 2e), indicating confined motility15. Thus, DC plus LPS injections induced LN paracortex partitioning into smaller compartments in which incoming T cells were retained, perhaps owing to motility-attenuating mediators released by DCs and/or other cells, or adhesive contacts between T cells and intranodal structures or confined clusters of DCs16.
Figure 2: Effect of antigen on T-cell motility in LNs.
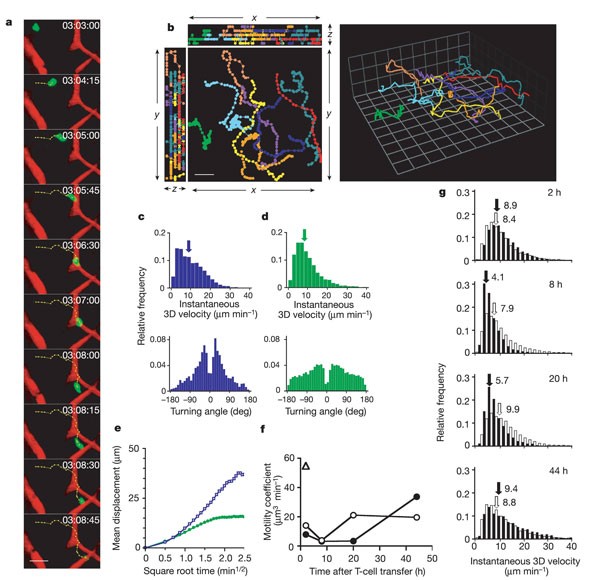
a, Intranodal T cell migrating between tetramethylrhodamine β-isothiocyanate–dextran-filled capillaries in the absence of transferred DCs (see also Supplementary Information 7). Scale bar, 20 µm. b, Two-dimensional (left; scale bar, 20 µm) and 3D (right; grid squares are 15.4 µm × 15.4 µm) depiction of representative T-cell tracks. c, d, Representative frequency histograms of 3D instantaneous velocities (upper panels) and turning angles (lower panels) of T cells migrating in the absence (c) or presence (d) of LPS-matured DCs. Arrows in the upper panels indicate medians (8.9 µm min-1 in c; 8.3 µm min-1 in d). e, Mean displacement plots of T cells in the absence (blue) or presence (green) of LPS-matured DCs in LNs. f, Time course of T-cell motility coefficients in the presence of control DCs (open circles) and antigen-bearing DCs (filled circles). Triangle denotes T-cell motility coefficient without DC injection. g, 3D instantaneous velocity histograms of T cells in representative LNs at various times after adoptive transfer in the presence of antigen-pulsed (filled bars) or control (open bars) DCs. Medians are indicated by arrows; values shown are in units of µm min-1.
To address the latter possibility, we examined T-cell migratory behaviour and the kinetics of T-cell–DC interactions in different LN areas. Superficial T cells (less than 100 µm below the capsule) were less motile than those in the deep T-cell area, whether DCs were injected or not. There was additional heterogeneity in the deep T-cell zone of LNs that drained DC injection sites; T cells in areas with high DC density were less motile than in DC-poor areas. We therefore analysed only regions that were more than 150 µm below the LN capsule and contained comparably high DC densities. Here, T-cell motility depended on the presence of antigen and T-cell dwell time (Fig. 2g). Although instantaneous 3D velocities remained constant in LNs that contained control DCs, T cells migrated more slowly after encountering antigen-bearing DCs for 8–20 h. In contrast, T-cell migration after antigen exposure for 2 or 44 h was similar to T-cell migration in the presence of control DCs.
When T cells encountered DCs shortly after homing (2–4 h after transfer), they formed predominantly brief contacts before detaching to interact with other DCs nearby (Fig. 3a–d; Supplementary Information 8). Contacts lasted slightly longer with antigen-loaded DCs (mean ± s.e.m. 5.9 ± 0.8 min; median 3.8 min) than with control DCs (4.1 ± 0.4 min; median 2.5 min; P < 0.05). At 5–8 h, contacts lasted noticeably longer (median 3.8 min without antigen; 7.3 min with antigen) but rarely exceeded 30 min (Fig. 3e). A marked change in T-cell–DC conjugation was apparent when LNs were imaged at 8–12 h (Supplementary Information 9). Most conjugates with antigen-presenting DCs lasted longer than 30 min (86%), and the majority (64%) remained stable throughout the 60 min observation period. We followed single conjugates over up to 3 h, indicating that these interactions can be sustained for a substantial period. Prolonged interactions were still apparent at 20–26 h, but about 70% of the contacts had returned to short encounter mode. One day later (44–48 h), T cells engaged in brief contacts only (Supplementary Information 4).
Figure 3: Progressive changes in T-cell–DC interaction dynamics indicate three phases of antigen recognition.
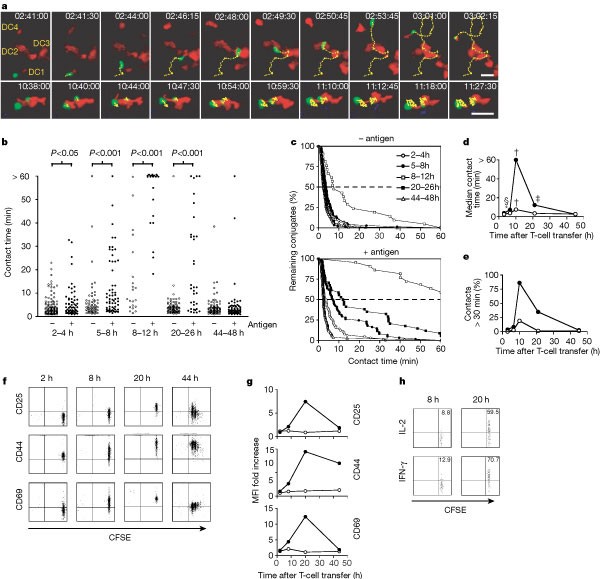
a, Upper row: a representative T cell (green) early after LN entry interacts sequentially with four different antigen-pulsed DCs (red). Yellow dots indicate tracks of the 3D centroid. Lower row: at more than 10 h after homing into the LN, two T cells are stably bound to an antigen-bearing DC. The time after T-cell transfer is shown in each panel. Scale bars, 20 µm. b, c, Absolute (b) and cumulative (c) contact duration between T cells and DCs in the presence and absence of antigen. d, Median contact time between T cells and DCs in the presence (filled circles) and absence (open circles) of antigen. Asterisk, P < 0.05 compared with 2 h; dagger, P < 0.05 compared with 2, 5, 20 and 44 h; double dagger, P < 0.05 compared with 44 h; section sign, P < 0.05 compared with 2 and 44 h. e, Frequency of T-cell–DC contacts lasting more than 30 min in the presence (filled circles) and absence (open circles) of antigen. f, Representative two-colour flow cytometry plots of CD25, CD44 and CD69 expression on CFSE-labelled T cells (gated on CD8+ MHC tetramer-positive) after different exposure times to antigen-presenting DCs. CFSE dilution indicates cell division. g, Time course of T-cell activation marker expression ratio in LNs containing antigen-pulsed (filled circles) or control (open circles) DCs versus contralateral LNs containing no DCs (set to 1). h, Stimulated secretion of IL-2 (top) and IFNγ (bottom) by gated P14 TCR-specific MHC-tetramer-positive T cells harvested from LNs containing antigen-presenting DCs at 8 h (left) or 20 h (right) after T-cell transfer.
These observations indicate that naive CD8 T cells interacted with antigen-presenting DCs in three sequential stages. Phase one constituted the first approximately 8 h after T-cell entry into LNs and was characterized by short encounters of rapidly migrating cells with numerous DCs, preferentially in the vicinity of HEVs. By contrast, in vitro stimulation of TCRs on T cells migrating on two-dimensional surfaces provides an immediate stop signal followed by assembly of the so-called supramolecular activation cluster or immunological synapse at the contact site17,18,19,20. The formation of mature synapses between naive T cells and antigen-presenting cells requires about 30 min (ref. 20). It is controversial whether and when immunological synapses form in vivo and whether they are required for T-cell activation. For example, T-cell–DC interactions in collagen matrices last only minutes but induce T-cell activation21. Given the short duration of contacts during phase one, it is unlikely that mature immunological synapses could have formed. Nevertheless, in contrast with LNs that did not receive DCs, T cells in DC-containing LNs upregulated CD44 and CD69 during the first 8 h (Fig. 3f, g). Thus, the brief interactions with DCs were sufficient for T-cell activation, at least at the level of these early activation markers. However, the interleukin (IL)-2 receptor, CD25, was only marginally increased, and isolated LN T cells did not spontaneously produce IL-2 or interferon (IFN)-γ after 8 h (not shown). Even when T cells were restimulated for 3 h, few cells secreted cytokines, and only at low levels (Fig. 3h).
Phase two lasted from about 8 h until about 24 h after T-cell transfer. This phase was dominated by T-cell–DC conjugates that remained stable for more than 1 h. The low T-cell velocities during this stage (Fig. 2g) reflect, in part, the slow migration of DCs that dragged interacting T cells along with them (Supplementary Information 10). Thus, active T-cell migration was even more depressed than was indicated by velocity measurements. Many T cells spontaneously produced IL-2 (18.6%) and IFN-γ (18.8%) at 20 h, and most secreted cytokines after brief restimulation (Fig. 3h). Almost all T cells expressed abundant activation markers, including CD25, but no cells had divided. The longevity of T-cell–DC interactions in phase two is consistent with the formation of a mature synapse-like contact zone20. Recent studies on CD4+ T-cell interactions with DCs in excised LNs found that at 23 h after T-cell transfer the sialomucin CD43 was excluded from the contact zone of interacting cells, implying the formation of a synapse-like interface1. However, this study imaged T cells in the superficial cortex where they formed only one-to-one associations with DCs. In the present analysis of the deep paracortex we frequently observed several T cells nestling against the same DC (Supplementary Information 9).
The formation of CD8+ T-cell clusters around single DCs was also detected in explanted LNs that were imaged 20 h after T-cell transfer3. Consistent with T-cell–DC behaviour during phase two in vivo was the observation that conjugates in excised LNs were stable, whereas interactions without antigen were short-lived3. Clustering of antigen-specific CD4+ T cells around DCs in LNs was also observed histologically22,23. Because these observations indicated that CD4+ and CD8+ T cells might behave similarly in vivo, we performed experiments with DO11.10 T cells expressing a MHC class-II restricted TCR24. T cells formed stable clusters with peptide-pulsed DCs when observed at 10 h, but engaged preferentially in short contacts at 3 and 47 h after injection (Supplementary Information 11), indicating that the three-phase model applies also to CD4+ T cells.
Phase three began 1 day after homing. T cells dissociated from DCs, migrated rapidly and proliferated vigorously. Dividing cells expressed less CD25 and CD69, but remained CD44high (Fig. 3g). Although it is likely that some T cells left the LN via efferent lymph vessels after day 2, the actual number of intranodal TCR transgenic cells expanded because T cells had divided up to five times during the preceding day and kept proliferating thereafter, resulting in the dilution of carboxyfluorescein succinimidyl ester (CFSE) to undetectable concentrations (not shown). T cells still engaged in brief contacts with DCs at 44–48 h, but the relevance of these interactions is uncertain, because it is possible that DCs retained little or no peptide antigen at this time point (more than 60 h after DC injection).
Even when DCs did not present antigen, T cells underwent prolonged interactions during the 8–12-h interval, whereas earlier and later contacts were short-lived (Fig. 3b, c). This indicates that recirculating T cells follow a three-phase itinerary by default when they survey lymphoid tissues. Without antigen, phase two is abbreviated, and although T-cell–DC contacts are shorter than in the presence of antigen, they are still longer than in phase one. T-cell contacts with control DCs did not result in detectable changes in activation markers (Fig. 3g) or cytokine production (not shown). Nevertheless, TCR signalling probably occurred, because naive T cells in LNs contain partly phosphorylated CD3ζ, even in the absence of antigen, whereas blood-borne T cells do not carry this indicator of early TCR signalling25. Antigen-independent TCR stimulation in LNs depends on self-MHC molecules and facilitates T-cell responses to foreign antigens25.
The intermittent period of antigen-independent, prolonged contacts might be indicative of physiological self-MHC recognition. If T cells fail to perceive an activating signal, even during this phase when they scrutinize DCs most intensely, they might be prompted to seek another lymphoid tissue. The frantic migration of T cells during phase three might signify their search for an exit into lymph sinuses. Indeed, most lymphocytes appear in thoracic duct lymph at 24–48 h after intravenous bolus injection4. Accordingly, we found that after anti-L-selectin treatment the number of homed T cells in LNs that did not contain antigen-pulsed DCs remained initially constant but there was a 60% decrease between 20 and 44 h (not shown). Recirculating lymphocytes therefore spend just enough time in LNs to go through all three phases before leaving through efferent lymphatics.
It will be important to determine the mechanisms that cause the transition from one phase to the next. Although this could involve changes in both T cells and DCs, several observations indicate that adaptive T-cell responses might be chiefly responsible. T-cell velocity and motility were dependent on antigens and paralleled the differential dynamics of conjugate formation, whereas DC motility gradually declined by default and was minimally affected by antigen presentation. During the transition period before and after phase two, numerous DCs interacted stably with some T cells and simultaneously engaged in brief contacts with others (Supplementary Information 10). If contact duration was determined by DCs, then individual DCs should support either brief encounters or stable conjugation, but not both. Moreover, when T-cell dwell time was not synchronized by anti-L-selectin, stable contacts were prominent at 10 h after T-cell injection, but short-lasting contacts were more frequent than after treatment with antibody, presumably owing to recent immigrants displaying phase-one-like behaviour (Supplementary Information 11, 12).
How do intranodal T cells keep track of time and what are the immunological consequences of each interactive phase? In vitro, T cells can integrate multiple brief signals to reach a threshold for full-fledged activation21,26. Conceivably, this is how T cells gather information from DCs during phase one. However, the ability of in vitro primed CD8+T cells to secrete IL-2 and to exert effector activities after adoptive transfer depends on the formation of stable T-cell–DC conjugates and the duration of T-cell stimulation, respectively27,28. Thus, phase two interactions might also be important. The three-stage time course of T-cell priming by DCs documented here provides a roadmap for testing these concepts and the underlying mechanisms in situ.