Generation and annotation of the DNA sequences of human chromosomes 2 and 4 (original) (raw)
Main
Less than 50 years after the human diploid number was established, the reference human genome sequence was announced1. Detailed accounts of the sequences of individual chromosomes are now providing great insights into genomic structure and evolution. Here we present our analysis of the sequence of human chromosomes 2 and 4. For chromosome 2, we analyse the region containing the ancestral chromosome fusion event2 and describe possible mechanisms for the inactivation of the vestigial centromere. For chromosome 4, we discover some regions with the lowest and highest (G + C) content in the human genome, as well as the putative largest ‘gene deserts’. Analyses of highly variant regions found on these chromosomes have also allowed us to investigate their origins.
Generation of the chromosome sequences
Chromosomes 2 and 4 were sequenced using a clone-by-clone shotgun sequencing strategy3 supported by the bacterial artificial chromosome (BAC)-based whole genome physical map4. The quality of the sequences was determined to exceed the 99.99% accuracy standard1,5,6. On both chromosomes, sequences extend into the centromere and reach the p-arm telomere7 (Supplementary Table 1). Attempts were made to close all remaining gaps8 (Supplementary Methods), with an emphasis on using newly available fosmid libraries. Seventy-six clones were selected from the fosmid end placements1, which added ∼500 kb of sequence (included in release hg17/build35). On the basis of size estimates of remaining gaps, the available sequence represents more than 99.6% of the total euchromatic sequence.
The integrity of the underlying clone sequences and their assembly into chromosomes were verified by comparisons of an in silico digest of each finished sequence to the restriction digests of the clone DNA, and comparison of the full assembly sequence against the underlying fingerprint data. In this way, we directly confirmed more than 99.99% of the testable bands. In addition, by examining the placements of BAC, fosmid and plasmid9 paired end sequences, and by comparing the order of BAC end placements to the order of the BACs within the fingerprint map4, we confirmed the overall consistency of the map, sequence and assembly (Supplementary Methods).
Comparison to physical and genetic maps
We have used the Genethon10, Marshfield11 and deCODE12 microsatellite-based maps, GeneMap9913 and TNG14 radiation hybrid maps, the Whitehead yeast artificial chromosome (YAC)-based map and the BAC physical map4 to evaluate the completeness and order of assembled sequences for chromosomes 2 and 4. Only a small number (< 1%) of sequence-tagged sites (STSs) were not identified in the existing sequence; these included STSs from repetitive sequences, sequence polymorphisms and regions within known sequence gaps.
To evaluate the assembly of the sequence, the chromosomal sequence positions of the deCODE STSs were plotted relative to their established map positions (Supplementary Fig. 1). When examining local ordering of the deCODE marker set (the average spacing of which is ∼1 per 600 kb), there were no long-range disagreements, and a local inversion of marker pairs was found in only one of the placements. Taken together, these data provide strong support for the presented sequences of chromosomes 2 and 4.
General features
We analysed the chromosome 2 and 4 sequences for interspersed repeat content (Supplementary Table 2), (G + C) content, recombination and the presence of CpG islands. For both chromosomes, the short interspersed nucleotide element (SINE) content is lower than the autosomal average. The long interspersed nucleotide element (LINE) content is higher than average for both chromosomes, with chromosome 4 containing the highest percentage across all autosomes.
The (G + C) content of chromosomes 2 (40.2%) and 4 (38.2%) is lower than that of the genome as a whole (41%). On chromosome 2, the lowest (G + C) content (29.9%) is found in a 40-kb region containing no known genes. Over 19% of chromosome 4 has a (G + C) content of less than 35%, compared with 9% in the genome as a whole. However, one of the highest (G + C) content windows in the genome (72.7%) is also found on chromosome 4.
We identified 1,662 CpG islands in chromosome 2 (7 per Mb), and 1,004 CpG islands in chromosome 4 (5.4 per Mb), each with an average length of ∼800 bp. Chromosome 4 has the lowest density of predicted CpG islands of any human chromosome. For the gene sets presented below, 67% (chromosome 2) and 64% (chromosome 4) had overlapping CpG islands, consistent with other estimates15,16.
Chromosomes 2 and 4 have the lowest average recombination rate of any of the chromosomes (1.09 compared with the genome average of 1.31). Each chromosome contains large regions with little or no recombination (Supplementary Table 3). For chromosome 2, these regions include the candidate tumour suppressor gene LRP1B17, which spans 500 kb, the ZAP70 gene18 and TTN, the longest coding sequence in the human genome, spanning 280 kb and encoding a 2,993 kDa protein. On chromosome 4, a recombination cold spot was identified at ∼42 Mb, the location of the paired-like homeobox 2b gene (PHOX2B). As expected, the primary hot spots are located near the telomeres, where recombination rates are five- to tenfold higher than average.
Protein-coding genes: known genes
Creation of protein-coding gene indices for chromosomes 2 and 4 exploited both the increasing number of available human messenger RNAs and the extensive orthology with mouse (defined for 94% of chromosome 2 and 97% of chromosome 4), in a hierarchical approach similar to that used for human chromosome 7 (ref. 8). First, a collection of 1,448 (chromosome 2) and 820 (chromosome 4) human mRNAs from RefSeq19 and the Mammalian Gene Collection (MGC)20 were assigned to the sequence and manually curated, resulting in 1,032 non-overlapping mRNAs on chromosome 2 and 633 on chromosome 4. On the basis of alignments with known mRNAs, 25% of the known genes on these chromosomes have alternative splice forms. However, we estimate that this percentage rises to as high as 85% on the basis of gene structure prediction using expressed-sequence-tag (EST) data and all vertebrate mRNAs with an average number of 5 transcripts per gene. Of the known genes, 89% of those on chromosome 2 and 86% of those on chromosome 4 had an associated poly(A) signal. All known mRNAs previously mapped to these chromosomes were successfully identified, confirming the completeness of the available sequence.
Alignment of the human mRNA set (RefSeq and MGC) against the genome revealed both insights and potentially confounding artefacts. For example, detailed examination identified a set of 36 genes (Supplementary Table 4) predicted from the known mRNAs that had no match at all to the mouse or rat genomes or their protein sets; 26 of these had no similarity to the non-redundant protein database. Sixteen of the 26 genes were single-exon genes, and might be fortuitous open reading frames (ORFs) in untranslated regions (UTRs). Eleven of these single-exon genes had ORFs of more than 300 bp (the average across the 16 single-exon genes was 350 bp). The remaining ten were multi-exon genes. To test whether these were novel human genes, we obtained sequences from other primates for six of the ten multi-exon genes. For five out of six genes, there was an ORF through the re-sequenced exon in each of the equivalent primate genes. In the sixth gene (Genbank accession number NM_153031, the representative entry for 3 underlying mRNAs also supported by EST sequences from human testis and brain libraries), only the chimp sequence had an ORF throughout the coding exon. The _K_a/_K_s ratio (the ratio of non-synonymous (_K_a) to synonymous (_K_s) nucleotide substitution rates) was 0.342, suggestive of purifying selection.
We also investigated 81 genes for which the genomic sequence differed from the corresponding mRNA, causing alterations to or truncation of the protein product predicted from the genome sequence. To determine the nature of these differences, we used polymerase chain reaction (PCR) to re-sequence each gene in a panel of 24 ethnically diverse individuals21 and in underlying BAC clones. Eight out of the 81 genes were found to contain errors in the genomic sequence. For 69 of the 81 genes, the sequence obtained from the 24 individuals agreed with the sequence of the original BAC clone, suggesting errors in the mRNA sequence or rare polymorphisms. Of these, 54 were single base-insertion or -deletion errors in the mRNA that shifted or truncated the reading frame in the complementary DNA relative to the genomic sequence. The other 15 mRNAs had multiple base-insertion or -deletion differences, such that the frame was eventually restored. In these cases, comparison with a related mouse gene sequence confirmed the genomic translation, typically with a more conserved match between the mouse and human genome sequences than with the corresponding human mRNA.
Four genes were determined to be polymorphic for gene disruptions in the 24 genomic samples (Table 1 and Supplementary Table 5), none of which had previously been annotated in public databases. For example, a single base-deletion event in an alternative 3′ exon was observed in the PMS1 gene, resulting in a change and extension of the ORF. Some cases of hereditary nonpolyposis colorectal cancer are associated with mutations in this gene22. In a second example, a polymorphic frameshift was observed in the final exon of the PASK mRNA, leading to a longer ORF in genomic translation. However, the similarity to the orthologous mouse gene does not extend past the stop codon of the mRNA. In a third case, a polymorphic single base deletion identified in the longest isoform of AUP1 resulted in an early, in-frame stop codon, which truncated the protein at one-third of its normal length (149 out of 476 residues). Finally, an insertion of 4 bp was found in the genomic sequence of TSARG2 (also known as SPATA4) relative to the RefSeq mRNA, causing a frameshift and early truncation of the protein. Similarity between the orthologous mouse protein and genomic sequence extends through the region of the frameshift.
Table 1 Sequence and frequency of polymorphic mRNAs
In addition, we detected 41 potential polymorphic frameshifts by aligning genomic coding regions of chromosomes 2 and 4 (confirmed by mRNAs) to random genomic shotgun data9 and examining high-quality insertion and deletion differences. When comparing these regions to the orthologous chimpanzee sequence (Chimpanzee Genome Sequencing Consortium (GSC), unpublished data), the orthologous chimpanzee sequence agreed with the human BAC sequence in 37 instances. This confirms the genome sequence but does not rule out true polymorphism. For the four remaining frameshifts, confirmation with the chimpanzee sequence served to eliminate error in the random reads as a cause of the frameshift, indicating that the genome carries the derived allele. Thus, using the available chimpanzee sequence, we have identified four probable polymorphic gene disruptions not yet annotated in the public databases.
Protein-coding genes: predicted genes
Predicted genes were identified on chromosomes 2 and 4 using GENEWISE23 (which uses protein homologies to seed prediction), and TWINSCAN24 (which uses comparative sequence analysis, in this case using the mouse genome sequence). A previous difficulty in using GENEWISE, especially in regions containing duplicated gene clusters, has been definition of the boundaries of the genomic region provided as input. We have alleviated this problem using the program BLAST2GENE25 to detect (using homology) independent copies of genes, ranging from single exons to complete copies. The combined output predicted 99.5% of all known exons and at least part of 99.8% of the known genes, indicating that for known genes, the combined output is reasonably comprehensive and has high sensitivity.
Using methods similar to those for our analyses of human chromsome 7 (see ref. 8 and Supplementary Methods), we refined the initial predicted gene set. Predicted genes were required to have a highly significant match in the mouse gene set in the orthologous region of the mouse genome (if assigned), and the matching mouse gene was required to have the predicted chromosome 2 or 4 gene as its best match. Redundancy between the sets, within the sets, and with known genes was eliminated, accepting the already known genes, the GENEWISE predictions and then the TWINSCAN predictions, in that order. This yielded 314 predicted genes for chromosome 2 and 163 predicted genes on chromosome 4, bringing the total number of protein-coding genes to 1,346 and 796, respectively.
The pseudogene analysis below confirms that few functional protein-coding genes have been missed. Of the spliced ESTs mapping to chromosomes 2 and 4, 97% overlap an exon or are within 1 kb of an initial or terminal exon in the gene set. The non-overlapping ESTs might represent some coding genes, but are more likely to be other transcription products, including non-coding RNA genes or untranslated fragments of protein-coding genes. A high percentage of the predicted genes can be matched with human ESTs and have similarities with non-mammalian vertebrate protein sets (Table 2). The higher percentages for the known genes (compared with the predicted genes) probably reflect the fact that they are in general more highly expressed and, in many cases, more highly conserved across evolution. Comparisons of gene structure characteristics for known and predicted genes (Table 3) reveal similar numbers of coding bases per gene. Smaller exon counts and gene lengths for the predicted gene set might reflect fragmentation or missing terminal exons. Finally, the pseudogene analysis described below suggests that the protein-coding gene set is relatively free of pseudogenes. We conclude that the combined set of known and predicted protein coding genes is both reasonably comprehensive and free of false predictions.
Table 2 Coverage of predicted and known genes by various data sets
Table 3 Characteristics of predicted versus known genes
Pseudogenes
With the availability of the complete genome sequence for rat26 and mouse27, and with the sequences for other mammalian genomes in progress, we have significantly refined our pseudogene catalogues8,26,28. For chromosomes 2 and 4, we have further improved our detection and classification algorithms to define a set of 1,239 and 778 intergenic regions considered pseudogenes because they show homology to existing proteins and because nearly all (94 ± 3% and 95 ± 3%) appear to evolve neutrally according to the _K_a/_K_s ratio test28. In contrast, only 5 ± 3% of the protein-coding set have a _K_a/_K_s ratio consistent with neutral evolution.
We distinguished retrotransposed (processed) from segmentally duplicated (non-processed) pseudogenes on the basis of their sequence similarity in orthologous regions of the mouse genome because processed pseudogenes tend to integrate throughout the genome (probably far from their functional paralogues). Out of 230 pseudogenes on chromosomes 2 and 4 with detectable sequence similarity to their mouse orthologous block, 94 appeared to be non-processed because they also shared similarity with neighbouring genes. Of the remaining pseudogenes (136), nearly all were shown to have lost at least one intron when compared with their parental gene, and were therefore considered processed pseudogenes. The sequence identity between these processed pseudogenes and their parental human genes is significantly higher (> 10% difference in nearly all cases) than the sequence identity between the pseudogenes and the orthologous mouse regions. This strongly suggests that the pseudogenes arose independently in the human and mouse lineages, rather than from a common ancestor as recently proposed29. Altogether, we defined a set of 1,856 processed and 161 non-processed pseudogenes, consistent with estimates of ∼20,000 pseudogenes across the human genome28.
Non-coding RNAs
We identified non-coding RNA (ncRNA) genes in the chromosome sequences as described for the human genome sequence1. With the exception of close sequence homologues and transfer RNAs, ncRNA gene annotation is still largely limited to annotating known gene sequences30. Chromosomes 2 and 4 contain 15% of the unambiguous bases in the human genome and 14% of the annotated ncRNA pseudogenes (863 out of 6,124), but only 2% of the tRNAs and only 5% of all annotated ncRNA genes (50 out of 1,096). The ncRNA pseudogene annotation includes 163 tRNA pseudogenes, 150 of which were derived from ancient mtDNA integrations into the nuclear genome (nuclear mitochondrial DNAs or NUMTs31). Previous annotation missed most of these mtDNA-derived pseudogenes, because their sequence divergence is usually too great to recognize them individually. However, here we have identified these pseudogenes by searching for clustering of weak hits in a larger expanse of decayed mtDNA synteny.
Protein index
We derived an index of predicted protein sequences for human chromosomes 2 and 4, and compared them to the Interpro database32 using Interproscan33 to predict protein families, domain and repeat families, and sequence motifs. Of the 74% of proteins that had an Interpro classification, 67% were multi-domain. Protein kinases are the most highly represented families on the two chromosomes. Gene clusters included the most prevalent protein families in the human genome, the immunoglobulins and zinc-finger domain-containing proteins. On chromosome 2, a cluster of 13 genes containing immunoglobulin-like domains (Interpro identifier IPR007110) is found on the p-arm near the centromere, and a cluster of 11 genes containing zinc-finger domains (C2H2 type; IPR007087) is found on the q-arm. On chromosome 4, the largest clusters are grouped near each other on the q-arm: one cluster contains nine genes with UDP-glucosyltransferase domains (IPR002213), and another cluster contains eight small chemokines (of the C-X-C/interleukin-8 subfamily; IPR002473). The Interpro results were used to assign Gene Ontology (GO) codes34: for chromosomes 2 and 4, 63% and 68% of proteins were assigned to the global category of molecular function, 51% and 57% to biological process, and 34% and 39% to cellular components, respectively. The two most frequent specific GO categories for both chromosomes were the cellular components of nucleus (GO:0005634) and membrane (GO:0016020), representing 15% (chromosome 2) and 19% (chromosome 4) of the genes with assigned function.
Gene deserts and conserved non-coding sequence
Gene deserts are a curious feature of vertebrate genomes; they are megabase-size genomic segments devoid of protein-coding genes. The overall architectures of these regions are maintained over long evolutionary distances, sometimes with only very limited sequence conservation35. In other cases, the deserts have been found to contain small blocks of highly conserved sequences that regulate flanking genes. Roughly 80% of human gene deserts occur in (G + C)-poor, Giemsa-dark chromosome bands. Chromosomes 2 and 4, which contain some of the largest deserts in the genome, provide opportunities to examine possible roles of such regions.
Strikingly, PCDH7, a protocadherin gene expressed predominately in the brain and heart (Fig. 1a), and its paralogue PCDH10 (at 4q28.3), are each flanked on both sides by unusually large deserts (5.2 Mb and 3.5 Mb for PCDH7, and 5.1 Mb and 4.0 Mb for PCDH10). The overall genome architecture of these gene deserts, including the flanking genes, is conserved in mammals and birds (data not shown), but the deserts themselves show only average levels of nucleotide conservation with dog (data provided by the Broad Institute), mouse27 and chicken36. The duplication event that separated the two protocadherins occurred before mammals diverged from fish, but after they diverged from Ciona intestinalis, suggesting that this arrangement has persisted for hundreds of millions of years.
Figure 1: Three gene deserts.
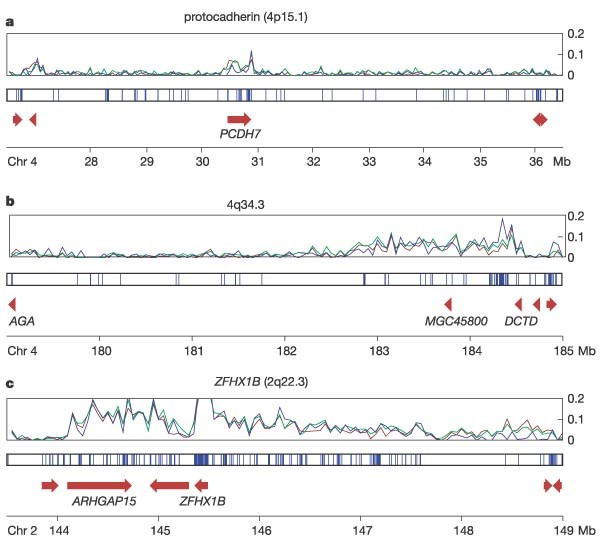
Levels of non-coding conservation are plotted in non-overlapping 50-kb windows between human and dog (green), human and mouse (red), and human and chicken (blue). The second panel in each of a–c shows positions of matches between human and Fugu rubripes (including coding regions) computed by the BLAT50 program. Red symbols show the positions and orientations of genes. a, A 10-Mb interval of chromosome 4 centred on the protocadherin gene PCDH7. b, A 6-Mb interval of chromosome 4 containing one of the longest human gene deserts, showing significant enrichment for matches to chicken, mouse and dog. c, A 5.5-Mb interval of chromosome 2 that contains the longest human segment showing high enrichment for non-coding matches with chicken.
Two other large deserts (Fig. 1b, c) have portions with a higher-than-average level of nucleotide conservation; these are a 4.7 Mb desert at 4q34.3 and a 3.5 Mb desert upstream of ZFHX1B at 2q22.3. When compared with chicken, we found 168 segments of conserved sequence for the desert at 4q34.3 (36.5 per Mb), 246 segments for the desert at 2q22.3 (74.5 per Mb), and 64 segments in the desert downstream of PCDH7 (13.1 per Mb). Within these intervals, the conserved segments are not uniformly distributed. For the 4q34.3 desert, the pattern of conservation is similar to that seen in mouse and dog, but there is relatively little conservation with the pufferfish Takifugu (Fugu) rubripes37. In contrast, the region upstream of ZFHX1B is enriched in conserved segments in T. rubripes as well as in dog and mouse. The ZFHX1B gene and its neighbour ARHGAP15 appear to be products of a segmental duplication. Their paralogous copies (TCF8 and ARHGAP12) are found on 10p11.22. The intergenic interval upstream of TCF8 is 335 kb and shows only weak interspecies conservation. There is also little evidence for conservation between the paralogues outside of the coding regions, other than a weak alignment in the 3′-UTRs of ZFHX1B and TCF8. This UTR region is almost 100% conserved between ZFHX1B and the orthologous intervals in chicken and mouse. Thus, the presence of these gene deserts is maintained over longer evolutionary periods than are intervals of high nucleotide-level conservation within them.
We looked for overrepresented motifs in the conserved non-coding segments in the 2q22.3 region. We evaluated the frequencies of short (4–9 bp) patterns in the conserved and diverged intervals (see Supplementary Methods for details). Using these patterns, we could distinguish between the conserved and non-conserved intervals with 75% accuracy, suggesting that the conserved regions share short, specific, non-coding (but presumably functional) elements, perhaps transcription factor binding sites, that have been conserved throughout the evolution of mammals and birds.
Recent local duplications—complexity of gene prediction
The gene for a well-characterized human nuclear export protein, the RAN binding protein 2 (RanBP2), is contained in a region of recent duplication in the human genome and is in a recombination hot spot on chromosome 2q (ref. 38). Through a series of rearrangements, this region underwent exon shuffling, domain accretion and deletion, suggesting that this entire region has been extremely dynamic over the last several million years. In a detailed examination of this region, we discovered eight new genes that arose by duplication of RANBP2 (Fig. 2). We called the new gene family RGP, for RanBP2-like, GRIP domain-containing proteins. The RGP copies are interspersed in a 9-Mb region on both sides of the centromere, and have significantly modified their gene structure compared with RANBP2. There is experimental evidence for expression of almost all of the copies39, including specific ESTs and cDNAs. Similar duplications are also found in chimpanzee (but other sequenced metazoan genomes, including mouse, have only one copy). This region provides an excellent example of difficulties encountered during annotation using automated pipelines, and shows how the application of new tools for hunting for gene duplications can reveal interesting evolutionary scenarios.
Figure 2: RANBP2 gene duplication in the pericentromeric region of chromosome 2.
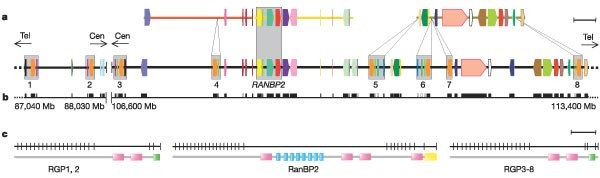
a, Gene composition. Each coloured bar/arrow represents a different gene; segmentally duplicated regions are highlighted with grey boxes. RANBP2 and its eight paralogues are shown as red and orange arrows, respectively. Regions of orthology in mouse chromosomes 17 (orange), 10 (yellow) and 2 (green) are reported above the human gene bar. Scale bar, 310 kb. b, Filled boxes indicate evidence for expression of genes in a. c, Gene and protein domain architecture of RanBP2 and the RGP family (RGP1–8). Black lines show exon/intron boundaries; pink boxes show Ran binding domains; blue boxes show zinc-finger domains; yellow box shows a cyclophilin A-homologous domain; green boxes show GRIP domains. Scale bar, 300 amino acids.
Segmental duplications
Segmental duplications of genomic DNA—large, low-copy repeats often spanning hundreds of kilobases—are a prominent feature of the human genome. We performed a detailed analysis of duplicated sequence (≥ 90% sequence identity and ≥1 kb in length), comparing the finished chromosome assemblies to the human genome sequence. Both chromosomes 2 and 4 show less segmental duplication (4.2% and 2.3%, respectively) than the genome average (5.2%) (Supplementary Table 6 and Supplementary Fig. 2). The reduction in segmental duplications on chromosome 4 is especially noticeable within the pericentromeric regions of 4q11–q12, where not a single duplication could be detected within 2 Mb of the centromere. Although it remains possible that additional pericentromeric sequence will be recovered for 4q11–q12, the most proximal segment of sequence does contain ∼26 kb of alpha monomeric satellite DNA, suggesting proximity to the centromere. Given that we found no evidence for duplications using a second detection strategy40, and given that fluorescence in situ hybridization (FISH) data41 provide little evidence for 4q11–q12 pericentromeric duplications, we suggest that 4q11–q12 has been relatively quiescent in terms of pericentromeric duplications. This is in sharp contrast with 2p11 and 2q11, where nearly half of the most proximal 2-Mb pericentromeric region (899 kb and 910 kb respectively) shows extensive recent duplication (Supplementary Fig. 3).
Chromosome 2 is unique to the human lineage of evolution, having emerged as a result of head-to-head fusion of two acrocentric chromosomes that remained separate in other primates. The precise fusion site has been located in 2q13–2q14.1 (ref. 2; hg16:114455823–114455838), where our analysis confirmed the presence of multiple subtelomeric duplications to chromosomes 1, 5, 8, 9, 10, 12, 19, 21 and 22 (Fig. 3; Supplementary Fig. 3a, region A). During the formation of human chromosome 2, one of the two centromeres became inactivated (2q21, which corresponds to the centromere from chimp chromosome 13) and the centromeric structure quickly deterioriated42. A search of genome sequence for the presence of vestigial centromere and pericentromeric sequences identified a 2.6-Mb region in 2q21.1–2q21.2 that is enriched for pericentromeric duplications to chromosomes 1, 7, 9, 10, 13, 14, 15, 18, 21 and 22 as well as a variety of centromeric satellite repeat sequence motifs (HSAT5, GSATII, ACRO1). The degree of sequence identity of the interchromosomal duplications (< 98%) suggests that these pericentromeric segmental duplications existed before the formation of this chromosome. Within this 2.6-Mb interval, we identified a relatively large tract of satellite sequence (three tracts totalling 31,198 bp of alpha-satellite sequence over 36,696 bp), which likely demarcates the position of the ancestral centromere (Supplementary Fig. 3a, region B). These data raise the possibility that ancestral telomeres and ancestral centromeres that have disappeared over the course of mammalian chromosomal evolution might be marked by the presence of an abundance of residual pericentromeric and subtelomeric duplications.
Figure 3: Pattern of recent segmental duplications in the vestigial centromere region on chromosome 2.
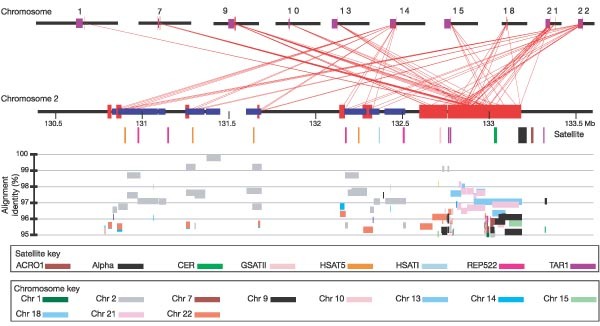
Large (> 10 kb), highly similar (> 95%) intrachromosomal (blue) and interchromosomal (red) segmental duplications are shown for a 3-Mb region along the horizontal line of chromosome 2, in increments of 0.5 Mb. The upper panel shows extensive duplication with pericentromeric regions on other chromosomes. Centromeres are shown in purple. The coloured vertical bars underneath chromosome 2 are satellite sequences. The lower panel shows the percentage identity of each pairwise alignment. Coloured bars represent alignments from different chromosomes.
By analogy, an interstitial 1.1-Mb region of subtelomeric duplications was identified within 4q26 (Supplementary Fig. 3b, region D). This region probably represents a genomic segment that became duplicately transposed to a subtelomeric region and was subsequently dispersed throughout the human genome by secondary subtelomeric–subtelomeric duplications. The average percentage identity between this region and the subtelomeric regions is 97.4%, and among these subtelomeric regions it is 99.0%, indicating more recent duplications or gene conversion events. Although there is not conclusive evidence that this represents the site of an ancestral telomere, it has the characteristics of such a region, showing an abundance of subtelomeric duplications to human chromosomes 1–9, 11, 16, 19 and 20, an enrichment of short blocks of orthology between human and mouse, and a breakpoint of conserved orthology with the flanking regions between human and mouse. A second short (30-kb) region in 4q32.3 also shows a breakpoint in conservation with mouse and a similar pattern of subtelomeric duplications. Sixteen duplications ranging in size from 10–20 kb and showing remarkably high sequence identity (96–97%) are distributed among ten subtelomeric regions (chromosomes 1, 2, 5–8, 10, 16, 19 and 20, Supplementary Fig. 3b, region E). In contrast with the region of 4q26, the organization of this region appears to be conserved in mouse, as revealed by orthologous mouse–human anchor sequences that extend beyond the duplication. Finally, although intrachromosomal duplications are relatively rare on chromosome 4 (Supplementary Figs 4 and 5), one large (750-kb) cluster of tandem intrachromosomal duplication was noted in 4q13.2. This region contains at least five members of a family of tandemly duplicated microsomal UDP-glycosyltransferase genes that are thought to be important in drug detoxification.
Sequence variation
In the process of constructing contiguous chromosomal sequences from the underlying BAC clone sequences, we encountered several candidate overlaps that showed unusually high levels of variation. For 53 overlaps, totalling 3.1 Mb (with an average difference of ∼4 differences per kb), we showed by segregation analysis8 that these represented true overlaps, with the differences arising from different alleles of the same locus and not from distinct regions produced by segmental duplication21. Extending this analysis to 2,718 overlap regions on chromosomes 2, 4 and 7 with at least 5 kb of overlap, we identified 678 regions with at least three ‘polymorphic events’, suggesting that the underlying clones represented different haplotypes43. Of greatest interest were 24 overlaps (Supplementary Table 7), where multiple (≥ 3) consecutive windows varied by at least two standard deviations from the average, possibly indicating segments showing balancing selection44. In one example, a 5-kb segment had 75 polymorphic events, and the neighbouring five windows also had more than 18 (2 s.d.) polymorphic events. In 15 cases, the highly variant region was found near a gene, including the known genes CRYPTIC (also known as CFC1), TSSC1, LRP1B and GYPE. We sampled across eight of these highly variant regions from the panel of 24 individuals21, and confirmed both that these segments were polymorphic in the population and that these regions of extreme variation appear to arise from two distinct haplotype blocks. Further, chimp single nucleotide polymorphisms (SNPs) mapped to the human genome (Chimpanzee GSC, unpublished data) show increased frequencies of polymorphisms (at least four consecutive 5-kb windows containing more than mean + 2 s.d.) in three of the five regions where orthologous chimpanzee sequence was available. Based on these data, it is unlikely that this represents a locally high mutation rate. Instead, these regions might represent unusually deep coalescents, perhaps as a result of diversifying selection.
Summary and conclusions
The achievement of highly accurate comprehensive sequence for chromosomes 2 and 4 (and other published human chromosomes) represents a critical step for the Human Genome Project in that it makes possible more detailed and conclusive analyses. On chromosome 2, the local region surrounding the ancestral chromosomal fusion site on 2q13–2q14.1 had previously been described2. Here we identified a 2.6-Mb region within 2q21.1–2q21.2 that is enriched for pericentromeric duplications and centromeric satellite repeat sequence motifs, including a stretch of alpha-satellite sequence that probably identifies the location of the ancestral centromere. Our results suggest that the abundance of residual pericentromeric and subtelomeric duplications in the human genome, coupled with breakpoints in orthology with mouse, might be markers of ancestral telomeres and centromeres, perhaps representative of recurrent chromosome rearrangements in the human lineage. Also, using orthologous relationships with other genome sequences such as mouse and rat, we have more confidently identified and discriminated between genes and pseudogenes, with accurate classification regarding processed and non-processed pseudogenes. Although the expanding mRNA sets still require cautious evaluation, we have used them to identify a possible human/chimpanzee-specific protein and to characterize a small subset of proteins that contain polymorphisms leading to altered proteins in the human lineage. The sequence data for chromosomes 2 and 4, together with the high-quality annotation of genes and an analysis of homologous regions of vertebrate genomes, reveal a high-level structure consisting of two gene deserts separated by a protocadherin gene. This high-level structure appears to be more stable over evolutionary time than does the low-level nucleotide conservation in other deserts. A genome-wide search revealed a general property of the cadherin gene family: it includes 12% of all human genes that have a desert immediately on each side, but contains only 0.4% of all human genes. We have also described genomic segments (on the order of tens of kilobases) for which there are sharp rises in the density of human variation that seem to correlate with haplotype blocks (for example, ref. 43). Although these regions might still represent chance preservation of two alternate haplotype blocks over evolutionary time, they might well also be the result of balancing selection in these regions. It will be important to continue evaluating additional regions, their possible roles in human variation and their correlations with human phenotypes. Critically, immediate access to this sequence will allow researchers in all disciplines to contribute to the understanding of the genome and its relevance in human health.
Methods
Sequencing in other primates
We attempted to amplify across each exon in each gene of interest from the following primates: Homo sapiens, Celebes crested macaca (Macaca nigra), Sumatran orangutan (Pongo pygmaeus), Gorilla gorilla, black-handed spider monkey (New World monkey Ateles geoffroyi) and chimpanzee (Pan troglodytes). Primers were chosen in highly conserved human/chimp intronic regions directly flanking the exons. Multiple primers were chosen to increase the possibility of getting a successful product. When we were not able to amplify a given exon in a primate, new primers were chosen on the basis of sequence conservation data from other monkeys where amplification had been successful.
Assessing human deletions/polymorphisms
A list of possible deletions or polymorphisms in human chromosomes 2 and 4 was created by placement of the fosmid end sequences against the human genome1. All fosmid end placements separated by less than 3.5 standard deviations from the average were flagged as possible deletions. Using those criteria, 27 possible deletion regions were flagged (Supplementary Tables 8 and 9). Almost 70% of these regions across the human genome were found to be polymorphic when tested using PCR analysis1. We aligned both of the publicly available Pan troglodytes assemblies (Chimpanzee GSC, unpublished data) against the human genome and manually reviewed the alignments to see whether the possible deletions in human were confirmed by chimpanzee coverage. In 11 cases (41%), there was good coverage of the entire region in the chimpanzee assembly and there was no suggestion of missing data in the human genome. In 12 cases (44%), there was additional chimpanzee data throughout the region, suggesting a possible deletion (polymorphic or real) in the human sequence. In one case, there was no chimp coverage of the human region, and in three cases the chimpanzee assembly was too fragmented to determine whether a deletion was present. It remains to be determined whether the deletion in the human sequence was an error or polymorphic.
Gene deserts
For each panel of Fig. 1, we identified orthologous intervals in the current (as of July 2004) dog, mouse and chicken genome assemblies. After masking known coding regions in the human sequence, we performed alignments to the other three species using the BlastZ program45. For the human–chicken alignment, default alignment-scoring parameters were used. For human–dog alignment, we used the following scores: match = 100; transition = -500; transversion = -1,200; gap-open = -2,000; and gap-extension = -500. For human–mouse the respective parameters were 100, -200, -600, -1,000 and -200. Those parameter values were chosen so that the genome-wide fraction of aligned bases was about 0.02 for each species; segments with a higher fraction of aligned bases were considered to be enriched for interspecies conservation. Figure 1 shows the fraction of the segment contained within a local alignment, for non-overlapping 50-kb windows.
Classification of conserved versus nonconserved segments of the human gene desert in Fig. 1c was performed as follows. The gene desert was aligned to the orthologous chicken region, and human intervals showing strong conservation (using an arbitrary threshold of at least 70% identity with chicken over 100 bp of sequence) or no conservation with chicken were selected. To ensure equal training-set size and length distribution, a subset of the unaligned intervals was prepared by repeatedly randomly selecting an element from the strongly aligned set, and then randomly selecting a piece of an interval from the unaligned set of the same size.
Classification was first performed using the Markov model method described in ref. 46, using only the human sequence (rather than an alignment) as input and the four possible nucleotides as an alphabet. Leave-one-out cross-validation was performed for each pair of training sets at orders 1 through 8 (that is, nucleotide words of 2–9 bp) to determine the best classifying model.
The alternative classification approach constructed a vector of the frequency of occurrence of each possible word for each interval. A support vector machine (SVM) as implemented in LIBSVM[47](/articles/nature03466#ref-CR47 "Chang, C. C. & Chih-Jen, L. LIBSVM: a library for support vector machines. Software at http://www.csie.ntu.edu.tw/~cjlin/libsvm/
(2001).") was used to classify each pair of training sets. A gaussian kernel was used and parameters were selected using a grid search and fivefold cross-validation. Because the grid search is more expensive, only word sizes 4–6 were tested.For comparison, we applied the same methods to sets of RefSeq-annotated 3′- and 5′-UTRs with similar (G + C) content and length distributions. The 3′- and 5′-UTR sets were chosen by selecting the subset of all RefSeq-annotated UTRs with (G + C) content between 0.36 and 0.37 (similar to the gene desert) and length between 20 and 400 bp (resulting in a similar length distribution). We were able to distinguish them with 67% accuracy. This suggests that the human sequence of the strongly conserved and unconserved intervals in this gene desert show at least as much difference in characteristic short patterns used by the classification schemes as do 3′- and 5′-UTRs.
References
- Human Genome Sequencing Consortium. Finishing the euchromatic sequence of the human genome. Nature 431, 931–945 (2004)
ADS Google Scholar - Fan, Y., Linardopoulou, E., Friedman, C., Williams, E. & Trask, B. J. Genomic structure and evolution of the ancestral chromosome fusion site in 2q13–2q14.1 and paralogous regions on other human chromosomes. Genome Res. 12, 1651–1662 (2002)
CAS PubMed PubMed Central Google Scholar - International Human Genome Sequencing Consortium. Initial sequencing and analysis of the human genome. Nature 409, 860–921 (2001)
Google Scholar - The International Human Genome Mapping Consortium. A physical map of the human genome. Nature 409, 934–941 (2001)
Google Scholar - Felsenfeld, A., Peterson, J., Schloss, J. & Guyer, M. Assessing the quality of the DNA sequence from the Human Genome Project. Genome Res. 9, 1–4 (1999)
CAS PubMed Google Scholar - Schmutz, J., Wheeler, J., Grimwood, J., Dickson, M. & Myers, R. M. Assessing the quality of finished genomic sequence. Cold Spring Harb. Symp. Quant. Biol. 68, 31–37 (2003)
CAS PubMed Google Scholar - Riethman, H. C. et al. Integration of telomere sequences with the draft human genome sequence. Nature 409, 948–951 (2001)
CAS PubMed Google Scholar - Hillier, L. W. et al. The DNA sequence of human chromosome 7. Nature 424, 157–164 (2003)
ADS CAS PubMed Google Scholar - The International HapMap Consortium. The International HapMap Project. Nature 426, 789–796 (2003)
Google Scholar - Dib, C. et al. A comprehensive genetic map of the human genome based on 5,264 microsatellites. Nature 380, 152–154 (1996)
ADS CAS PubMed Google Scholar - Broman, K. W., Murray, J. C., Sheffield, V. C., White, R. L. & Weber, J. L. Comprehensive human genetic maps: individual and sex-specific variation in recombination. Am. J. Hum. Genet. 63, 861–869 (1998)
CAS PubMed PubMed Central Google Scholar - Kong, A. et al. A high-resolution recombination map of the human genome. Nature Genet. 31, 241–247 (2002)
CAS PubMed Google Scholar - Schuler, G. D. et al. A gene map of the human genome. Science 274, 540–546 (1996)
ADS CAS PubMed Google Scholar - Olivier, M. et al. A high-resolution radiation hybrid map of the human genome draft sequence. Science 291, 1298–1302 (2001)
ADS CAS PubMed Google Scholar - Antequera, F. & Bird, A. Number of CpG islands and genes in human and mouse. Proc. Natl Acad. Sci. USA 90, 11995–11999 (1993)
ADS CAS PubMed PubMed Central Google Scholar - Wang, Y. & Leung, F. C. An evaluation of a new criteria for CpG islands in the human genome. Bioinformatics 20, 1170–1177 (2004)
CAS PubMed Google Scholar - Liu, C. X., Musco, S., Lisitsina, N. M., Yaklichkin, S. Y. & Lisitsyn, N. A. Genomic organization of a new candidate tumor suppressor gene, LRP1B. Genomics 69, 271–274 (2000)
CAS PubMed Google Scholar - Chan, A. C. et al. ZAP-70 deficiency in an autosomal recessive form of severe combined immunodeficiency. Science 264, 1559–1601 (1994)
ADS Google Scholar - Pruitt, K. D. & Maglott, D. R. RefSeq and LocusLink: NCBI gene-centered resources. Nucleic Acids Res. 29, 137–140 (2001)
CAS PubMed PubMed Central Google Scholar - Mammalian Gene Collection Program Team. Generation and initial analysis of more than 15,000 full-length human and mouse cDNA sequences. Proc. Natl Acad. Sci. USA 99, 16899–16903 (2002)
ADS Google Scholar - Sachidanandam, R. et al. A map of human genome sequence variation containing 1.42 million single nucleotide polymorphisms. Nature 409, 928–933 (2001)
ADS CAS PubMed Google Scholar - Nicolaides, N. C. et al. Mutations of two PMS homologues in hereditary nonpolyposis colon cancer. Nature 371, 75–80 (1994)
ADS CAS PubMed Google Scholar - Birney, E. & Durbin, R. Using GeneWise in the Drosophila annotation experiment. Genome Res. 10, 547–548 (2000)
CAS PubMed PubMed Central Google Scholar - Korf, I., Flicek, P., Duan, D. & Brent, M. R. Integrating genomic homology into gene structure prediction. Bioinformatics 17(S1), 140–148 (2001)
Google Scholar - Suyama, M., Torrents, D. & Bork, P. BLAST2GENE: a comprehensive conversion of BLAST output into independent genes and gene fragments. Bioinformatics 20, 1968–1970 (2004)
CAS PubMed Google Scholar - Rat Genome Sequencing Project Consortium. Genome sequence of the Brown Norway rat yields insights into mammalian evolution. Nature 428, 493–521 (2004)
Google Scholar - Mouse Genome Sequencing Consortium. Initial sequencing and comparative analysis of the mouse genome. Nature 420, 520–562 (2002)
Google Scholar - Torrents, D., Suyama, M., Zdobnov, E. & Bork, P. A genome-wide survey of human pseudogenes. Genome Res. 13, 2559–2567 (2003)
CAS PubMed PubMed Central Google Scholar - Zhang, Z., Carriero, N. & Gerstein, M. Comparative analysis of processed pseudogenes in the mouse and human genomes. Trends Genet. 20, 62–67 (2004)
PubMed Google Scholar - Eddy, S. R. Computational genomics of noncoding RNA genes. Cell 109, 137–140 (2002)
CAS PubMed Google Scholar - Mishmar, D., Ruiz-Pesini, E., Brandon, M. & Wallace, D. C. Mitochondrial DNA-like sequences in the nucleus (NUMTs): Insights into our African origins and the mechanism of foreign DNA integration. Hum. Mutat. 23, 125–133 (2004)
CAS PubMed Google Scholar - Mulder, N. J. et al. InterPro: an integrated documentation resource for protein families, domains and functional sites. Brief. Bioinform. 3, 225–235 (2002)
CAS PubMed Google Scholar - Zdobnov, E. M. & Apweiler, R. InterProScan–an integration platform for the signature-recognition methods in InterPro. Bioinformatics 17, 847–848 (2001)
CAS PubMed Google Scholar - The Gene Ontology Consortium. Creating the Gene Ontology resource: design and implementation. Genome Res. 11, 1425–1433 (2001)
Google Scholar - Ovcharenko, I. et al. Evolution and functional classification of vertebrate gene deserts. Genome Res. 15, 137–145 (2005)
CAS PubMed PubMed Central Google Scholar - International Chicken Genome Sequencing Consortium. Sequence and comparative analysis of the chicken genome provide unique perspectives on vertebrate evolution. Nature 432, 695–715 (2004)
Google Scholar - Aparicio, S. et al. Whole-genome shotgun assembly and analysis of the genome of Fugu rubripes . Science 297, 1301–1310 (2002)
ADS CAS PubMed Google Scholar - Bailey, J. A. et al. Recent segmental duplications in the human genome. Science 297, 1003–1007 (2002)
ADS CAS PubMed Google Scholar - Ciccarelli, F. D. et al. Complex genomic rearrangements lead to novel primate gene function. Genome Res. 15, 343–351 (2005)
CAS PubMed PubMed Central Google Scholar - Bailey, J. A. et al. Human-specific duplication and mosaic transcripts: the recent paralogous structure of chromosome 22. Am. J. Hum. Genet. 70, 83–100 (2002)
CAS PubMed Google Scholar - The BAC Resource Consortium. Integration of cytogenetic landmarks into the draft sequence of the human genome. Nature 409, 953–958 (2001)
Google Scholar - Yunis, J. J. & Prakash, O. The origin of man: a chromosomal pictorial legacy. Science 215, 1525–1530 (1982)
ADS CAS PubMed Google Scholar - Gabriel, S. B. et al. The structure of haplotype blocks in the human genome. Science 296, 2225–2229 (2002)
ADS CAS PubMed Google Scholar - Daly, M. J., Rioux, J. D., Schaffner, S. F., Hudson, T. J. & Lander, E. S. High-resolution haplotype structure in the human genome. Nature Genet. 29, 229–232 (2001)
CAS PubMed Google Scholar - Schwartz, S. et al. Human-mouse alignments with BLASTZ. Genome Res. 13, 103–107 (2003)
CAS PubMed PubMed Central Google Scholar - Kolbe, D. et al. Regulatory potential scores from genome-wide three-way alignments of human, mouse, and rat. Genome Res. 14, 700–707 (2004)
CAS PubMed PubMed Central Google Scholar - Chang, C. C. & Chih-Jen, L. LIBSVM: a library for support vector machines. Software at http://www.csie.ntu.edu.tw/~cjlin/libsvm/ (2001).
- Roest-Crollius, H. et al. Estimate of human gene number provided by genome-wide analysis using Tetraodon nigroviridis DNA sequence. Nature Genet. 25, 235–238 (2000)
CAS PubMed Google Scholar - Dehal, P. et al. The draft genome of Ciona intestinalis: insights into chordate and vertebrate origins. Science 298, 2157–2167 (2002)
ADS CAS PubMed Google Scholar - Kent, W. J. BLAT–the BLAST-like alignment tool. Genome Res. 12, 656–664 (2002)
CAS PubMed PubMed Central Google Scholar
Acknowledgements
The authors would like to thank the staff, past and present, of the Washington University Genome Sequencing Center as well as the following laboratories that contributed sequence segments to the final chromosome 2 and 4 sequence: the Broad Institute of MIT; Stanford DNA Sequencing and Technology Development Center; the Sanger Centre; National Yang-Ming University in Taipei; Genoscope; Baylor College of Medicine; the Joint Genome Institute; University of Washington Multimegabase Sequencing Center; DOE Joint Genome Institute; and Roswell Park Cancer Institute. We thank T. Hubbard, J. Ashurst, J. Gilbert and S. Keenan for Ensembl pipeline assistance. We thank the Broad Institute of MIT, Harvard and Agencourt Bioscience for making a preliminary assembly of dog genome sequence available to us. We thank the Zebrafish Sequencing Group at the Sanger Centre for the Danio rerio preliminary protein set. We thank the International HapMap Consortium and their sponsors for use of their data and J. Mullikin for help with alignment of their data to the human genome. We thank the Chimpanzee Genome Sequencing Consortium for use of the chimpanzee sequence data. The authors would also like to acknowledge the efforts of the HUGO Gene Nomenclature Committee. Finally, the authors acknowledge the National Human Genome Research Institute for funding this work.
Author information
Author notes
- David R. Cox
Present address: Perlegen Sciences Inc., 2021 Stierlin Court, Mountain View, California, 94943, USA - John D. McPherson
Present address: Baylor College of Medicine, 1 Baylor Plaza, Human Genome Sequencing Center, N1519, Houston, Texas, 77030, USA - Marco A. Marra
Present address: Genome Sciences Centre, British Columbia Cancer Agency, 600 West 10th Avenue, Room 3427, Vancouver, British Columbia, V5Z 4E6, Canada - Robert H. Waterston
Present address: Department of Genome Sciences, University of Washington, Box 357730, 1705 NE Pacific Street, Seattle, Washington, 98195-7730, USA
Authors and Affiliations
- Genome Sequencing Center, Washington University School of Medicine, Campus Box 8501, 4444 Forest Park Avenue, St. Louis, Missouri, 63108, USA
LaDeana W. Hillier, Tina A. Graves, Robert S. Fulton, Lucinda A. Fulton, Kymberlie H. Pepin, Patrick Minx, Caryn Wagner-McPherson, Dan Layman, Kristine Wylie, Mandeep Sekhon, Michael C. Becker, Ginger A. Fewell, Kimberly D. Delehaunty, Tracie L. Miner, William E. Nash, Colin Kremitzki, Lachlan Oddy, Hui Du, Hui Sun, Holland Bradshaw-Cordum, Johar Ali, Jason Carter, Matt Cordes, Anthony Harris, Amber Isak, Andrew van Brunt, Christine Nguyen, Feiyu Du, Laura Courtney, Joelle Kalicki, Philip Ozersky, Scott Abbott, Jon Armstrong, Edward A. Belter, Lauren Caruso, Maria Cedroni, Marc Cotton, Teresa Davidson, Anu Desai, Glendoria Elliott, Thomas Erb, Catrina Fronick, Tony Gaige, William Haakenson, Krista Haglund, Andrea Holmes, Richard Harkins, Kyung Kim, Scott S. Kruchowski, Cynthia Madsen Strong, Neenu Grewal, Ernest Goyea, Shunfang Hou, Andrew Levy, Scott Martinka, Kelly Mead, Michael D. McLellan, Rick Meyer, Jennifer Randall-Maher, Chad Tomlinson, Sara Dauphin-Kohlberg, Amy Kozlowicz-Reilly, Neha Shah, Sharhonda Swearengen-Shahid, Jacqueline Snider, Joseph T. Strong, Johanna Thompson, Martin Yoakum, Shawn Leonard, Charlene Pearman, Lee Trani, Maxim Radionenko, Jason E. Waligorski, Chunyan Wang, Susan M. Rock, Aye-Mon Tin-Wollam, Rachel Maupin, Phil Latreille, Michael C. Wendl, Shiaw-Pyng Yang, Craig Pohl, John W. Wallis, John Spieth, Tamberlyn A. Bieri, Nicolas Berkowicz, Joanne O. Nelson, John Osborne, Li Ding, Rekha Meyer, Aniko Sabo, Yoram Shotland, Prashant Sinha, Patricia E. Wohldmann, Lisa L. Cook, Matthew T. Hickenbotham, James Eldred, Donald Williams, John D. McPherson, Elaine R. Mardis, Sandra W. Clifton, Wesley C. Warren, Asif T. Chinwalla, Marco A. Marra, Robert H. Waterston & Richard K. Wilson - Howard Hughes Medical Institute and Department of Genetics, Washington University School of Medicine, St. Louis, Missouri, 63110, USA
Thomas A. Jones & Sean R. Eddy - Genome Sciences, University of Washington School of Medicine, Seattle, Washington, 98195, USA
Xinwei She & Evan E. Eichler - EMBL, Meyerhofstrasse 1, 69117, Heidelberg, Germany
Francesca D. Ciccarelli, Elisa Izaurralde, Peer Bork, Mikita Suyama & David Torrents - Center for Comparative Genomics and Bioinformatics, Departments of Biology and Computer Science, Pennsylvania State University, University Park, Pennsylvania, 16802, USA
James Taylor & Webb Miller - Stanford Human Genome Center, Department of Genetics, Stanford University School of Medicine, Stanford, California, 94305, USA
Jeremy Schmutz, Richard M. Myers & David R. Cox - Department of Computer Science, Iowa State University, Ames, Iowa, 50011-1040, USA
Xiaoqiu Huang - EEBI Division and Genome Biology Division, Lawrence Livermore National Laboratory, Livermore, California, 94550, USA
Ivan Ovcharenko - Center for Biomolecular Science and Engineering, University of California, Santa Cruz, California, 95064, USA
Terrence S. Furey
Authors
- LaDeana W. Hillier
You can also search for this author inPubMed Google Scholar - Tina A. Graves
You can also search for this author inPubMed Google Scholar - Robert S. Fulton
You can also search for this author inPubMed Google Scholar - Lucinda A. Fulton
You can also search for this author inPubMed Google Scholar - Kymberlie H. Pepin
You can also search for this author inPubMed Google Scholar - Patrick Minx
You can also search for this author inPubMed Google Scholar - Caryn Wagner-McPherson
You can also search for this author inPubMed Google Scholar - Dan Layman
You can also search for this author inPubMed Google Scholar - Kristine Wylie
You can also search for this author inPubMed Google Scholar - Mandeep Sekhon
You can also search for this author inPubMed Google Scholar - Michael C. Becker
You can also search for this author inPubMed Google Scholar - Ginger A. Fewell
You can also search for this author inPubMed Google Scholar - Kimberly D. Delehaunty
You can also search for this author inPubMed Google Scholar - Tracie L. Miner
You can also search for this author inPubMed Google Scholar - William E. Nash
You can also search for this author inPubMed Google Scholar - Colin Kremitzki
You can also search for this author inPubMed Google Scholar - Lachlan Oddy
You can also search for this author inPubMed Google Scholar - Hui Du
You can also search for this author inPubMed Google Scholar - Hui Sun
You can also search for this author inPubMed Google Scholar - Holland Bradshaw-Cordum
You can also search for this author inPubMed Google Scholar - Johar Ali
You can also search for this author inPubMed Google Scholar - Jason Carter
You can also search for this author inPubMed Google Scholar - Matt Cordes
You can also search for this author inPubMed Google Scholar - Anthony Harris
You can also search for this author inPubMed Google Scholar - Amber Isak
You can also search for this author inPubMed Google Scholar - Andrew van Brunt
You can also search for this author inPubMed Google Scholar - Christine Nguyen
You can also search for this author inPubMed Google Scholar - Feiyu Du
You can also search for this author inPubMed Google Scholar - Laura Courtney
You can also search for this author inPubMed Google Scholar - Joelle Kalicki
You can also search for this author inPubMed Google Scholar - Philip Ozersky
You can also search for this author inPubMed Google Scholar - Scott Abbott
You can also search for this author inPubMed Google Scholar - Jon Armstrong
You can also search for this author inPubMed Google Scholar - Edward A. Belter
You can also search for this author inPubMed Google Scholar - Lauren Caruso
You can also search for this author inPubMed Google Scholar - Maria Cedroni
You can also search for this author inPubMed Google Scholar - Marc Cotton
You can also search for this author inPubMed Google Scholar - Teresa Davidson
You can also search for this author inPubMed Google Scholar - Anu Desai
You can also search for this author inPubMed Google Scholar - Glendoria Elliott
You can also search for this author inPubMed Google Scholar - Thomas Erb
You can also search for this author inPubMed Google Scholar - Catrina Fronick
You can also search for this author inPubMed Google Scholar - Tony Gaige
You can also search for this author inPubMed Google Scholar - William Haakenson
You can also search for this author inPubMed Google Scholar - Krista Haglund
You can also search for this author inPubMed Google Scholar - Andrea Holmes
You can also search for this author inPubMed Google Scholar - Richard Harkins
You can also search for this author inPubMed Google Scholar - Kyung Kim
You can also search for this author inPubMed Google Scholar - Scott S. Kruchowski
You can also search for this author inPubMed Google Scholar - Cynthia Madsen Strong
You can also search for this author inPubMed Google Scholar - Neenu Grewal
You can also search for this author inPubMed Google Scholar - Ernest Goyea
You can also search for this author inPubMed Google Scholar - Shunfang Hou
You can also search for this author inPubMed Google Scholar - Andrew Levy
You can also search for this author inPubMed Google Scholar - Scott Martinka
You can also search for this author inPubMed Google Scholar - Kelly Mead
You can also search for this author inPubMed Google Scholar - Michael D. McLellan
You can also search for this author inPubMed Google Scholar - Rick Meyer
You can also search for this author inPubMed Google Scholar - Jennifer Randall-Maher
You can also search for this author inPubMed Google Scholar - Chad Tomlinson
You can also search for this author inPubMed Google Scholar - Sara Dauphin-Kohlberg
You can also search for this author inPubMed Google Scholar - Amy Kozlowicz-Reilly
You can also search for this author inPubMed Google Scholar - Neha Shah
You can also search for this author inPubMed Google Scholar - Sharhonda Swearengen-Shahid
You can also search for this author inPubMed Google Scholar - Jacqueline Snider
You can also search for this author inPubMed Google Scholar - Joseph T. Strong
You can also search for this author inPubMed Google Scholar - Johanna Thompson
You can also search for this author inPubMed Google Scholar - Martin Yoakum
You can also search for this author inPubMed Google Scholar - Shawn Leonard
You can also search for this author inPubMed Google Scholar - Charlene Pearman
You can also search for this author inPubMed Google Scholar - Lee Trani
You can also search for this author inPubMed Google Scholar - Maxim Radionenko
You can also search for this author inPubMed Google Scholar - Jason E. Waligorski
You can also search for this author inPubMed Google Scholar - Chunyan Wang
You can also search for this author inPubMed Google Scholar - Susan M. Rock
You can also search for this author inPubMed Google Scholar - Aye-Mon Tin-Wollam
You can also search for this author inPubMed Google Scholar - Rachel Maupin
You can also search for this author inPubMed Google Scholar - Phil Latreille
You can also search for this author inPubMed Google Scholar - Michael C. Wendl
You can also search for this author inPubMed Google Scholar - Shiaw-Pyng Yang
You can also search for this author inPubMed Google Scholar - Craig Pohl
You can also search for this author inPubMed Google Scholar - John W. Wallis
You can also search for this author inPubMed Google Scholar - John Spieth
You can also search for this author inPubMed Google Scholar - Tamberlyn A. Bieri
You can also search for this author inPubMed Google Scholar - Nicolas Berkowicz
You can also search for this author inPubMed Google Scholar - Joanne O. Nelson
You can also search for this author inPubMed Google Scholar - John Osborne
You can also search for this author inPubMed Google Scholar - Li Ding
You can also search for this author inPubMed Google Scholar - Rekha Meyer
You can also search for this author inPubMed Google Scholar - Aniko Sabo
You can also search for this author inPubMed Google Scholar - Yoram Shotland
You can also search for this author inPubMed Google Scholar - Prashant Sinha
You can also search for this author inPubMed Google Scholar - Patricia E. Wohldmann
You can also search for this author inPubMed Google Scholar - Lisa L. Cook
You can also search for this author inPubMed Google Scholar - Matthew T. Hickenbotham
You can also search for this author inPubMed Google Scholar - James Eldred
You can also search for this author inPubMed Google Scholar - Donald Williams
You can also search for this author inPubMed Google Scholar - Thomas A. Jones
You can also search for this author inPubMed Google Scholar - Xinwei She
You can also search for this author inPubMed Google Scholar - Francesca D. Ciccarelli
You can also search for this author inPubMed Google Scholar - Elisa Izaurralde
You can also search for this author inPubMed Google Scholar - James Taylor
You can also search for this author inPubMed Google Scholar - Jeremy Schmutz
You can also search for this author inPubMed Google Scholar - Richard M. Myers
You can also search for this author inPubMed Google Scholar - David R. Cox
You can also search for this author inPubMed Google Scholar - Xiaoqiu Huang
You can also search for this author inPubMed Google Scholar - John D. McPherson
You can also search for this author inPubMed Google Scholar - Elaine R. Mardis
You can also search for this author inPubMed Google Scholar - Sandra W. Clifton
You can also search for this author inPubMed Google Scholar - Wesley C. Warren
You can also search for this author inPubMed Google Scholar - Asif T. Chinwalla
You can also search for this author inPubMed Google Scholar - Sean R. Eddy
You can also search for this author inPubMed Google Scholar - Marco A. Marra
You can also search for this author inPubMed Google Scholar - Ivan Ovcharenko
You can also search for this author inPubMed Google Scholar - Terrence S. Furey
You can also search for this author inPubMed Google Scholar - Webb Miller
You can also search for this author inPubMed Google Scholar - Evan E. Eichler
You can also search for this author inPubMed Google Scholar - Peer Bork
You can also search for this author inPubMed Google Scholar - Mikita Suyama
You can also search for this author inPubMed Google Scholar - David Torrents
You can also search for this author inPubMed Google Scholar - Robert H. Waterston
You can also search for this author inPubMed Google Scholar - Richard K. Wilson
You can also search for this author inPubMed Google Scholar
Corresponding author
Correspondence toRichard K. Wilson.
Ethics declarations
Competing interests
The authors declare that they have no competing financial interests.
Supplementary information
Supplementary Notes
Supplementary Notes and Supplementary Methods with additional relevant references. (DOC 173 kb)
Supplementary Figure S1
Comparison of mapped positions of deCODE STSs and their location within the (a) chromosome 2 and (b) chromosome 4 sequences. The apparent break at 90 Mb (a) and 50 Mb (b) reflects the position of the centomere. (PDF 114 kb)
Supplementary Figure S2
Sequence identity distribution of segmental duplications. For all pairwise alignments, the total number of aligned bases was calculated and binned based on percent sequence identity. Sequence identity distributions for interchromsomally (red) and intrachromosomally (blue) duplicated bases are shown. (PDF 14 kb)
Supplementary Figure S3
Pattern of recent segmental duplications on chromosome 2 and chromosome 4. Large (≳10 kb) highly-similar (≳95%) intrachromosomal (blue) and interchromosomal (red) segmental duplications are shown for chromosome 2 (a) and chromosome 4 (b). (PDF 115 kb)
Supplementary Figure S4
Location and % identity of segmental duplications on chromosome 2. Interchromosomal (red bars) and intrachromsomal (blue bars) are represented along the horizontal line (0.2 Mb increments). (PDF 204 kb)
Supplementary Figure S5
Location and % identity of segmental duplications on chromosome b) 4. Interchromosomal (red bars) and intrachromsomal (blue bars) are represented along the horizontal line (0.2 Mb increments). (PDF 159 kb)
Supplementary Table S1
Contiguous sequence accessions and lengths for chromosome 2 and 4 sequences. Estimated gap sizes are also included as estimated by FISH and by orthologous mouse and rat sequences. (DOC 77 kb)
Supplementary Table S2
Brief summary of repetitive content of chromosomes 2 and 4. (DOC 21 kb)
Supplementary Table S3
Recombination rates for human chromosomes 2 and 4 based on deCODE and Genethon genetic maps. (DOC 156 kb)
Supplementary Table S4
Known mRNAs that had no match at all to the mouse or rat genomes or their protein sets. The chromosome, gi identifier for the mRNA, number of coding exons, amino acid length, interpro domains, comments, and information on gi's for which we obtained sequences for the mRNA in multiple primates. (XLS 18 kb)
Supplementary Table S5
Additional details to support Table 1 in main text related to polymorphic mRNAs detected on human chromosomes 2 and 4. (DOC 26 kb)
Supplementary Table S6
Fraction of duplicated basepairs. The percentage of non-redundant duplications (≳90% sequence identity; ≳1 kb in length) were based on the total genome size 2,865,069,170, chromosome 2 size 237,541,603 and chromosome 4 size 186,841,959. (XLS 17 kb)
Supplementary Table S7
Accessions identifying regions containing highly polymorphic overlap regions. The chromosome and starting and ending positions of those highly polymorphic overlap regions are provided for human genome build35/hg17. General observations of sequence features in the region including gene content are also provided. (DOC 30 kb)
Supplementary Table S8
Positions of possible human deletions based on fosmid-end placements. (DOC 43 kb)
Supplementary Table S9
Polymorphisms detected from fosmid paired-end placements and verified by fosmid clone-based sequencing. The Broad Institute library fosmid name, fosmid clone accession, and a description of each polymorphism are provided. (DOC 21 kb)
Supplementary Table S10
Distribution of non-redundant known genes and spliced ESTs within duplicated regions of chromosomes 2 and 4. The non-redundant transcript set was screened for confirmatory transcriptional support by best genomic placement of EST. The spliced EST and transcripts required at least two exons and evidence of splicing (two or more exons). In addition, each gene feature was binned as duplicated if at least 50 bp overlapped a duplicated region. Thus, exons less than 50bp were not included in this analysis. Known gene + EST is composed of non-redundant known gene and spliced EST transcription. Duplicated known genes and their coordinates are listed. (XLS 204 kb)
Rights and permissions
About this article
Cite this article
Hillier, L., Graves, T., Fulton, R. et al. Generation and annotation of the DNA sequences of human chromosomes 2 and 4.Nature 434, 724–731 (2005). https://doi.org/10.1038/nature03466
- Received: 25 October 2004
- Accepted: 11 February 2005
- Issue Date: 07 April 2005
- DOI: https://doi.org/10.1038/nature03466