An expansive human regulatory lexicon encoded in transcription factor footprints (original) (raw)
Main

ENCODE Encyclopedia of DNA Elements nature.com/encode
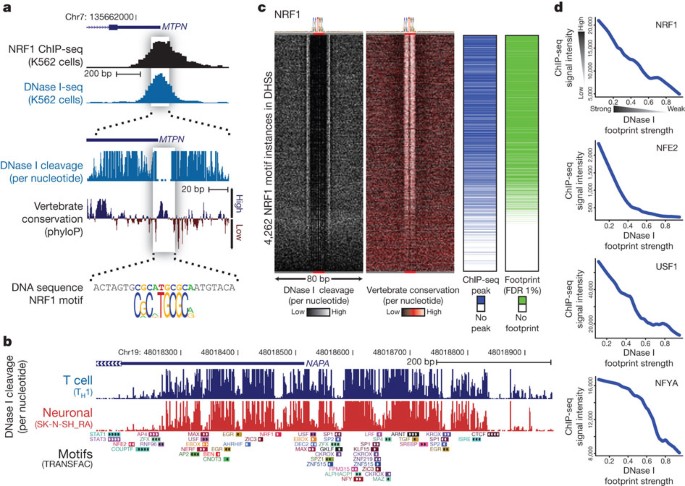
Sequence-specific transcription factors interpret the signals encoded within regulatory DNA. The discovery of DNase I footprinting over 30 years ago1 revolutionized the analysis of _cis_-regulatory sequences in diverse organisms, and directly enabled the discovery of the first human sequence-specific transcription factors2. Binding of transcription factors to regulatory DNA regions in place of canonical nucleosomes triggers chromatin remodelling, resulting in nuclease hypersensitivity3. Within DNase I hypersensitive sites (DHSs), DNase I cleavage is not uniform; rather, punctuated binding by sequence-specific regulatory factors occludes bound DNA from cleavage, leaving footprints that demarcate transcription factor occupancy at nucleotide resolution1,4 (Fig. 1a). DNase I footprinting has been applied widely to study the dynamics of transcription factor occupancy and cooperativity within regulatory DNA regions of individual genes5, and to identify cell- and lineage-selective transcriptional regulators6.
Figure 1: Parallel profiling of genomic regulatory factor occupancy across 41 cell types.
a, DNase I footprinting of K562 cells identifies the individual nucleotides within the MTPN promoter that are bound by NRF1. b, Example locus harbouring eight clearly defined DNase I footprints in T-helper type 1 (TH1) and SK-N-SH_RA cells, with TRANSFAC database motif instances indicated below. c, Heat maps showing per-nucleotide DNase I cleavage (left) and vertebrate conservation by phyloP (right) for 4,262 NRF1 motifs within K562 DHSs ranked by the local density of DNase I cleavages. Green ticks indicate the presence of DNase I footprints over motif instances. Blue ticks indicate the presence of ChIP-seq peaks over the motif instances. d, Lowess regression of NRF1, USF1, NFE2 and NFYA K562 ChIP-seq signal intensities versus DNase I footprinting occupancy (footprint occupancy score) at K562 DNase I footprints containing NRF1, USF, NFE2 and NFYA motifs.
Regulatory DNA is populated with DNase I footprints
To map DNase I footprints comprehensively within regulatory DNA, we adapted digital genomic footprinting4 to human cells. The ability to resolve DNase I footprints sensitively and precisely is critically dependent on the local density of mapped DNase I cleavages (Supplementary Fig. 1a–d), and efficient footprinting of a large genome such as human requires substantial concentration of DNase I cleavages within the small fraction (13%) of the genome contained in DNase I-hypersensitive regions. We selected highly enriched DNase I cleavage libraries from 41 diverse cell types in which 5381% of DNase I cleavage sites localized to DNase I-hypersensitive regions[7](/articles/nature11212#ref-CR7 "Thurman, R. E. et al. The accessible chromatin landscape of the human genome. Nature http://dx.doi.org/10.1038/nature11232
(this issue)") ([Supplementary Table 1](/articles/nature11212#MOESM253)), representing nearly tenfold higher signal-to-noise ratio than previous results from yeast[4](/articles/nature11212#ref-CR4 "Hesselberth, J. R. et al. Global mapping of protein-DNA interactions in vivo by digital genomic footprinting. Nature Methods 6, 283–289 (2009)"), and two- to fivefold greater enrichment than achieved using end-capture of single DNase I cleavages[8](/articles/nature11212#ref-CR8 "Sabo, P. J. et al. Discovery of functional noncoding elements by digital analysis of chromatin structure. Proc. Natl Acad. Sci. USA 101, 16837–16842 (2004)"),[9](/articles/nature11212#ref-CR9 "Boyle, A. P. et al. High-resolution mapping and characterization of open chromatin across the genome. Cell 132, 311–322 (2008)"). We then performed deep sequencing of these libraries, and obtained 14.9 billion Illumina sequence reads, 11.2 billion of which mapped to unique locations in the human genome ([Supplementary Table 1](/articles/nature11212#MOESM253)). We achieved an average sequencing depth of ∼ 273 million DNase I cleavages per cell type that enabled extensive and accurate discrimination of DNase I footprints.To detect DNase I footprints systematically, we implemented a detection algorithm based on the original description of quantitative DNase I footprinting1 (Supplementary Methods). We identified an average of 1.1 million high-confidence (false discovery rate (FDR) of 1%) footprints per cell type (range 434,000 to 2.3 million; Supplementary Table 1), and collectively 45,096,726 640-base pair (bp) footprint events across all cell types. We resolved cell-selective footprint patterns to reveal 8.4 million distinct elements with a footprint, each occupied in one or more cell type. At least one footprint was found in 75% of DHSs (Supplementary Fig. 1c, d and Supplementary Table 2), with detection strongly dependent on the number of mapped DNase I cleavages within each DHS. 99.8% of DHSs with 250 mapped DNase I cleavages contained at least one footprint, indicating that DHSs are not simply open or nucleosome-free chromatin features, but are constitutively populated with DNase I footprints. Modelling DNase I cleavage patterns using empirically derived intrinsic DNA cleavage propensities for DNase I showed that only a miniscule fraction (0.24%) of discovered 1% FDR footprints from cell and tissue samples could be caused by inherent DNase I sequence specificity (Supplementary Methods).
DNase I footprints were distributed throughout the genome, including intergenic regions (45.7%), introns (37.7%), upstream of transcriptional start sites (TSSs, 8.9%), and in 5′ and 3′ untranslated regions (UTRs, 1.4% and 1.3%, respectively; Supplementary Fig. 2a, b). DNase I footprints were enriched in promoters (3.6-fold; P < 2.2 × 10⁻¹⁶; Binomial test) and 5′ UTRs (2.4-fold; P < 2.2 × 10⁻¹⁶; Binomial test), commensurate with high DNase I cleavage densities observed in these regions. We found that 2.0% of footprints localized within exons, raising the possibility that occupancy by DNA binding proteins could further restrict sequence diversity within coding DNA, thus superimposing an unexpected layer of constraint on codon usage.
Footprints are quantitative markers of factor occupancy
We next examined the correspondence between DNase I footprints and known regulatory factor recognition sequences within DNase I hypersensitive chromatin. Comprehensive scans of DNase I hypersensitive regions for high-confidence matches to all recognized transcription factor motifs in the TRANSFAC10 and JASPAR11 databases revealed a striking enrichment of motifs within footprints (P ≈ 0, _z_-score = 204.22 for TRANSFAC; _z_-score = 169.88 for JASPAR; Fig. 1b and Supplementary Fig. 3).
To quantify the occupancy at transcription factor recognition sequences within DHSs genome-wide, we computed for each instance a footprint occupancy score (FOS) relating the density of DNase I cleavages within the core recognition motif to cleavages in the immediately flanking regions (Supplementary Methods). The FOS can be used to rank motif instances by the depth of the footprint at that position, and is expected to provide a quantitative measure of factor occupancy1. To examine this relationship for a well-studied sequence-specific regulator (NRF1; ref. 12), we plotted DNase I cleavage patterns surrounding all 4,262 NRF1 motifs contained within DHSs and ranked these by FOS. Whereas only a subset of these motif instances (2,351) coincided with high-confidence footprints, the vast majority of NRF1 motif instances in DNase I footprints (89%) overlapped reproducible sites of NRF1 occupancy identified by chromatin immunoprecipitation followed by high-throughput sequencing (ChIP-seq) (Fig. 1c). In parallel, we analysed nucleotide-level evolutionary conservation patterns around NRF1-binding sites, revealing that FOS closely parallels phylogenetic conservation within the core motif region, indicating strong selection on factor occupancy (Fig. 1c). We observed a nearly monotonic relationship between FOS and ChIP-seq signal intensities at NRF1-binding sites within DNase I footprints of K562 cells (Fig. 1d). Similarly strong correlations between footprint occupancy and either ChIP-seq signal or phylogenetic conservation were evident for diverse factors (Fig. 1d and Supplementary Fig. 4a–d). We found that footprint occupancy and nucleotide-level conservation correlated for 80% of all transcription factor motifs in the TRANSFAC database, of which 50% were statistically significant (P < 0.05; Supplementary Methods). This relationship between footprint occupancy and conservation is most readily explained by evolutionary selection on factor occupancy, with higher conservation of higher affinity binding sites. Taken together, these results indicate that footprint occupancy provides a quantitative measure of sequence-specific regulatory factor occupancy that closely parallels evolutionary constraint and ChIP-seq signal intensity.
To validate the potential for selective binding of footprints by factors predicted on the basis of motif-to-footprint matching, we developed an approach to quantify specific occupancy in the context of a complex transcription factor milieu using targeted mass spectrometry (DNA interacting protein precipitation or DIPP; Methods). Using DIPP, we affirmed specific binding by several different classes of transcription factor (Supplementary Fig. 5a–e). Together with the analysis of ChIP-seq data described above, these results indicate that the localization of transcription factor recognition motifs within DNase I footprints can accurately illuminate the genomic protein occupancy landscape.
Footprints harbour functional SNVs and lack methylation
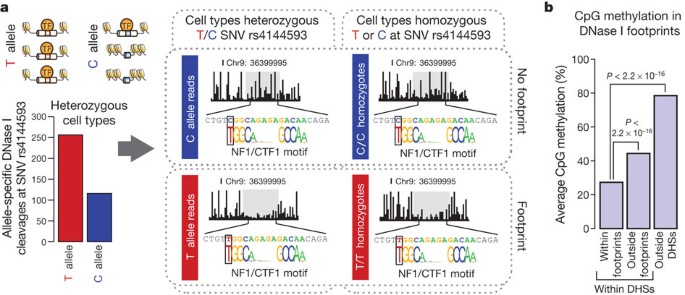
The potential for single nucleotide variants (SNVs) within a transcription factor recognition sequence to abrogate binding of its cognate factor is well known13. The depth of sequencing performed in the context of our footprinting experiments provided hundreds- to thousands-fold coverage of most DHSs, enabling precise quantification of allelic imbalance within DHSs harbouring heterozygous variants. We scanned all DHSs for heterozygous SNVs identified by the 1000 Genomes Project14 and measured, for each DHS containing a single heterozygous variant, the proportion of reads from each allele. We identified likely functional variants conferring significant allelic imbalance in chromatin accessibility and analysed their distribution relative to DNase I footprints. This analysis revealed significant enrichment (P < 2.2 × 10⁻¹⁶; Fishers exact test) of such variants within DNase I footprints (Supplementary Fig. 6). For example, rs4144593 is a common T-to-C (T/C) variant that lies within a DHS on chromosome 9. This variant falls on a high-information position within a footprint containing an NF1/CTF1 motif and substantially disrupts footprinting of this motif, resulting in allelic imbalance in chromatin accessibility (Fig. 2a).
Figure 2: DNase I footprints mark sites of in vivo protein occupancy.
a, Schematic and plots showing the effect of T/C SNV rs4144593 on protein occupancy and chromatin accessibility. The y axis of the bar graph shows the number of DNase I cleavage events containing either the T or C allele. Middle plots show T or C allele-specific DNase I cleavage profiles from ten cell lines heterozygous for the T/C alleles at rs4144593. Right plots show DNase I cleavage profiles from 18 cell lines homozygous for the C allele at rs4144593 and one cell line homozygous for the T allele at rs4144593. Cleavage plots are cut off at 60% cleavage height. b, The average CpG methylation within IMR90 DNase I footprints, IMR90 DHSs (but not in footprints) and non-hypersensitive genomic regions in IMR90 cells. CpG methylation is significantly depleted in DNase I footprints (P < 2.2 × 10⁻¹⁶, MannWhitney _U_-test).
Protein–DNA interactions are also sensitive to cytosine methylation15,16. Comparing DNase I footprints and whole-genome bisulphite sequencing methylation data from pulmonary fibroblasts (IMR90), we found that CpG dinucleotides contained within DNase I footprints were significantly less methylated than CpGs in non-footprinted regions of the same DHS (MannWhitney _U_-test; P < 2.2 × 10⁻¹⁶; Fig. 2b). Footprints therefore seem to be selectively sheltered from DNA methylation, indicating a widespread connection between regulatory factor occupancy and nucleotide-level patterning of epigenetic modifications.
Transcription factor structure is imprinted on the genome
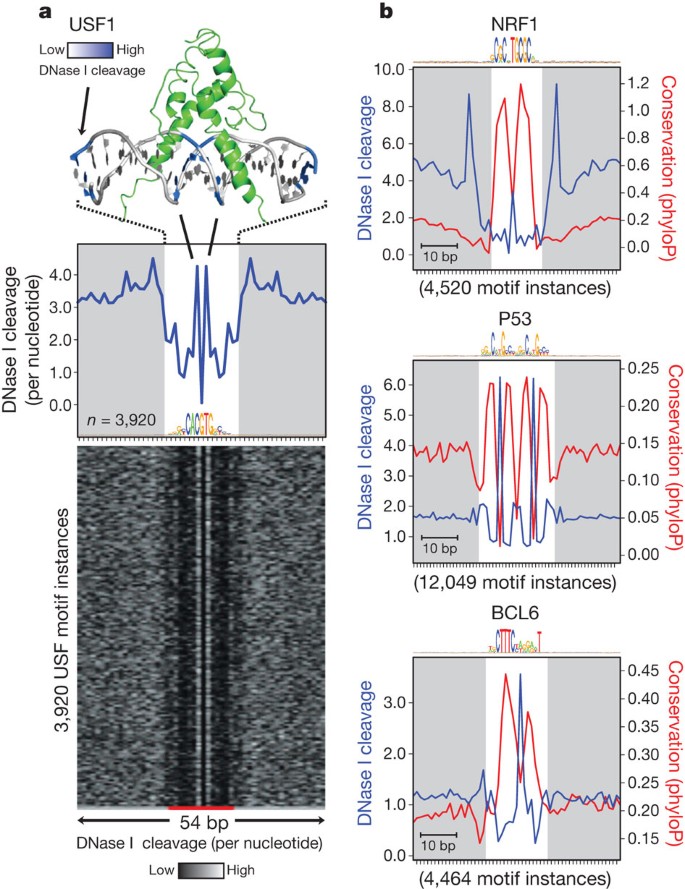
We observed surprisingly heterogeneous base-to-base variation in DNase I cleavage rates within the footprinted recognition sequences of different regulatory factors. And yet, the per site cleavage profiles for individual factors were highly stereotyped, with nearly identical local cleavage patterns at thousands of genomic locations (Supplementary Fig. 7). This raised the possibility that DNase I cleavage patterns may provide information concerning the morphology of the DNAprotein interface. We obtained the available DNAprotein co-crystal structures for human transcription factors, and mapped aggregate DNase I cleavage patterns at individual nucleotide positions onto the DNA backbone of the co-crystal model. Figure 3a and Supplementary Fig. 8a show two examples: USF1 (ref. 17) and SRF18. For both factors, DNase I cleavage patterns clearly parallel the topology of the protein–DNA interface, including a marked depression in DNase I cleavage at nucleotides involved in protein–DNA contact, and increased cleavage at exposed nucleotides such as those within the central pocket of the leucine zipper. These data show that nucleotide-level aggregate DNase I cleavage patterns reflect fundamental features of the protein–DNA interaction interface at unprecedented resolution.
Figure 3: Footprint structure parallels transcription factor structure and is imprinted on the human genome.
a, The co-crystal structure of upstream stimulatory factor (USF1) bound to its DNA ligand is juxtaposed above the average nucleotide-level DNase I cleavage pattern (blue) at motif instances of USF in DNase I footprints. Nucleotides that are sensitive to cleavage by DNase I are coloured blue on the co-crystal structure. The motif logo generated from USF DNase I footprints is displayed below the DNase I cleavage pattern. Below is a randomly ordered heat map showing the per-nucleotide DNase I cleavage for each motif instance of USF in DNase I footprints. b, The per-base DNase I hypersensitivity (blue) and vertebrate phylogenetic conservation (red) for all DNase I footprints in dermal fibroblasts matching three well-annotated transcription factor motifs. The white box indicates width of consensus motif. The number of motif occurrences within DNase I footprints is indicated below each graph.
We next asked how these patterns related to evolutionary conservation. Plotting nucleotide-level aggregate DNase I cleavage in parallel with per-nucleotide vertebrate conservation calculated by phyloP19 revealed striking antiparallel patterning of cleavage versus conservation across nearly all motifs examined (six representative examples are shown in Fig. 3b and Supplementary Fig. 8b). Notably, conservation is not limited to only DNA contacting protein residues, but exhibits graded changes that mirror DNase I accessibility across the entirety of the protein–DNA interface (Supplementary Figs 8c, d). Taken together, these results imply that regulatory DNA sequences have evolved to fit the continuous morphology of the transcription factorDNA binding interface.
A ∼50-bp footprint localizes transcription initiation
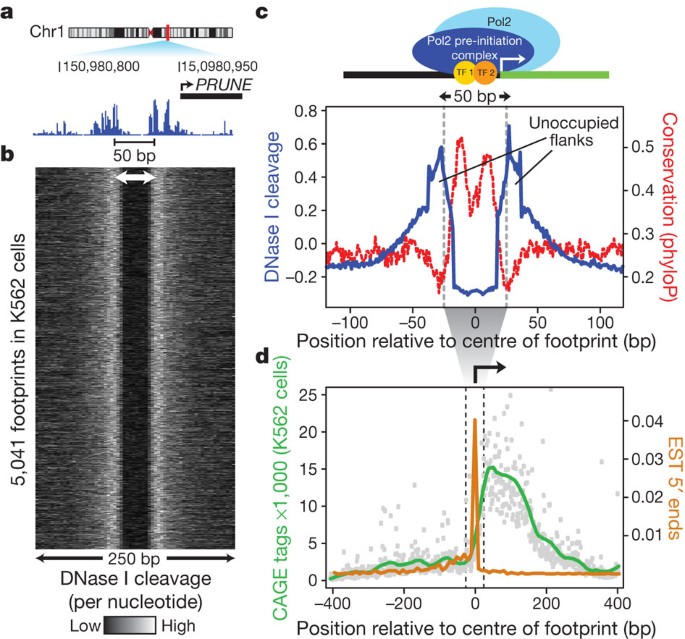
Transcription initiation requires the binding of multi-protein complexes that position RNA polymerase II20,21,22,23. Using a modified footprint detection algorithm designed to detect larger features (Supplementary Methods), we scanned the regions upstream from GENCODE TSSs and identified highly stereotyped ∼80-bp chromatin structure comprising a prominent 50-bp central DNase I footprint, flanked symmetrically by ∼15-bp regions of uniformly elevated levels of DNase I cleavage (Fig. 4a). Alignment of per-nucleotide DNase I cleavage profiles from 5,041 prominent footprints mapped in different K562 promoters highlights the homogeneous, nearly invariant nature of the structure (Fig. 4b).
Figure 4: A highly stereotyped chromatin structural motif marks sites of transcription initiation in human promoters.
a, A 3555-bp footprint is the predominant feature of many promoter DHSs and is in tight spatial coordination with the transcription start site. b, Heat map of the per-nucleotide DNase I cleavage pattern at 5,041 instances of this stereotypical footprint in K562 cells. c, Aggregate per-base DNase I cleavage profile (blue line) and mean per-nucleotide conservation score (phyloP) surrounding instances of this stereotypical footprint in K562 cells (red dashed line). d′, Aggregate strand corrected CAGE sequencing data (green line) and the average nearest 5′ end of a spliced EST (orange line) surrounding instances of this stereotypical footprint in K562 cells.
Plotting evolutionary conservation in parallel with DNase I cleavage revealed two distinct peaks in evolutionary conservation within the central footprint (Fig. 4c) compatible with binding sites for paired canonical sequence-specific transcription factors. The density of capped analysis of gene expression (CAGE) tags (Fig. 4d; green line) and 5′ ends of expressed sequenced tags (ESTs) (Fig. 4d; orange line) relative to the central 50-bp footprint revealed that, at the vast majority of promoters, RNA transcript initiation localized precisely within the stereotyped footprint. It is notable that the location of this footprint is often offset, typically 5′, from many GENCODE-annotated TSSs. This probably derives from the incomplete nature of many of the 5′ transcript ends used to define TSSs24.
These data together define a new high-resolution chromatin structural signature of transcription initiation and the interaction of the pre-initiation complex with the core promoter. Indeed, chromatin occupancy of TATA-binding protein (TBP), a critical component of the pre-initiation complex, is maximal precisely over the centre of the 50-bp footprint region (Supplementary Fig. 9a). Sequence analysis of the two conservation peaks within the 50-bp footprint identified motifs for GC-box-binding proteins such as SP1 and, less frequently, other general transcription factors (though with the notable absence of TATA motifs) (Supplementary Fig. 9b), indicating that TBP (and potentially other pre-initiation complex components) interacts preferentially with general transcriptional factors bound to GC-box-like features in the central footprinted region. The results are therefore consistent with a model in which a limited number of sequence-specific factors function both to prime the chromatin template for recruitment of RNA polymerase II and to guide transcriptional positioning.
Distinguishing indirect transcription factor occupancy
Many transcriptional regulators are posited to interact indirectly with the DNA sequence of some target sites through mechanisms such as tethering25. Approaches such as ChIP-seq detect chromatin occupancy, but cannot by themselves distinguish sites of direct DNA binding from non-canonical indirect binding. We therefore asked whether DNase I footprint data could illuminate ChIP-seq-derived occupancy profiles by differentiating directly bound factors from indirect binding events. We first partitioned ChIP-seq peaks from each of 38 ENCODE transcription factors[26](/articles/nature11212#ref-CR26 "ENCODE Project Consortium An integrated encyclopedia of DNA elements in the human genome. Nature http://dx.doi.org/10.1038/nature11247
(this issue)") mapped in K562 cells into three categories of predicted sites: ChIP-seq peaks containing a compatible footprinted motif (directly bound sites); ChIP-seq peaks lacking a compatible motif or footprint (indirectly bound sites); and ChIP-seq peaks overlying a compatible motif lacking a footprint (indeterminate sites). Predicted indirect sites showed significantly reduced ChIP-seq signal compared with predicted directly bound sites ([Supplementary Fig. 10](/articles/nature11212#MOESM253)), consistent with lack of direct crosslinking to DNA (and therefore reduced ChIP efficiency). Indeterminate sites exhibited low ChIP-seq signal and were therefore excluded from further analysis ([Supplementary Fig. 10](/articles/nature11212#MOESM253)).The fraction of ChIP-seq peaks predicted to represent direct versus indirect binding varied widely between different factors, ranging from nearly complete direct sequence-specific binding (for example, CTCF), to nearly complete indirect binding (for example, TBP; Supplementary Fig. 11). In many cases factors that preferentially engage in direct DNA binding at distal sites show predominantly indirect occupancy in promoter regions and vice versa (Supplementary Fig. 12a, b).
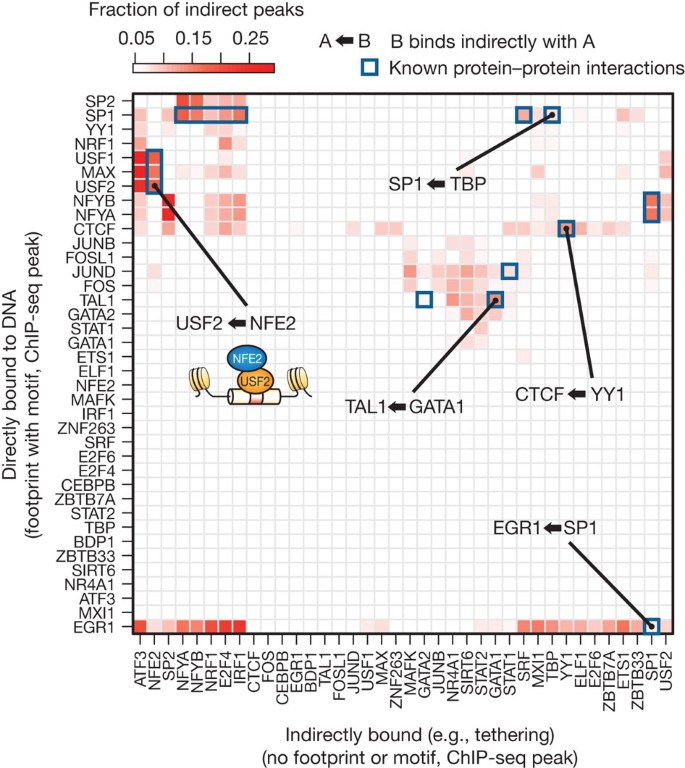
Next, we analysed the frequency with which indirectly bound sites of one transcription factor coincided with directly bound sites of a second factor, indicative of protein–protein interactions (for example, tethering). This analysis recovered many known protein–protein interactions, such as CTCFYY1 and TAL1GATA1 (ref. 27), as well as many novel associations (Fig. 5). We observed enrichment for NFE2 indirect interactions at promoter-bound USF2 sites, compatible with their known interaction28. At distal sites, we observed the opposite, with NFE2 predominantly directly bound accompanied by USF2 indirect peaks (Supplementary Fig. 12a, b), indicating the possibility of a reciprocal or looping mechanism. Notably, directly bound promoter-predominant transcription factors were enriched for co-localization with indirect peaks compared to distal regions (Supplementary Fig. 13a, b). These results suggest that combining DNase I footprinting with ChIP-seq has the potential to expose a previously unappreciated landscape of complex transcription factor occupancy modes.
Figure 5: Distinguishing direct and indirect binding of transcription factors.
Heat map of the enrichment of pairs of transcription factors in a direct–indirect association. Direct peaks are defined by ChIP occupancy accompanied by a footprint overlapping a compatible motif. Indirect peaks do not have a compatible motif. The colour of each cell is determined by the fraction of indirect peaks that co-localize with the direct peaks of another factor.
Footprints encode an expansive _cis_-regulatory lexicon
Since the discovery of the first sequence-specific transcription factor29, considerable effort has been devoted to identifying the cognate recognition sequences of DNA-binding proteins30,31. Despite these efforts, high-quality motifs are available for only a minority of the >1,400 human transcription factors with predicted sequence-specific DNA binding domains32.
We reasoned that the genomic sequence compartment defined by DNase I footprints in a given cell type ideally should contain much, if not all, of the factor recognition sequence information relevant for that cell type. Consequently, applying de novo motif discovery to the footprint compartments gleaned from multiple cell types should greatly expand our current knowledge of biologically active transcription factor binding motifs.
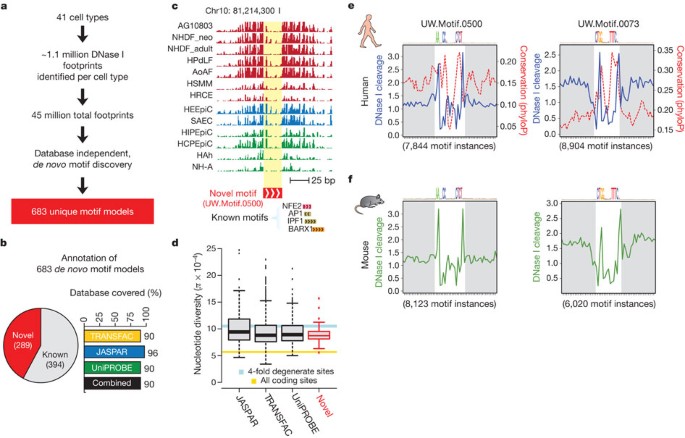
We performed unbiased de novo motif discovery within the footprints identified in each of the 41 cell types that yielded 683 unique motif models (Fig. 6a and Supplementary Methods). We compared these models with the universe of experimentally grounded motif models in the TRANSFAC, JASPAR and UniPROBE33 databases. Owing to the redundancy of motif models contained within these databases, we first collapsed all duplicate models (Supplementary Methods). A total of 394 of the 683 (58%) de novo motifs matched distinct experimentally grounded motif models, accounting collectively for 90% of all unique entries across the three databases (Fig. 6b and Supplementary Fig. 14a–c). The wholesale de novo derivation of the vast majority of known regulatory factor recognition sequences from the small genomic compartment defined by DNase I footprints highlights the marked concentration of regulatory information encoded within this sequence space.
Figure 6: De novo motif discovery expands the human regulatory lexicon.
a, Overview of de novo motif discovery using DNase I footprints. b, Annotation of the 683 _de novo_-derived motif models using previously identified transcription factor motifs. A total of 394 of these _de novo_-derived motifs match a motif annotated within the TRANSFAC, JASPAR or UniPROBE databases, whereas 289 are novel motifs (pie chart). The de novo consensus matching TRANSFAC, JASPAR or UniPROBE sequences cover the majority of each database (bar chart). c, Example of a DNase I footprint found in multiple cell types that is annotated solely by one of the novel _de novo_-derived motifs. d, Box-and-whisker plot comparing the average nucleotide diversity at instances of the 289 novel _de novo_-derived motif models to instances of motifs present in databases of known specificities (x axis). The box defines the 25% and 75% percentiles and the whiskers display 1.5 times the inner quartile range of the distribution of π values in each respective database. The blue bar indicates the average nucleotide diversity (π) at fourfold degenerate coding sites (width is equal to 95% confidence interval); gold bar indicates π at all coding sites (width is equal to 95% confidence interval). e, Phylogenetic conservation (red dashed) and per-base DNase I hypersensitivity (blue) for all DNase I footprints in dermal fibroblast cells matching two novel _de novo_-derived motifs. The white box indicates width of consensus motif. f, Per-nucleotide mouse liver DNase I cleavage patterns at occurrences of the motifs in e at DNase I footprints identified in mouse liver.
Notably, 289 of the footprint-derived motifs were absent from major databases (Fig. 6b and Supplementary Fig. 14d). These novel motifs populate millions of DNase I footprints (Fig. 6c), and show features of in vivo occupancy and evolutionary constraint similar to motifs for known regulators, including marked anti-correlation with nucleotide-level vertebrate conservation (Figs 3b, 6e and Supplementary Figs 8 and 15a).
To test whether novel motifs were functionally conserved in an evolutionarily distant mammal, we analysed DNase I cleavage patterns around human novel motifs mapped within DHSs assayed in primary mouse liver tissue (Fig. 6e, f and Supplementary Fig. 15a, b). This analysis demonstrated that many novel motifs show nearly identical DNase I footprint patterns in both human cells and mouse liver, indicating that these novel motifs correspond to evolutionarily conserved transcriptional regulators that are functional in both mouse and human.
Given the conservation of protein occupancy in a distant mammal, we assessed whether the novel motifs are under selection in human populations by analysing nucleotide diversity across all motif instances found within accessible chromatin. Using high-quality genomic sequence data from 53 unrelated individuals34 (Supplementary Table 4), we calculated the average nucleotide diversity35 for each individual motif space (Supplementary Fig. 15c). Reduced diversity levels are indicative of functional constraint, through the elimination of deleterious alleles from the population by natural selection. We found that novel motifs are collectively under strong purifying selection in human populations. On average, the new motifs are more constrained than most motifs found in the major databases (Fig. 6d and Supplementary Fig. 15c), even after exclusion of motifs containing highly mutable CpG dinucleotides, which underlie the marked increase in nucleotide diversity seen with a subset of known motifs (Supplementary Fig. 15c, right). Collectively, these results demonstrate that DNase I footprints encode an expansive _cis_-regulatory lexicon encompassing both known transcription factor recognition sequences and novel motifs that are functionally conserved in mouse and bear strong signatures of ongoing selection in humans.
Novel motif occupancy parallels regulators of cell fate
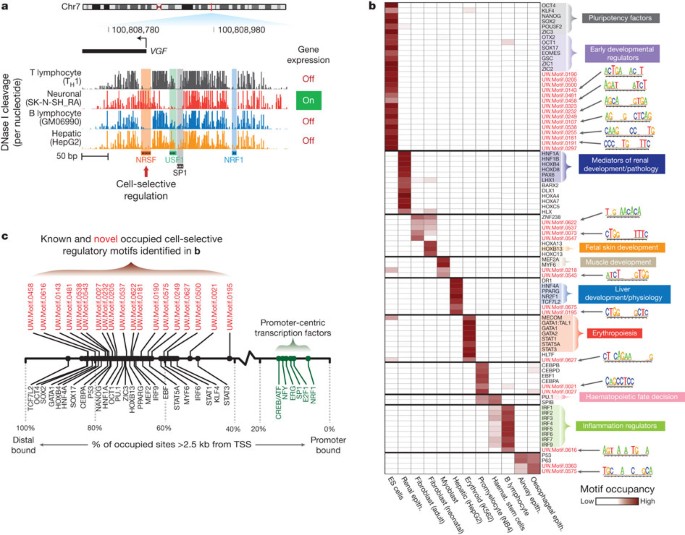
Cell-selective gene regulation is mediated by the differential occupancy of transcriptional regulatory factors at their cognate _cis_-acting elements. For example, the nerve growth factor gene VGF is selectively expressed only within neuronal cells (Fig. 7a), presumably due to the repressive action of the transcriptional regulator NRSF (also called REST) at the VGF promoter in non-neuronal cell types36. Although VGF is expressed only in neuronal cells, its promoter is DNase I-hypersensitive in most cell types (not shown). Examination of nucleotide-level cleavage patterns within the VGF promoter exposes its fundamental _cis_-regulatory logic, coordinated by the transcriptional regulators NRSF, SP1, USF1 and NRF1. Whereas the NRSF motif is tightly occupied in non-neuronal cells, in neuronal cells, NRSF repression is relieved, and recognition sites for the positive regulators USF1 and SP1 become highly occupied, resulting in VGF expression. These data collectively illustrate the power of genomic footprinting to resolve differential occupancy of multiple regulatory factors in parallel at nucleotide resolution.
Figure 7: Multi-lineage DNase I footprinting reveals cell-selective gene regulators.
a, Comparative footprinting of the nerve growth factor gene (VGF) promoter in multiple cell types reveals both conserved (NRF1, USF1 and SP1) and cell-selective (NRSF) DNase I footprints. b, Shown is a heat map of footprint occupancy computed across 12 cell types (columns) for 89 motifs (rows), including well-characterized cell/tissue-selective regulators, and novel _de novo_-derived motifs (red text). The motif models for some of these novel _de novo_-derived motifs are indicated next to the heat map. c, The proportion of motif instances in DNase I footprints within distal regulatory regions for known (black) and novel (red) cell-type-specific regulators in b is indicated. Also noted are these values for a small set of known promoter-proximal regulators (green). ES, embryonic stem.
We next extended this paradigm using genome-wide DNase I footprints across 12 functionally distinct cell types to identify both known and novel factors showing highly cell-specific occupancy patterns. To calculate the footprint occupancy of a motif, we enumerated for each motif and cell type the number of motif instances encompassed within DNase I footprints and normalized this by the total number of DNase I footprints in that cell type. Figure 7b shows a heat-map representation of cell-selective occupancy at motifs for 60 known transcriptional regulators and for 29 novel motifs. This approach appropriately identified a number of known cell-selective transcriptional regulators including: (1) the pluripotency factors OCT4 (also called POU5F1), SOX2, KLF4 and NANOG in human embryonic stem cells37; (2) the myogenic factors MEF2A and MYF6 in skeletal myocytes38; and (3) the erythrogenic regulators GATA1, STAT1 and STAT5A in erythroid cells39,40,41 (Fig. 7b).
Many of the footprint-derived novel motifs displayed markedly cell-selective occupancy patterns highly similar with the aforementioned well-established regulators. This suggests that many novel motifs correspond to recognition sequences for important but uncharacterized regulators of fundamental biological processes. Notably, both known and novel motifs with high cell-selective occupancy predominantly localized to distal regulatory regions (Fig. 7c), further highlighting the role of distal regulation in developmental and cell-selective processes42,43.
Perspective
We describe an expansive map of regulatory factor occupancy at millions of precisely demarcated sequence elements across the human genome revealed by genomic DNase I footprinting applied to a wide spectrum of cell types. These elements collectively define a highly information-rich genomic sequence compartment that encodes the recognition landscape of hundreds of DNA-binding proteins. This compartment has been extensively shaped by evolutionary forces to match closely the physical properties of its cognate interacting proteins. Mining footprint sequences for recognition motifs has nearly doubled the human _cis_-regulatory lexicon, exposing a previously hidden trove of elements with evolutionary, structural and functional profiles that parallel the collections of experimentally derived genomic regulators brought to light during the past 30 years. Because the ability to resolve footprints is dependent on sequencing depth, and the sequencing level of DNase I cleavage events in most DHSs is not saturating (even in cell types with >500 million mapped unique DNase I cleavages), the present study, although extensive in many respects, represents only an initial foray into this biologically rich space. Identification of the cognate DNA-binding proteins for novel recognition sequences presents a significant challenge, although one that can be addressed with confidence using emerging technologies and our extensive experimental data demonstrating both occupancy in vivo and strong evolutionary signatures of function. On a broader level, the approach that we describe here can, in principle, be applied to derive the _cis_-regulatory lexicon of any organism. We anticipate that the extensive new resources we describe, particularly in combination with other ENCODE data, will help to advance many aspects of human gene regulation research. Co-published ENCODE-related papers can be explored online via the Nature ENCODE explorer (http://www.nature.com/ENCODE), a specially designed visualization tool that allows users to access the linked papers and investigate topics that are discussed in multiple papers via thematically organized threads.
Methods Summary
DNase I digestion and high-throughput sequencing were performed on intact human nuclei from various cell types, following published methods4,44. Briefly, roughly 10 million cells were grown in appropriate culture media and nuclei were extracted using NP-40 in an isotonic buffer. The NP-40 detergent was removed and the nuclei were incubated for 3 min at 37 °C with limiting concentrations of the DNA endonuclease, DNase I (Sigma) supplemented with Ca2+ and Mg2+. The digestion was stopped with EDTA and the samples were treated with proteinase K. The small double-hit fragments (<500bp) were recovered by sucrose ultra-centrifugation, end-repaired and ligated with adapters compatible with the Illumina sequencing platform. High-quality libraries from each cell type were sequenced on the Illumina platform to an average depth of 273 million uniquely mapping single-end tags. The sequencing tags were aligned to the human reference genome and per-nucleotide cleavage counts were generated by summing the 5′ ends of the aligned sequencing tags at each position in the genome. FDR 1% DNase I footprints were identified using an iterative search method based on optimization of the footprint occupancy score. De novo motif discovery was performed using a full enumeration algorithm.
Accession codes
Primary accessions
Gene Expression Omnibus
Data deposits
All genomic DNase I footprinting sequence data are available through the NCBI Gene Expression Omnibus (GEO) data repository (accessions GSE26328 and GSE18927), and also through the UCSC browser under the Digital Genomic Footprinting (DGF) table designation. All other data are available through the ENCODE Consortium data release website (see Data Downloads in Supplementary Methods for URL).
References
- Galas, D. J. & Schmitz, A. DNAse footprinting: a simple method for the detection of protein-DNA binding specificity. Nucleic Acids Res. 5, 3157–3170 (1978)
Article CAS Google Scholar - Dynan, W. S. & Tjian, R. The promoter-specific transcription factor Sp1 binds to upstream sequences in the SV40 early promoter. Cell 35, 79–87 (1983)
Article CAS Google Scholar - Gross, D. S. & Garrard, W. T. Nuclease hypersensitive sites in chromatin. Annu. Rev. Biochem. 57, 159–197 (1988)
Article CAS Google Scholar - Hesselberth, J. R. et al. Global mapping of protein-DNA interactions in vivo by digital genomic footprinting. Nature Methods 6, 283–289 (2009)
Article CAS Google Scholar - Thanos, D. & Maniatis, T. βVirus induction of human IFN gene expression requires the assembly of an enhanceosome. Cell 83, 1091–1100 (1995)
Article CAS Google Scholar - Tsai, S. F. et al. Cloning of cDNA for the major DNA-binding protein of the erythroid lineage through expression in mammalian cells. Nature 339, 446–451 (1989)
Article CAS ADS Google Scholar - Thurman, R. E. et al. The accessible chromatin landscape of the human genome. Naturehttp://dx.doi.org/10.1038/nature11232 (this issue)
- Sabo, P. J. et al. Discovery of functional noncoding elements by digital analysis of chromatin structure. Proc. Natl Acad. Sci. USA 101, 16837–16842 (2004)
Article CAS ADS Google Scholar - Boyle, A. P. et al. High-resolution mapping and characterization of open chromatin across the genome. Cell 132, 311–322 (2008)
Article CAS Google Scholar - Matys, V. et al. TRANSFAC and its module TRANSCompel: transcriptional gene regulation in eukaryotes. Nucleic Acids Res. 34, D108–D110 (2006)
Article CAS ADS Google Scholar - Bryne, J. C. et al. JASPAR, the open access database of transcription factor-binding profiles: new content and tools in the 2008 update. Nucleic Acids Res. 36, D102–D106 (2008)
Article CAS Google Scholar - Chan, J. Y., Han, X. L. & Kan, Y. W. Cloning of Nrf1, an NF-E2-related transcription factor, by genetic selection in yeast. Proc. Natl Acad. Sci. USA 90, 11371–11375 (1993)
Article CAS ADS Google Scholar - Rockman, M. V. & Wray, G. A. Abundant raw material for cis-regulatory evolution in humans. Mol. Biol. Evol. 19, 1991–2004 (2002)
Article CAS Google Scholar - A map of human genome variation from population-scale sequencing. Nature 467, 1061–1073 (2010)
- Tate, P. H. & Bird, A. P. Effects of DNA methylation on DNA-binding proteins and gene expression. Curr. Opin. Genet. Dev. 3, 226–231 (1993)
Article CAS Google Scholar - Lister, R. et al. Human DNA methylomes at base resolution show widespread epigenomic differences. Nature 462, 315–322 (2009)
Article CAS ADS Google Scholar - Ferré-D'Amaré, A. R., Pognonec, P., Roeder, R. G. & Burley, S. K. Structure and function of the b/HLH/Z domain of USF. EMBO J. 13, 180–189 (1994)
Article Google Scholar - Pellegrini, L., Tan, S. & Richmond, T. J. Structure of serum response factor core bound to DNA. Nature 376, 490–498 (1995)
Article CAS ADS Google Scholar - Pollard, K. S., Hubisz, M. J., Rosenbloom, K. R. & Siepel, A. Detection of nonneutral substitution rates on mammalian phylogenies. Genome Res. 20, 110–121 (2010)
Article CAS Google Scholar - Pugh, B. F. & Tjian, R. Transcription from a TATA-less promoter requires a multisubunit TFIID complex. Genes Dev. 5, 1935–1945 (1991)
Article CAS Google Scholar - Kim, T. H. et al. A high-resolution map of active promoters in the human genome. Nature 436, 876–880 (2005)
Article CAS ADS Google Scholar - Buratowski, S., Hahn, S., Guarente, L. & Sharp, P. A. Five intermediate complexes in transcription initiation by RNA polymerase II. Cell 56, 549–561 (1989)
Article CAS Google Scholar - Kim, T. K. et al. Trajectory of DNA in the RNA polymerase II transcription preinitiation complex. Proc. Natl Acad. Sci. USA 94, 12268–12273 (1997)
Article CAS ADS Google Scholar - Affymetrix/Cold Spring Harbor Laboratory ENCODE Transcriptome Project ′Post-transcriptional processing generates a diversity of 5′-modified long and short RNAs. Nature 457, 1028–1032 (2009)
Article Google Scholar - Biddie, S. C. et al. Transcription factor AP1 potentiates chromatin accessibility and glucocorticoid receptor binding. Mol. Cell 43, 145–155 (2011)
Article CAS Google Scholar - ENCODE Project Consortium An integrated encyclopedia of DNA elements in the human genome. Naturehttp://dx.doi.org/10.1038/nature11247 (this issue)
- Wadman, I. A. et al. The LIM-only protein Lmo2 is a bridging molecule assembling an erythroid, DNA-binding complex which includes the TAL1, E47, GATA-1 and Ldb1/NLI proteins. EMBO J. 16, 3145–3157 (1997)
Article CAS Google Scholar - Zhou, Z. et al. βUSF and NF-E2 cooperate to regulate the recruitment and activity of RNA polymerase II in the -globin gene locus. J. Biol. Chem. 285, 15894–15905 (2010)
Article CAS Google Scholar - Gilbert, W. & Müller-Hill, B. Isolation of the lac repressor. Proc. Natl Acad. Sci. USA 56, 1891–1898 (1966)
Article CAS ADS Google Scholar - Badis, G. et al. Diversity and complexity in DNA recognition by transcription factors. Science 324, 1720–1723 (2009)
Article CAS ADS Google Scholar - Mukherjee, S. et al. Rapid analysis of the DNA-binding specificities of transcription factors with DNA microarrays. Nature Genet. 36, 1331–1339 (2004)
Article CAS Google Scholar - Vaquerizas, J. M., Kummerfeld, S. K., Teichmann, S. A. & Luscombe, N. M. A census of human transcription factors: function, expression and evolution. Nature Rev. Genet. 10, 252–263 (2009)
Article CAS Google Scholar - Newburger, D. E. & Bulyk, M. L. UniPROBE: an online database of protein binding microarray data on protein-DNA interactions. Nucleic Acids Res. 37, D77–D82 (2009)
Article CAS Google Scholar - Drmanac, R. et al. Human genome sequencing using unchained base reads on self-assembling DNA nanoarrays. Science 327, 78–81 (2010)
Article CAS ADS Google Scholar - Nei, M. & Li, W. H. Mathematical model for studying genetic variation in terms of restriction endonucleases. Proc. Natl Acad. Sci. USA 76, 5269–5273 (1979)
Article CAS ADS Google Scholar - Schoenherr, C. J. & Anderson, D. J. The neuron-restrictive silencer factor (NRSF): a coordinate repressor of multiple neuron-specific genes. Science 267, 1360–1363 (1995)
Article CAS ADS Google Scholar - Takahashi, K. et al. Induction of pluripotent stem cells from adult human fibroblasts by defined factors. Cell 131, 861–872 (2007)
Article CAS Google Scholar - Yun, K. & Wold, B. Skeletal muscle determination and differentiation: story of a core regulatory network and its context. Curr. Opin. Cell Biol. 8, 877–889 (1996)
Article CAS Google Scholar - Pevny, L. et al. Erythroid differentiation in chimaeric mice blocked by a targeted mutation in the gene for transcription factor GATA-1. Nature 349, 257–260 (1991)
Article CAS ADS Google Scholar - Socolovsky, M. et al. Ineffective erythropoiesis in _Stat5a_−/−_5b_−/− mice due to decreased survival of early erythroblasts. Blood 98, 3261–3273 (2001)
Article CAS Google Scholar - Halupa, A. et al. A novel role for STAT1 in regulating murine erythropoiesis: deletion of STAT1 results in overall reduction of erythroid progenitors and alters their distribution. Blood 105, 552–561 (2005)
Article CAS Google Scholar - Treisman, R. & Maniatis, T. Simian virus 40 enhancer increases number of RNA polymerase II molecules on linked. DNA 315, 73–75 (1985)
CAS Google Scholar - Grosveld, F., van Assendelft, G. B., Greaves, D. R. & Kollias, G. βPosition-independent, high-level expression of the human -globin gene in transgenic mice. Cell 51, 975–985 (1987)
Article CAS Google Scholar - Sabo, P. J. et al. Genome-scale mapping of DNase I sensitivity in vivo using tiling DNA microarrays. Nature Methods 3, 511–518 (2006)
Article CAS Google Scholar
Acknowledgements
This work was supported by National Institutes of Health (NIH) grants HG004592 (J.A.S.) and RC2HG005654 (J.A.S. and M.G.). J.V. is supported by a National Science Foundation Graduate Research Fellowship under grant no. DGE-071824. Additional support was provided in part by the University of Washington Proteomics Resource (UWPR95794). We thank F. Urnov for critical reading of the manuscript and many discussions, and S. Thomas for insights.
Author information
Author notes
- Shane Neph, Jeff Vierstra, Andrew B. Stergachis and Alex P. Reynolds: These authors contributed equally to this work.
Authors and Affiliations
- Department of Genome Sciences, University of Washington, Seattle, 98195, Washington, USA
Shane Neph, Jeff Vierstra, Andrew B. Stergachis, Alex P. Reynolds, Eric Haugen, Benjamin Vernot, Robert E. Thurman, Sam John, Richard Sandstrom, Audra K. Johnson, Matthew T. Maurano, Richard Humbert, Eric Rynes, Hao Wang, Shinny Vong, Kristen Lee, Daniel Bates, Morgan Diegel, Vaughn Roach, Douglas Dunn, Jun Neri, Anthony Schafer, R. Scott Hansen, Tanya Kutyavin, Erika Giste, Molly Weaver, Theresa Canfield, Peter Sabo, Michael J. MacCoss, Joshua M. Akey, Rajinder Kaul & John A. Stamatoyannopoulos - Division of Medical Genetics, Department of Medicine, University of Washington, Seattle, 98195, Washington, USA
R. Scott Hansen & Rajinder Kaul - Fred Hutchison Cancer Research Center, Seattle, 98109, Washington, USA
Miaohua Zhang, Gayathri Balasundaram, Rachel Byron, M. A. Bender & Mark Groudine - Department of Pediatrics, University of Washington, Seattle, 98195, Washington, USA
M. A. Bender - Department of Radiation Oncology, Department of Medicine, University of Washington, Seattle, 98195, Washington, USA
Mark Groudine - Division of Oncology, Department of Medicine, University of Washington, Seattle, 98195, Washington, USA
John A. Stamatoyannopoulos
Authors
- Shane Neph
- Jeff Vierstra
- Andrew B. Stergachis
- Alex P. Reynolds
- Eric Haugen
- Benjamin Vernot
- Robert E. Thurman
- Sam John
- Richard Sandstrom
- Audra K. Johnson
- Matthew T. Maurano
- Richard Humbert
- Eric Rynes
- Hao Wang
- Shinny Vong
- Kristen Lee
- Daniel Bates
- Morgan Diegel
- Vaughn Roach
- Douglas Dunn
- Jun Neri
- Anthony Schafer
- R. Scott Hansen
- Tanya Kutyavin
- Erika Giste
- Molly Weaver
- Theresa Canfield
- Peter Sabo
- Miaohua Zhang
- Gayathri Balasundaram
- Rachel Byron
- Michael J. MacCoss
- Joshua M. Akey
- M. A. Bender
- Mark Groudine
- Rajinder Kaul
- John A. Stamatoyannopoulos
Contributions
J.A.S., A.B.S., S.N., M.T.M., B.V. and J.V. designed the experiments. S.N., J.V., A.B.S., A.P.R., B.V., M.T.M., R.E.T., E.H. and R.S. carried out the analysis; J.A.S., J.V., A.B.S., S.N., A.P.R. and S.J. wrote the paper; and all other authors carried out various aspects of experimental data collection.
Corresponding author
Correspondence toJohn A. Stamatoyannopoulos.
Ethics declarations
Competing interests
The authors declare no competing financial interests.
Supplementary information
Supplementary information
This file contains Supplementary Methods, Supplementary References, Supplementary Figures 1-15 and Supplementary Tables 1-4. (PDF 16946 kb)
PowerPoint slides
Rights and permissions
This article is distributed under the terms of the Creative Commons Attribution-Non-Commercial-Share Alike licence (http://creativecommons.org/licenses/by-nc-sa/3.0/).
About this article
Cite this article
Neph, S., Vierstra, J., Stergachis, A. et al. An expansive human regulatory lexicon encoded in transcription factor footprints.Nature 489, 83–90 (2012). https://doi.org/10.1038/nature11212
- Received: 11 December 2011
- Accepted: 10 May 2012
- Published: 05 September 2012
- Issue Date: 06 September 2012
- DOI: https://doi.org/10.1038/nature11212
