Alternative α-synuclein transcript usage as a convergent mechanism in Parkinson's disease pathology (original) (raw)
Introduction
Parkinson's disease (PD) is a progressive movement disorder of aging, characterized by rigidity, gait difficulty, slowed movements and a tremor at rest1. These clinical findings relate to the preferential loss of dopamine (DA) neurons in the substantia nigra (SN) pars compacta of the ventral midbrain. Postmortem pathological analyses of PD patient brain also demonstrate distinctive cytoplasmic protein aggregates (termed Lewy bodies), composed largely of α-synuclein (aSyn), as well as evidence for oxidative stress and mitochondrial dysfunction2. A challenge to the mechanistic study of PD and other slowly progressive neurodegenerative disorders is that molecular findings at autopsy are often secondary to the disease process, rather than causal. Significant insight into molecular mechanism of PD has come from analyses of rare familial forms of the disease that are caused by inherited genetic mutations. Mutations at several loci, including aSyn and the Leucine-rich repeat kinase-2 (LRRK2) genes, can lead to rare familial forms of PD3,4. Furthermore, typical non-familial 'sporadic' PD is associated with common genetic variants at the familial PD genes, aSyn and LRRK2 (refs 5,6,7), supporting the notion that similar (albeit unknown) mechanisms may underlie familial and 'sporadic' PD.
Despite the extensive genetic and pathological evidence implicating aSyn in the aetiology of PD, the mechanism of action remains unclear. In afflicted PD brain neurons, as well as in transgenic overexpression models of PD, aSyn protein displays a propensity to form soluble multimers as well as larger insoluble aggregates; such modified aSyn species are hypothesized to be toxic to neurons8. In addition, in the context of disease pathology, aSyn is reported to be preferentially relocalized away from synaptic terminals—where it is thought to have a regulatory role in physiological synaptic transmission9,10—and towards protein inclusions and somatic structures including mitochondria1,11. However, the roles of such pathological aSyn findings in PD aetiology, and how these may relate to physiological functions of aSyn in healthy brain, remain to be determined.
Whole-transcriptome brain gene expression analyses potentially afford a relatively unbiased and hypothesis-free approach to the identification of candidate causal molecular pathways in the context of brain disorder12,13,14,15, such as PD brain pathology. However, a common hurdle to the approach is that the majority of global transcriptome-wide differential expression changes seen in patient brain are likely secondary to disease pathology, such as the selective loss of DA neurons in PD, rather than related to the aetiological chain of events that lead to pathology. Global gene expression network tools have been developed with the intent of distinguishing secondary transcriptome changes from causal primary events16,17,18,19. Differential co-expression analysis (DCA)16 is based on the notion that transcripts encoding causal 'master regulators', that drive the expression changes in disease, are normally highly correlated in expression with many downstream 'slave' transcripts. In a disease state where a 'master regulator' is dysfunctional—such as a mutant transcription factor in familial genetic disorders—the correlation networks are predicted to be reconfigured16,20 most prominently around a 'master regulator' node. Briefly, DCA identifies transcripts that exhibit the greatest and most consistent change in their co-expression correlation with the set of differentially expressed transcripts, when comparing panels of healthy control and patient tissue samples.
We herein describe DCA of PD brain tissue, and identify a specific transcript isoform of aSyn with a long 3′ untranslated region (UTR), termed aSynL, that is highly altered in co-expression correlation in the context of PD tissue. The ratio of aSynL to shorter aSyn transcripts is increased in the context of PD as well as PD risk factors, including the presence of specific common genetic variants at the aSyn locus, advanced age and toxin exposure. In unaffected brain tissue, levels of aSynL appear highest in midbrain DA neurons that are prominently lost in PD. aSynL transcript expression leads to the preferential accumulation of aSyn protein away from synaptic terminals and towards mitochondria, reminiscent of disease pathology. Taken together, these findings suggest a model in which expression of aSynL transcripts, relative to shorter isoforms, is induced by major PD risk factors and has a selective role in PD pathology.
Results
DCA of PD brain tissue identifies aSynL as a node
DCA was performed on an existing gene expression data set from age-matched unaffected-control and PD patient SN tissue at autopsy (GEO accession code GSE7621)12. Strikingly, the most highly reconfigured (or 'rewired') probeset, 204467_s_at (3′UTR1), detects an aSyn isoform that harbours a longer 3′UTR, aSynL (Fig. 1a, Supplementary Fig. S1 and Supplementary Table S1). Replication of the study with independent PD and unaffected SN data sets (GEO aceession codes GSE8397 (ref. 13), GSE20292 (ref. 14), GSE20141 (ref. 15) again identified aSynL as among the most rewired transcripts, and aSynL ranked first in a combined analysis (Fig. 1a; Supplementary Table S1). Of note, despite being the most differentially correlated, aSynL is not among the most differentially expressed transcripts between patients and controls (Fig. 1a, Supplementary Data 1).
Figure 1: Altered aSyn transcript co-expression correlation networks in PD brain tissue.
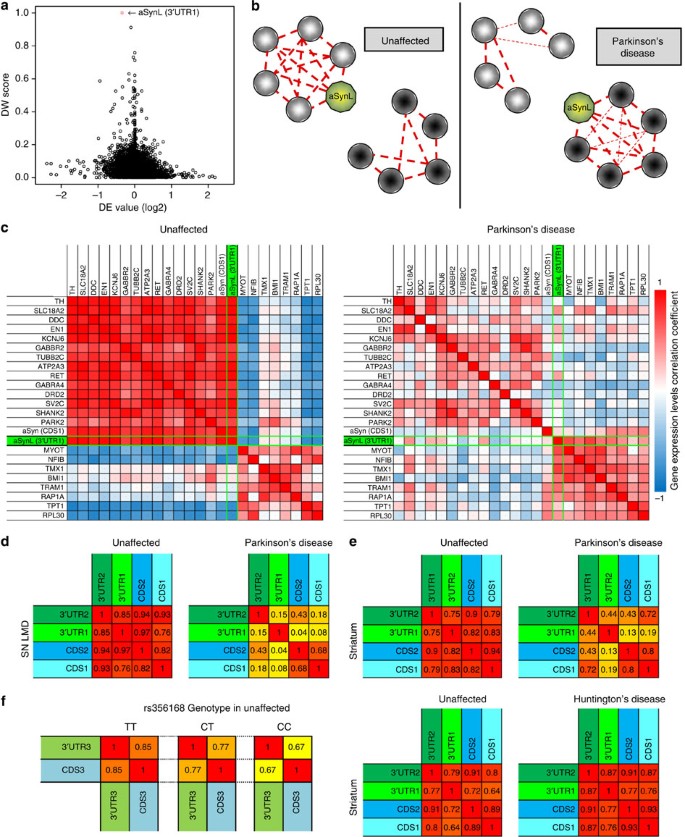
(a–c) aSyn transcripts are globally rewired in PD brain tissue. (a) Plot of the normalized DW score (y axis) and differential expression (DE) (x axis, plotted in log2) between PD and unaffected control brain tissue cohorts. Each circle represents an Affymetrix probeset. An aSyn probeset specific for longer 3′UTR isoforms (aSynL, 204467_s_at; highlighted in red) is most differentially co-expressed out of 22283 total in meta-analysis across all data sets. (b) Schematic of aSynL network rewiring in PD. aSyn transcripts recognized by the aSynL probeset (aSynL) are presented in green. (c) Transcript co-expression correlation tables for unaffected control (left) and PD brain tissue (right) cohorts. An aSynL probeset specific for longer isoforms (3′UTR1/204467_s_at; Supplementary Fig. S1) is highlighted in green. A second aSyn probeset that targets the aSyn coding sequences regardless of 3′UTR structure (CDS1/211546_x_at) is adjacent. High correlations (_r_=1) are denoted in red, high anti-correlation (_r_=−1) in blue and weak correlation in white (_r_=0). _n_=10 for unaffected, _n_=15 for PD. (d–f) A loss of correlation in expression levels of aSynL with other aSyn transcript isoforms is specifically associated with PD. Correlation tables of aSyn isoform expression are presented in laser-microdissected SN DA neurons from PD patient tissue or unaffected controls (d; _n_=10 and 18 per group) or in striatum samples from PD (e, upper panel, _n_=19 and 16 per group) or Huntington's disease patients (e, lower panel, _n_=32 and 38 per group) along with corresponding unaffected controls. High correlation (_r_=1) is depicted in red, weak correlation (_r_=0) in yellow. In PD samples, longer aSynL transcripts (as detected by probeset 3′UTR1) are relatively unwired from shorter transcripts (as detected by CDS1, CDS2 [207827_x_at] or 3′UTR2 [204466_s_at]; the latter probeset recognizes the most proximal region of the aSyn 3′UTR; see Supplementary Fig. S1). (f) aSyn transcript co-expression was quantified in cortical tissue from 183 unaffected control individuals grouped according to their genotype for the PD-associated SNP (rs356168), using Illumina aSyn probes CDS3 and 3′UTR3 (Supplementary Fig. S1b). Individuals homozygous for the PD-risk allele ('CC', left) demonstrated significantly decreased aSyn transcript co-expression correlation relatively to those that harbour 1 ('CT', middle) or 2 ('TT', right) protective alleles.
A post-hoc analysis of unaffected-control SN tissue revealed that aSynL expression is normally highly correlated with a sub-network of gene transcripts that are associated with synaptic and vesicular transport functions, including Dopa decarboxylase (DDC) and vesicle monoamine transporter type 2 (SLC18A2). In contrast, in a PD SN tissue panel, aSynL expression was instead correlated with transcripts annotated for nuclear localization and transcription regulation functions (Fig. 1b,c, Supplementary Data 2). The global rewiring of aSynL in PD midbrain is unlikely to be a trivial consequence of the loss of midbrain dopaminergic neurons (mDNs), as similar findings were obtained with laser-dissected mDN tissue (Supplementary Fig. S1).
Surprisingly, among transcripts that appeared uncorrelated from aSynL (detected by the distal 3′UTR probeset 3′UTR1; 204467_s_at; Supplementary Fig. S1) in PD were other shorter aSyn transcripts, as quantified using a probeset within the aSyn protein coding sequences (CDS1 probeset, 211546_x_at, detects all isoforms; Fig. 1c and Supplementary Fig. S1). Comparable rewiring among aSyn isoforms in PD was seen in a second independent data set from laser-dissected mDN tissue, and using additional probesets (Fig. 1d). We did not observe such aSyn transcript unwiring in other neurological diseases including Huntington's disease or frontotemporal dementia (Fig. 1e and Supplementary Fig. S1). In cortical brain samples from unaffected individuals21, the presence of a common single-nucleotide polymorphism (SNP) variant in the aSyn locus associated with increased PD risk (C at rs356168, 3 kb downstream of the aSyn 3′UTR) was correspondingly associated with significantly decreased co-expression correlation between aSynL and other aSyn transcripts (Fig. 1f; Supplementary Data 3). Thus, even unaffected individuals harbouring an aSyn PD-risk variant display the aSyn isoform rewiring pattern of PD tissue.
We sought to more precisely characterize the different aSyn 3′UTR mRNA species in normal and PD human brain. High-throughput, whole-transcriptome sequencing of the 3′UTR ends of polyadenylated (PolyA) mRNA transcripts (termed pA-RNAseq; see Methods) was performed on a cohort of 17 unaffected and 17 PD cerebral cortical tissue samples. This revealed five aSyn 3′UTR isoforms, with lengths from 290 to 2,520 nt (Fig. 2a; Supplementary Fig. S2). Of these, the 560- and 2,520-nt forms were predominant. The existence and relative preponderance of these species was further confirmed by northern blot (Fig. 2b). We next hypothesized, based on the DCA analysis above, that aSyn 3′UTR selection might be altered in PD. Comparison of pA-RNAseq profiles from PD and unaffected cerebral cortex samples revealed an increase in the preponderance of the long 3′UTR species (>560 nt) relative to shorter species (<560 nt; Fig. 2c, Supplementary Fig. S2). Such a relative increase in aSynL was confirmed by quantitative real-time PCR (rt–qPCR) and appeared specific for PD, as the increase was also observed by comparison with RNA from amyotrophic lateral sclerosis patient samples (Fig. 2d). We note that the modified aSyn 3′UTR selection associated with PD patient tissue was detected in cerebral cortex tissue, which typically harbours pathological evidence of the disease process without frank cell loss22; thus, this phenotype is unlikely to be a secondary consequence of neurodegeneration. Re-analysis of the aSynL:total ratio in the context of SN (Supplementary Fig. S2) or laser-microdissected SN mDNs (Supplementary Fig. S2) from PD patients or unaffected individuals did not show statistically significant change, perhaps reflecting confounding effects of the late-stage disease pathology in these samples.
Figure 2: Characterization of aSyn mRNA 3′UTR isoforms in unaffected and PD brain tissue.
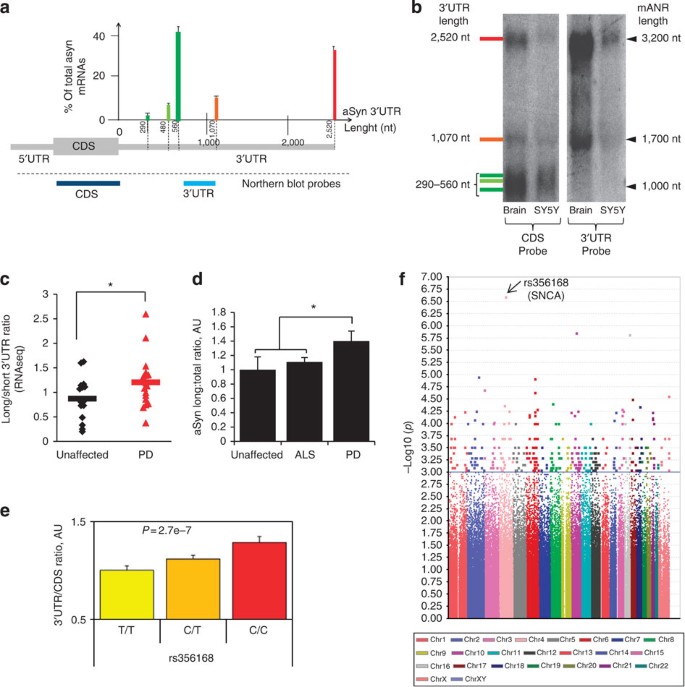
(a) Relative abundance of the different aSyn 3′UTR species, determined by pA-RNAseq in 17 cortical brain samples from unaffected individuals. The frequency of 3′UTR species is expressed as the percentage of total aSyn transcript, with short species (290, 480 or 560 nt) in shades of green; medium (1,070 nt) in orange and long (2,520 nt) in red. (b) Northern blot analysis of RNA from human brain or SH-SY5Y cells, as indicated. Blots were hybridized with probes targeting the aSyn CDS (left panel) or the 3′UTR (right panel). Nucleotide length is presented on the right; the corresponding 3′UTR size (colour coded as per a) is indicated on left. (c) Ratio of long 3′UTR aSyn mRNA to short 3′UTR aSyn mRNA species counts, evaluated by pA-RNAseq of cortical samples from unaffected individuals (_n_=17, black diamonds) and from PD patients (_n_=17, red triangles). Ratio corresponds to the long 3′UTR species (1,070 and 2,520 nt) read count divided by the shorter 3′UTR species (290, 480 or 560 nt) read count. Horizontal bars represent the means. *P<0.05, two-tailed _t_-test. (d) Ratio of aSynL:total transcripts, as quantified by RT–qPCR in cortical samples from PD (_n_=18), amyotrophic lateral sclerosis (ALS) (_n_=16) or unaffected individuals (_n_=8). The mean transcript ratio of the control group was arbitrarily set to 1 as a reference. *P<0.05, analysis of variance followed by the Bonferroni correction. (e) aSynL:total transcript ratios in cortical tissue samples from unaffected non-PD individuals (_n_=365) are presented as a function of rs356168 PD-associated risk allele load. Individuals harbour 0 PD-risk alleles ('CC', left), 1 PD-risk allele ('CT', middle) or 2 PD risk alleles ('TT', right). Association between the allelic load of the T causative variant and the aSynL:total ratio was evaluated by linear regression. (f) Manhattan plot representing the association of 380,157 SNPs with the aSynL:total ratio in the non-PD brain tissue cohort as in (e). X axis represents chromosomal location, y axis represents −log10 of the unadjusted _P_-value of association for each SNP with elevated aSyn transcript ratio. The aSyn 3′ locus SNP rs356168 (arrow) exhibits the highest association. Error bars represent the s.e.m.
To further circumvent potential confounding effects in diseased tissue, we quantified the aSynL:total transcript ratio in unaffected brain tissue from individuals with PD risk-associated or protective SNP variants at the aSyn locus. Reanalysis of cortical tissue from 182 unaffected individuals23 demonstrated that the risk-associated variant (C at rs356168) was highly predictive of an elevated aSynL:total transcript ratio. This ratio quantitative trait locus (rQTL) effect was reproduced in an independent series of cerebral cortical tissue samples from 183 AD patients23. Combination of both data sets by studying all 365 samples together also led to a highly significant association (_n_=365; P<10−6 by linear regression coefficient analysis for allelic load; Fig. 2e). We further pursued the regulation of the aSyn rQTL using an unbiased, genome-wide approach by reanalysis of concurrent genome-wide SNP and cerebral cortical gene expression data21,23. Strikingly, this genome-wide reanalysis identified the same PD risk-associated SNP in the 3′ region of the aSyn locus (rs356168; as in Fig. 2e) as the most highly correlated with the aSyn mRNA 3′UTR ratio (Fig. 2f; Supplementary Data 4). Of note, no significant association was found in the 5′ region of the aSyn locus (Supplementary Fig. S2).
DA regulation of aSyn transcript polyA site selection
Reanalysis of data from a publicly available Gene Expression Atlas (GEO accession code GSE7307) revealed surprising tissue selectivity in the relative abundance of the aSynL transcript. Among 22 human brain regions analysed, SN exhibited the highest ratio (Supplementary Fig. S8). Given the pathological evidence for altered aSyn accumulation in PD mDNs, we hypothesized that DA could directly modulate aSyn 3′UTR usage, in parallel with genetic regulation as detailed above. Treatment of primary rat cortical neuron with exogenous DA (100 μM) in vitro led to an increase in the aSynL:total ratio, as determined by rt–qPCR (Fig. 3a). We next examined the role of DA on aSyn transcript regulation in vivo. Control mice with a normal complement of mDNs (DA transporter (DAT)-Cre/Dicerflox/+24) treated systemically with l-Dopa (20 mg kg−1 daily for 5 days)—which is taken up by mDNs through the DAT and leads to increased DA content—displayed an increased aSynL:total ratio in midbrain, as determined by RT–qPCR (Fig. 3b). Such l-Dopa treatment did not alter the aSyn transcript ratio in midbrain tissue from littermates deficient in mDNs (DAT-Cre/Dicerflox/flox mice). Furthermore, the effect of l-Dopa on the ratio was not apparent in brain regions other than midbrain, such as striatal tissue (data not shown). We note that this contrasts with the PD risk-associated SNP effect on the transcript ratio described above, which is readily evident in non-dopaminergic neurons, suggesting that the mechanism of DA action on the aSyn transcript ratio may be distinct from that of the risk SNP. Screening of other neurotransmitter receptor signalling modulators in vitro also supported a role for GABAergic modulation in the regulation of the aSynL:total transcript ratio. Specifically, the GABA-A (γ-aminobutyric acid) antagonist picrotoxin, significantly increased this ratio in cortical primary cultures whereas GABA-A agonist muscimol decreased it (Supplementary Fig. S3). In contrast, modulation of _N_-methyl-D-aspartate or kainate glutamate receptors did not appear to impact the aSynL:total transcript ratio (Supplementary Fig. S3).
Figure 3: Regulation of aSyn transcript isoform ratio in vitro and in vivo.
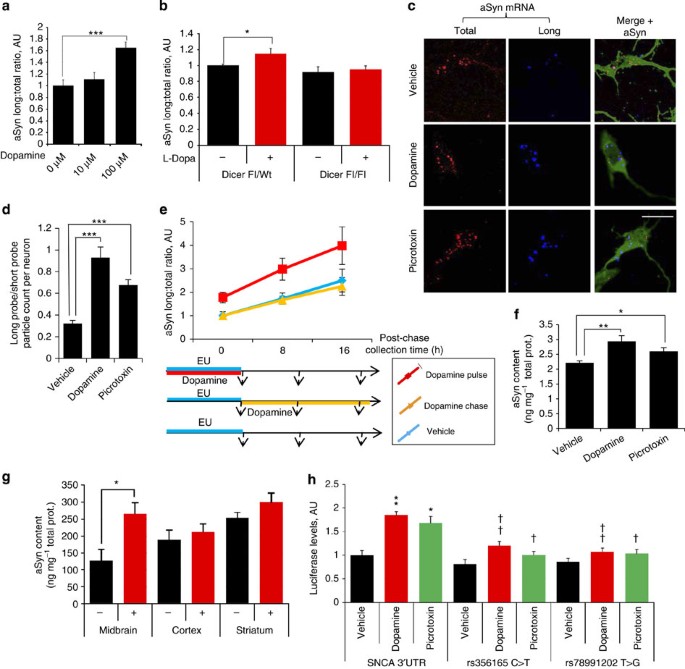
(a) aSynL:total ratio RT–qPCR quantification in rat primary cortical neuron cultures exposed to extracellular DA as indicated. _N_=8 per group. (b) l-Dopa treatment (20 mg kg−1 per day, 5 days) of 2-month-old control (DAT-Cre/Dicerflox/+) mice but not Dicer-deficient mice (DAT-Cre/Dicerflox/flox, having lost >95% of mDNs24) led to an increased aSynL:total ratio in midbrain. _N_=6 per group. (c) In situ hybridization (ISH) with probes for human aSyn CDS (red) or specific for the aSyn long 3′UTR (blue) of primary cortical neuron cultures from aSyn-PAC transgenic mice. Cells were treated with DA (100 μM), picrotoxin (100 μM) or vehicle for 24 h and co-stained with antibodies to aSyn (green). Scale bar, 10 μm. (d) aSynL:total ratio was quantified in terms of particle count per neuron using ISH probes as per (c). _n_>10 neurons per group from three independent wells. (e) SH-SY5Y cells were cultured for 8 h in the presence of EU (to label newly transcribed RNA; 'pulse') and subsequently maintained without EU for the indicated period of time ('chase'). aSynL:total ratio was then evaluated by RT–qPCR in EU-labeled nascent RNA, as well as in total RNA. Pulse-chase analyses were conducted in the absence of DA ('vehicle'; blue), in the presence of 100 μM DA during the EU-labeling period only ('DA pulse'; red), or during the chase exclusively ('DA chase'; yellow). _n_=5 per group (f), total endogenous aSyn protein levels in SH-SY5Y cells treated with DA (100 μM), picrotoxin (100 μM) or vehicle for 48 h. _n_=5 per group. (g) l-Dopa treatment (20 mg kg−1 IP daily for 5 days) of 2-month-old aSyn PAC transgenic mice led to significantly increased aSyn protein in midbrain tissue. n_>5 mice per group. (h) Human SH-SY5Y cells were transfected with a firefly luciferase reporter vector harbouring a 1.1-kb human aSyn 3′UTR element (along with a Renilla luciferase control vector), or with this luciferase vector modified to encode the rs356165 (C>T) or the rs78991202 (T>G) minor alleles. DA (100 μM) or picrotoxin (100 μM) were added to the culture medium for 24 h before luciferase activity quantification. n_=6 for each group. For all graphs, error bars are s.e.m.; *P<0.05, **P<0.01 and ***P<0.001, as determined by analysis of variance followed by the Bonferroni correction. For h specifically, *P<0.05, **P<0.01 for comparisons with the Vehicle treatment for the same plasmid vector, and †_P<0.05, ‡_P<0.01 for comparisons with the SNCA 3′UTR plasmid vector under the same treatment (dopamine or picrotoxin).
To confirm the modified aSyn 3′UTR usage in an independent manner, we next performed in situ hybridization (ISH) studies on primary cortical neuron cultures from transgenic mice bearing a fragment of human chromosome 4 encompassing the whole aSyn locus including the 3′UTR25 (termed aSyn P1 artificial chromosome (PAC) mice). Nucleic acid probes were designed to either detect all human aSyn mRNA species or specifically the human long 3′UTR; these probes do not cross-react with endogenous rodent aSyn mRNA (Supplementary Fig. S3). As expected, treatment with either DA or picrotoxin led to an increase in the aSynL:total ratio (Fig. 3c,d).
To characterize the mechanism by which DA impacts the aSynL:total ratio, we sought to distinguish between co-transcriptional modifications (acting on nascent aSyn mRNA generation), such as alternative cleavage and poly(A) site selection, and post-transcriptional effects on the relative stability of different isoforms. We thus performed pulse-chase nascent RNA-labeling studies in DA-treated or -untreated human SH-SY5Y cells (using 5-ethynyl uridine (EU); Supplementary Fig. S3). DA treatment exclusively during the pulse-labeling period led to a robust and durable increase in aSynL:total ratio among the labelled RNA population. By contrast, DA treatment exclusively post-labeling did not produce any effect on the aSynL:total ratio among the labelled RNA population (Fig. 3e and Supplementary Fig. S3). Consistently with those results, treatment with the transcriptional inhibitor, actinomycin D, along with DA, prevented the increase in aSynL:total ratio (Supplementary Fig S3e). Taken together, these data suggest that DA acts co-transcriptionally to modify alternative 3′UTR cleavage and poly(A) site selection, rather than acting post-transcriptionally on the stability of the mRNA isoforms. Furthermore, disruption of a PolyA site corresponding to the short 3′UTR within an aSyn mini-gene plasmid occluded the DA-mediated increase in the aSynL:total ratio in the mini-gene context (Supplementary Fig. S3).
The regulation of aSyn 3′UTR selection by DA may either be a consequence of accumulation of intracellular DA or be due to receptor-mediated dopaminergic signalling. We sought to distinguish these mechanisms. As intracellular accumulation of DA is greatly facilitated by the DAT in SN neurons (Supplementary Fig. S4) but is absent from cortical neurons, we overexpressed DAT in cortical neuron cultures; this significantly increased the sensitivity of primary cortical neurons to DA (at 10 μM) with respect to aSynL:total ratio modification (Supplementary Fig. S4). In contrast, the monoamine reuptake inhibitor nomifensine suppressed sensitivity to high-dose DA (100 μM; Supplementary Fig. S4). These data support a specific role for cytoplasmic DA in the regulation of the aSynL 3′UTR ratio, perhaps due to the induction of oxidative stress26,27. Consistent with this notion, environmental risk factors associated with cellular oxidative stress and increased PD risk—such as aging, rotenone or 1-methyl-4-phenyl-1,2,3,6-tetrahydropyridine exposure—all predictably increase the aSynL:total ratio. In contrast, nicotine exposure—associated with decreased risk—reduces the aSynL:total ratio (Supplementary Fig. S7). We cannot exclude additional extracellular roles for DA through receptor signalling, but analysis of receptor agonists was inconclusive (Supplementary Fig. S4).
aSynL 3′UTR is associated with increased protein translation
Prior proteomic analyses of neuroblastoma cultures in vitro have suggested that exogenous DA can potentiate aSyn protein accumulation28,29, reminiscent of the effect of DA on the aSynL:total ratio (Fig. 3a, Supplementary Fig. S3). Consistent with this, either DA or picrotoxin treatment significantly increased endogenous aSyn protein levels in SH-SY5Y cells, as quantified by enzyme-linked immunosorbent assay (ELISA) (Fig. 3f). Similarly, l-Dopa treatment of 10-mo-old human aSyn PAC transgenic mice (as above in Fig. 3b) significantly increased the accumulation of human aSyn protein in midbrain but not in other brain regions such as striatum or cortex (Fig. 3g). To further parse the role of the aSyn 3′UTR element, we transfected luciferase assay vectors that harbours either an 1,100-nucleotide (3′UTR-long) or a 560-nucleotide (3′UTR-short) human aSyn 3′UTR element into SH-SY5Y human neuroblastoma cells (Supplementary Fig. S5). Treatment of 3′UTR-long vector-transfected SH-SY5Y cells with DA led to increased luciferase expression (Fig. 3h) that was by contrast not observed with 3′UTR-short-transfected cells (Supplementary Fig. S5). Taken together, these findings directly implicate the distal part of the aSyn 3′UTR as a cis-acting element, leading to increased mRNA translation and protein accumulation.
Genetic variants modify aSynL translation
We hypothesized that SNPs present within the aSyn transcript 3′UTR and that are associated with PD risk may have a direct role in aSynL translation regulation by modifying key 3′UTR cis-acting elements30. We identified six candidate SNPs that are present in the aSyn 3′UTR and show significant variability in the population (minor allele frequency >1%; Supplementary Fig. S5). Luciferase assay vector analysis in SH-SY5Y cells revealed that two out of these six SNPs—rs356165 and rs78991202—modify DA responsiveness of the aSyn 3′UTR (Fig. 3h, Supplementary Fig. S5). Both of these are specific to the long (rather than the short) aSynL 3′UTR form. Furthermore, whereas these SNPs are separated by ~80 nt within the primary 3′UTR sequence, RNA secondary structure analysis predicts that both are located within complementary strands of a single stem-loop structural element (Fig. 4a). We further note that rs356165 is tightly linked (in linkage disequilibrium) with the SNP identified in the above rQTL analysis as regulating the aSynL:total ratio (rs356168; Supplementary Table S4) and is strongly associated with PD risk (Supplementary Table S4; linkage for rs78991202 is undetermined). Importantly, the protective allele of rs356165 was found to reduce aSyn 3′UTR-mediated translation (Fig. 3h). Taken together, these data implicate rs356165 as a candidate causative variant within the aSyn 3′UTR.
Figure 4: Longer aSyn transcript 3′UTRs promote protein accumulation and mitochondrial localization.
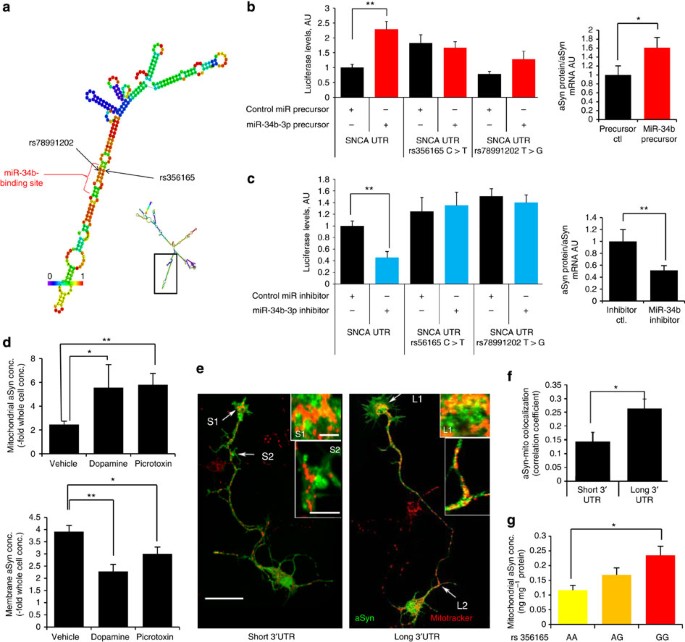
(a) Predicted local secondary structure of aSyn 3′UTR RNA near the rs356165 and rs78991202 SNPs using RNAfold45. A putative miR-34-3p-binding site lies in this region (as determined by Targetscan analysis). Insert panel shows the predicted global structure of the aSyn 3′UTR, with black box denoting the area of interest. (b,c) Left panels: luciferase activity in HEK293 cells, quantified 24 h after transfection with the luciferase-aSyn 3′UTR reporter vector, along with a miR-34b-mimic (b) or a miR-34b-inhibitor (c). _n_=6 for each group. Right panels: total endogenous aSyn protein levels (normalized to total aSyn mRNA levels as measured by RT–qPCR) in SH-SY5Y cells transfected with a miR-34b-mimic (b) or with a miR-34b-inhibitor (c). _n_=5 for each group. (d) In SH-SY5Y cells exposed to DA (100 μM) or picrotoxin (100 μM) for 48 h, aSyn protein content is preferentially increased in mitochondrial preparations relative to whole-cell aSyn content (upper panel) and decreased in membrane preparations (lower panel, _n_=5 for each group) (e,f), Rat primary cortical neurons cultures at 3 days in vitro were transfected with a vector encoding a GFP–aSyn fusion protein (green) with either a short (0.3 kb) or a long (1.1 kb) aSyn 3′UTR and stained with Mitotracker (e, in red) followed by confocal microscopy. Increased colocalization was observed in the context of the longer 3′UTR, both within the axonal growth cone terminal fields (L1 or S1 arrows, magnified in upper inserts) as well as in axonal processes (arrows L2 or S2, magnified in lower inserts). Scale bar, 10 μm in main panel, 5 μm in insets. (f) Colocalization quantification of aSyn-GFP and Mitotracker as in (d–e; _n_=12 randomly chosen fields per well, with >3 wells per group. (g) aSyn protein levels in mitochondrial protein fractions isolated from 19 human cortical brain samples of PD-free individuals, grouped by their rs356165 genotype (AA, _n_=3; AG, _n_=12; and GG, _n_=4). For all graphs, error bars represent the s.e.m. (b and d) *P<0.05 and **P<0.01, as quantified by analysis of variance followed by the Bonferroni post-hoc correction. (c and f) *P<0.05, by two-tailed _t_-test. (g) *P<0.05, as evaluated by linear regression against rs356168 allelic load.
Scanning for potential cis-acting regulatory modules within the aSyn 3′UTR that could be altered by the SNP variants, we identified a miR-34b-binding site that overlaps with the rs356165 and rs78991202 sites (using TargetScan analysis31; Fig. 4a). Co-transfection of HEK-293 cells with a miR-34b-3p precursor, along with a luciferase vector bearing the aSyn 3′UTR, significantly induced the level of the luciferase reporter (Fig. 4b, relative to a control miRNA precursor). In contrast, transfection of a miR-34b-3p-specific inhibitor significantly decreased luciferase expression (Fig. 4c; relative to a control miRNA inhibitor). Those effects were moreover abolished in the context of constructs harbouring either of the two SNP variants as above (rs3561165 C>T and rs78991202 T>G). The effects of the miR-34b-3p mimic and inhibitor on aSyn translation were further confirmed in the context of endogenous human aSyn in human neuroblastoma SH-SY5Y cells (right panels, Fig. 4b,c, Supplementary Fig. S5). Although miRNAs typically inhibit the stability of targeted mRNAs, other examples of microRNA-mediated translational induction have been described32. The miR-34b effect appears independent of the DA effect in the context of the wild-type allele (rs3561165 C and rs78991202T), as the two treatments appeared simply additive (Supplementary Fig. S5). We note that unlike the miR-34b target site which is present in aSynL but not short aSyn 3′UTR transcript isoforms, the predicted target sites for other miRNAs previously implicated in the regulation of aSyn, such as miR-733, are present within the proximal region of the aSyn 3′UTR and thus impact expression of both long and short isoforms equivalently (Supplementary Fig. S5 and data not shown).
The aSynL 3′UTR impacts protein localization
We next probed the potential impact of aSyn 3′UTR regulation on aSyn protein accumulation and subcellular localization in primary neurons. Treatment of primary cortical neurons aSyn transgenic PAC mice with DA or picrotoxin, shown above to increase the proportion of aSynL transcripts, also significantly increased the fraction of aSyn protein that colocalized with mitochondria (Supplementary Fig. S6). This was confirmed by biochemical analysis in human SH-SY5Y cells, as either DA or picrotoxin treatment was associated with an increased proportion of endogenous aSyn protein within mitochondrial fractions (Fig. 4d). To relate these findings more directly to the aSyn 3′UTR, we transfected vectors encoding a green fluorescent protein (GFP)–aSyn fusion gene, bearing either a short or a long aSyn 3′UTR (300 and 1,100 nt, respectively), into primary rat cortical neuron cultures. Consistent with a regulatory role for the aSyn 3′UTR, expression of transcripts that harbour the 1.1-kb aSyn 3′UTR led to increased aSyn protein co-localization with mitochondria, relative to expression of transcripts that harbour a short 3′UTR (Fig. 4e,f). Similar transfection experiments in SH-SY5Y cells, followed by biochemical purification of mitochondrial protein fractions, confirmed the preferential mitochondrial accumulation of aSyn protein in the context of long aSyn 3′UTR transcript expression (Supplementary Fig. S6). Concomitant with mitochondrial relocalization in the context of DA or picrotoxin treatment of SH-SY5Y cells, endogenous aSyn protein concentration in the total membrane protein fraction was decreased (Fig. 4d). Similarly, in primary rat cortical neuron cultures transfected with a GFP–aSyn fusion gene, colocalization with the presynaptic marker synaptophysin was reduced in the context of the longer aSyn 3′UTR (data not shown). Taken together, these results suggest a preferential mitochondrial localization of aSyn protein produced from the aSynL transcript. We note that 3′UTR-dependent recruitment of mRNAs to the vicinity of mitochondria has been described for other transcripts34,35,36.
If indeed aSynL leads to the preferential localization of aSyn protein at mitochondria, one prediction would be that such localization would be apparent in human brain tissue from unaffected individuals that harbour the PD risk-associated allele (as such tissue displays an increased aSynL/total ratio; Fig. 2e). Consistent with this hypothesis, aSyn protein concentration in mitochondrial fractions was significantly increased in the context of the aSyn locus SNP risk allele in an allele dose-dependent manner (Fig. 4g), whereas such an increase was not apparent for total aSyn concentration (data not shown). A final prediction is that aSyn relocalization to mitochondria might lead to evidence of mitochondrial dysfunction37, even in brain tissue from unaffected individuals that harbour the PD risk allele. To this end, we identified those transcriptome-wide gene expression changes that are most highly dependent on the allelic load of the PD risk-associated SNP variant across a panel of 183 cortical brain samples from unaffected individuals (see Methods). The set of modified transcripts was then functionally annotated by gene set enrichment analysis (GSEA38; Supplementary Fig. S6). Among the seven Gene Ontology categories most impacted by the risk SNP (_n_=183; P<0.01, FDR<25% by GSEA using Kolmogorov–Smirnov statistical analysis) the majority relate to mitochondrial function (Supplementary Table S3). This is consistent with prior studies of patient-derived PD SN autopsy tissue using differential expression GSEA analysis15.
Discussion
Using a combination of brain gene expression DCA and functional studies in model systems, we provide evidence that aSyn transcripts with an extended 3′UTR, aSynL, are selectively associated with PD pathology. Diverse PD risk factors—such as risk-associated variants at the aSyn locus, aging, and toxin exposure—all similarly increase the aSynL:total ratio. These findings suggest a model in which such PD risk factors converge on a common mechanism: differential aSyn transcript 3′UTR usage (Fig. 5).
Figure 5: Regulation and consequences of aSyn 3′UTR alternative usage.
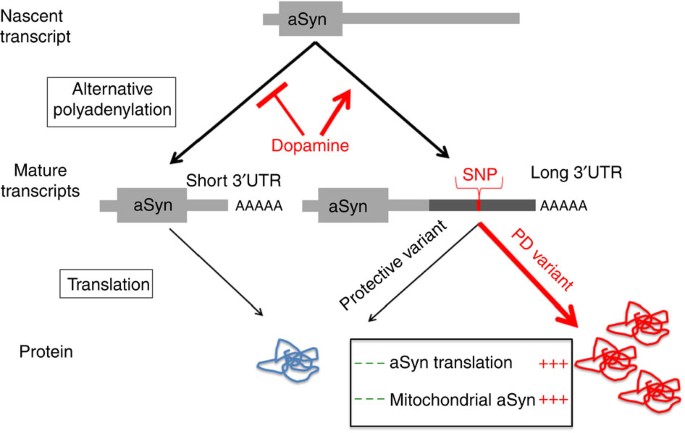
Nascent aSyn RNA transcripts are co-transcriptionally processed to generate mRNA species with alternative 3′UTR elements. Increased cytoplasmic DA promotes the generation of an mRNA isoform that harbours a longer 3′UTR, aSynL. The presence of a longer 3′UTR, particularly in the context of disease-associated SNP variants at the aSyn 3′UTR locus, enhances the accumulation of aSyn protein, as well as the preferential localization of aSyn protein to mitochondria.
The studies herein support the utility of brain DCA network analysis as an adjunct to genome-wide association (GWA) studies in the pursuit of molecular mechanisms of non-familial 'sporadic' neurodegeneration. GWA studies have identified common genetic variants associated with non-familial PD risk. However, such variants can be difficult to functionally parse. DCA is a gene expression network approach to identify candidate transcripts associated with disease that is completely independent of GWA studies. In cases where genetic association studies and DCA converge on a candidate, as with aSynL, a mechanistic pathway may be strongly supported.
The generation of aSyn transcripts with longer 3′UTR elements impacts aSyn protein accumulation and intracellular sorting in a manner consistent with disease pathology: there is redistribution away from synaptic terminals and towards mitochondria and soma structures (Fig. 5). 3′UTR elements typically regulate mRNA translation and stability through interactions with other RNA species (such as miR-34b) or binding proteins, but an impact on protein localization is less common. The impact of the aSynL transcript 3′UTR on the subcellular distribution of aSyn protein to mitochondria has some precedent. In the context of a subset of nuclear-encoded genes, 3′UTR elements have been shown to directly guide recruitment of mRNA transcripts to the vicinity of mitochondria, followed by local translation, leading to mitochondrial protein localization34,35. Alternatively, 3′UTR elements may modify post-translational protein sorting indirectly. We speculate that the regulation of aSyn transcript alternative 3′UTR usage may serve a physiological function, such as in the context of synaptic regulation by aSyn, in addition to a pathological role. Consistent with such a functional role, proximal sequences within the aSyn 3′UTR are evolutionarily conserved from human to rodents. But of note, the human aSynL 3′UTR region additionally contains a long interspersed element repeat not present in other organisms. As this long interspersed element element encompasses the rs356165 SNP and the miR-34b-binding site sequences, it imparts human-specific aspects of aSyn regulation.
Finally, our data imply that modifiers of the aSynL:total ratio may be of potential therapeutic value. We note that the aSynL:total ratio is also elevated in gene expression analysis of patient blood samples relative to unaffected controls (Supplementary Fig. S8), suggesting utility as a biomarker for disease or treatment.
Methods
In vivo l-Dopa treatment
Two-month-old DAT-Cre/Dicerflox/flox and DAT-Cre/Dicerflox/+24 or 40-weeks-old male PAC-Tg (SNCA)+/−;Snca+/− (a gift from Dr Robert L. Nussbaum, University of California San Francisco,25) received 20 mg kg−1 l-Dopa with 12 mg kg−1 benserazide (or PBS vehicle only) by intraperitoneal injection daily for 5 days. Benserazide, a Dopa decarboxylase inhibitor that does not cross the blood–brain barrier, was used in combination with l-Dopa as it is with PD patients, to prevent l-Dopa decarboxylation outside of the brain. One hour after the last dose, mice were anesthetized by inhaled isoflurane and the brains were rapidly removed. The prefrontal cortex, striatum and midbrain were dissected out and stored at −80 °C. All studies adhered to the animal welfare guidelines of the Columbia University Institute Animal Care and Use Committee.
polyA-RNAseq
Libraries generation and sequencing: First-strand cDNA was synthesized from 1 μg of RNA per biological sample using SuperScript III (Invitrogen) following the manufacturer's instructions and using the pdT-FS oligonucleotide to prime the reverse transcription. Barcoded first-strand samples from different samples were then pooled and treated with RNase H (Invitrogen) at 37 °C for 20 min followed by 15 min at 75 °C to degrade RNA template. First-stand cDNA was then purified using the QIAquick PCR Purification kit (Qiagen) in a total volume of 30 ul. Second-strand cDNA was synthesized from 25 ul of first-strand cDNA template by adding 10 μl 10× buffer 2 (NEB), 5 μl 10 mM deoxyribonucleotide triphosphates, 20 U Klenow Fragment (3′ → 5′exo-; NEB), 10 μl of 100 μM tagged second-strand primer (R-SS oligonucleotide: 5′-TCCGATCTGANNNNNNN-3′ with _N_=A, C, T, G mix) and 46 μl water. The reaction mix was incubated at 37 °C for 30 min, followed by 10 min at 75 °C then cooled down at 4 °C. Double-stranded cDNA was purified using PureLink PCR micro columns (Invitrogen) in a 30-ul volume. Illumina-compatible libraries were then generated by PCR from 25 ul of double-stranded cDNA template using Accuprime Pfx polymerase (Invitrogen) following the manufacturer's instruction with NNSR forward (5′-AATGATACGGCGACCACCGAGATCTACACTCTTTCCCTACACGACGCTCTTCCGATCTCT-3′) and NNSR reverse (5′-CAAGCAGAAGACGGCATACGAGATCGGTCTCGGCATTCCTGCTGAACCGCTCTTCCGATCTGA-3′) primers. Thermo cycling conditions were 2 min at 94 °C followed by 2 cycles of 94 °C for 10 s, 40 °C for 2 min, 68 °C for 1 min; 8 cycles of 94 °C for 10 s, 60 °C for 30 s, 68 °C for 1 min; 15 cycles of 94 °C for 15 s, 60 °C for 30 s, 68 °C for 1 min with an additional 10 s added at each cycle; and 68 °C for 5 min before cooling to 4 °C. Amplified libraries were purified using PureLink PCR micro columns (Invitrogen) and directly used to generate clusters for sequencing-by-synthesis using the Illumina HiSeq 2000 platform. In total, 100 bp single-end reads were obtained by sequencing to generate >300 million reads for the 34 samples.
Data were analysed using Galaxy39: Illumina reads were converted to FASTQ Sanger format using FASTQ Groomer, the first 27 bp at their 5′ends of the reads were trimmed using FASTQ Trimmer to remove the polyA and adapters sequences and mapped to human hg19 genome using Burrows–Wheeler Alignment tools40 with Galaxy's default settings allowing 4% of missing alignments. All those tools are included in the Galaxy NGS toolset.
Quantitative RT–PCR
RT–qPCR analyses were performed as described41. The human aSynL:total mRNA ratio was quantified in terms of ΔΔCt41 using primer pair Lh for the human long form (HaSynLfw (5′-CTGACACAAAGGACAAA-3′) and HaSynLrv (5′-TTCCGAGTGTAGGGTTAATGTT-3′)) and primer pair Th for human total (HaSynTfw (5′-AGGGTGTTCTCTATGTAGG-3′) and HaSynTrv (5′-ACTGTCTTCTGGGCTACTGC-3′)). For analysis of either mouse or rat, primer pairs mrL (RaSynLfw (5′-AACTTCTTGAGAACAGCAACAA-3′) and RaSynLrv (5′-CTCCCCTCTCACTACAG-3′)) and mrT (RaSynTfw (5′-CAACGTGCCCAGTCA-3′) RaSynTrv (5′-GGATGCTGAGGGGCAGGT-3′)) were used.
In situ hybridization
In situ hybridization (ISH) were performed using QuantiGene ViewRNA ISH Cell Assay (Panomics) following the manufacturer's instructions, with QG ViewRNA TYPE 8 Probe Sets (Panomics) designed to target either human aSyn CDS sequences (bases 264-634 from NM_000345.3; Panomics) or to target human aSynL 3′UTR sequences (bases 1,180–1,760 from NM_000345.3).
Primary neurons cultures
Cultures of rodent neurons were prepared using standard methods as described42. Cells were maintained in vitro for 3–5 days before drug treatments or transfection using Lipofectamine 2000 (Invitrogen) following the manufacturer's instructions.
Western blotting
Western blotting was performed according to the manufacturer's protocols with NuPage Bis-Tris Mini Gel and Xcell II Blot Module (Invitrogen)43 with alpha-synuclein antibody (C20, Santa Cruz), Tom20 (Abnova), synaptophysin (Millipore) and β-actin (Abcam, 1:400).
Northern blotting
Northern blots were performed using the NorthernMax kit (Ambion) following the manufacturer's instructions.Ten microgram of total RNA was purified using the miRNeasy kit (Qiagen) and loaded per lane. Probes for northern blots were generated from a human brain cDNA template by PCR amplification using primers HNBaSynTfw (5′-AGCCATGGATGTATTCATGAAAGGA-3′) and HNBaSynTrv (5′-TTAGGCTTCAGGTTCGTAGTC-3′) for the human aSyn CDS probe, and HNBaSynLfw (5′-GATGTGTTTTATTCACTTGTG-3′) and HNBaSynLrv (5′-AAAAGGCTCAATTAAAAATGTATAAC-3′) for the 3′UTR-specific probe.
aSyn protein quantification
Human aSyn protein levels were determined using the aSyn Human ELISA kit (Invitrogen). Absorbance was read on a VersaMax ELISA Microplate Reader (Molecular Devices, Inc.) at 450 nm. The amount of human aSyn was normalized to total cellular protein as determined with the DC Protein Assay Reagent kit (Bio-Rad). For subcellular compartment quantifications, mitochondria were purified using the Qproteome Mitochondria Isolation Kit (Qiagen) and membrane fractions were isolated using the Subcellular Protein Fractionation kit (Pierce) following the manufacturers' instructions; aSyn protein levels were then quantified by ELISA as above. Mitochondrial preparations were validated by western blot analysis for Tom20 and synaptophysin (Supplementary Fig. S6).
Nascent RNA capture
Briefly, cells were incubated with EU in the culture medium, which is incorporated into the newly transcribed RNA, for the indicated period, followed by a chase period in the absence of EU. At different time points during the chase, total RNA is extracted using the miRNeasy kit (Qiagen). From this total population, labelled RNA is captured using the Click-iT Nascent RNA Capture Kit (Invitrogen) following the manufacturer's instructions; total and nascent RNA were then subjected to RT–qPCR analysis.
Immunocytochemistry
Cells were immunostained with Rabbit anti-aSyn (Santa Cruz, 1:200) or Mouse anti-Synaptophysin (Millipore, 1:100) as primary antibodies, and Alexa 555 goat anti-rabbit IgG or Alexa 633 goat anti-mouse IgG (Invitrogen) secondary antibodies. MitoTracker-Orange (Invitrogen, 1:10,000) was added into media for 15–20 min in living cell culture. Fluorescent microscopy was performed using a Zeiss LSM510 Meta confocal microscope. Colocalization analyses were done in R using EBImage package; using Pearson's correlation coefficient.
Luciferase assays
The human SH-SY5Y neuroblastoma cell line (ATCC) was cultured following the distributor's instructions. Cells were plated at a density of 4×10⁵ cells per well (in 48-well plates) in wells coated with 0.1% gelatin (Specialty Media, Millipore) 24 h before transfection. Transfections were performed with Lipofectamine 2000 reagent (Invitrogen) following the manufacturer's instructions. The human HEK-293T cell line (ATCC) was cultured in DMEM (Invitrogen) supplemented with 10% fetal bovine serum (Invitrogen). Cells were plated at a density of 8×10³ cells per well (96-well plates). Mir-34b-3p precursor, specific anti-miR Mir-34b-3p inhibitor, anti-miR negative control #1 and pre-miR negative control #1 were purchased from Ambion. Cells were co-transfected with luciferase reporter plasmids and a small RNA or inhibitor (as indicated) using siPort NeoFx reagent (Ambion) following the manufacturer's protocol. Luciferase and Renilla activities were measured 24 or 48 h after transfection using Dual-Glo luciferase assay system (Promega).
Plasmids
Dual hRen/hLuc pEZX-MT01 plasmid with the first 1,074 bp ('Long', HmiT017582-MT01) or 560 bp ('Short', HmiT017583-MT01) of human aSyn 3′UTR downstream of luciferase or control vector (CmiT000001-MT01) were purchased from Genecopoeia. Point mutant corresponding to rs356165 C>T and rs78991202 A>C were generated from HmiT017582-MT01 by site-directed mutagenesis (Genewiz). Plasmids expressing a GFP–aSyn fusion with either a long (1,074 bp) or a short (560 bp) 3′UTR were generated by insertion in a pEGFP-C1vector (Clontech) between its _Xho_I and _Hind_III restriction sites of _Hind_III/_Xho_I digested PCR products obtained from human brain cDNA using the forward primer _Xho_I-Start (5′-ATCTCGAGCCATGGATGTATTCATGAAAGGA-3′) with either _Hind_III-275 (5′-CAAAGCTTAGGTGTTTTTAATTTGTTTTAACATCGT-3′) or _Hind_III-1074 (5′-CAAAGCTTCATGGTCGAATATTATTTATTGTCAGAA-3′) as a reverse primer. PolyA-disrupted vector was generated from pEGFP-aSyn-Long 3′UTR; the putative PolyA signal at position 542–552 of the aSyn 3′UTR '5′-AATTAAAATAA-3′' was deleted by site-directed mutagenesis (Genewiz).
Human autopsied brain samples
Age-matched samples from PD patients (5 female, 12 male, average age 78.29±5.95), unaffected individuals (5 female, 12 male, average age 74.05±13.04) or amyotrophic lateral sclerosis patients (7 female, 9 male, average age 70.02±11.01) BA9 area brain samples were obtained from the New York Brain Bank44. Samples were provided devoid of any personal information.
Statistical analysis
Results are given as mean±s.e.m. Where appropriate, statistical analysis were performed with analysis of variance test followed by the Bonferroni corrected tests. Otherwise, comparisons between groups were conducted using Student's _t_-test.
QTL analysis
Data from cerebral cortex transcriptome-wide gene expression analyses, as well as genome-wide SNP analyses for 183 non affected individuals and 182 Alzheimer's affected individuals, were previously described23. These were downloaded (http://labs.med.miami.edu/myers/LFuN/LFuN.html) and reanalysed. The rQTL for each sample was determined as a ratio of the value for probes GI_6806896-I and GI_6806897-A. Subsequently, the rQTL value was provided as a continuous numeric trait variable in the gplink assoc function, filtering for minor allele frequency below 0.05, genotype missingness >0.1 and Hardy–Weinberg equilibrium threshold of 0.001. Haploview was used to generate a Manhattan plot of the output data. To evaluate the effect of other SNPs at the SNCA locus independently of rs356168, the aSynL:total ratio values were corrected for each samples for rs356168 allelic load by fitting of a linear regression (ratio ~a.AL+b, with ratio the aSynL:total ratio and AL the rs356168 allelic load) model using R lm function. Residuals obtained by this operation were then used as the aSynL:total ratio corrected for rs356168 and analysed for quantitative trait association analysis in gplink.
Additional information
Acccession codes: Sequences for RNA transcripts provided in Supplementary Data 1,2,3 and 4 have been deposited in the Gene Expression Omnibus database under accession code GSE40710.
How to cite this article: Rhinn, H. et al. Alternative α-synuclein transcript usage as a convergent mechanism in Parkinson's disease pathology. Nat. Commun. 3:1084 doi: 10.1038/2032 (2012).
Accession codes
Accessions
Gene Expression Omnibus
References
- Dauer, W. & Przedborski, S. Parkinson's disease: mechanisms and models. Neuron 39, 889–909 (2003).
Article CAS Google Scholar - Spillantini, M. G. et al. Alpha-synuclein in Lewy bodies. Nature 388, 839–840 (1997).
Article ADS CAS Google Scholar - Singleton, A. B. et al. alpha-Synuclein locus triplication causes Parkinson's disease. Science 302, 841 (2003).
Article CAS Google Scholar - Polymeropoulos, M. H. et al. Mutation in the alpha-synuclein gene identified in families with Parkinson's disease. Science 276, 2045–2047 (1997).
Article CAS Google Scholar - Satake, W. et al. Genome-wide association study identifies common variants at four loci as genetic risk factors for Parkinson's disease. Nat. Genet. 41, 1303–1307 (2009).
Article CAS Google Scholar - Simon-Sanchez, J. et al. Genome-wide association study reveals genetic risk underlying Parkinson's disease. Nat. Genet. 41, 1308–1312 (2009).
Article CAS Google Scholar - Nalls, M. A. et al. Imputation of sequence variants for identification of genetic risks for Parkinson's disease: a meta-analysis of genome-wide association studies. Lancet 377, 641–649 (2011).
Article Google Scholar - Wan, O. W. & Chung, K. K. The role of alpha-synuclein oligomerization and aggregation in cellular and animal models of Parkinson's disease. PLoS One 7, e38545 (2012).
Article ADS CAS Google Scholar - Burre, J. et al. Alpha-synuclein promotes SNARE-complex assembly in vivo and in vitro. Science 329, 1663–1667 (2010).
Article ADS CAS Google Scholar - Abeliovich, A. et al. Mice lacking alpha-synuclein display functional deficits in the nigrostriatal dopamine system. Neuron 25, 239–252 (2000).
Article CAS Google Scholar - Devi, L., Raghavendran, V., Prabhu, B. M., Avadhani, N. G. & Anandatheerthavarada, H. K. Mitochondrial import and accumulation of alpha-synuclein impair complex I in human dopaminergic neuronal cultures and Parkinson disease brain. J. Biol. Chem. 283, 9089–9100 (2008).
Article CAS Google Scholar - Lesnick, T. G. et al. A genomic pathway approach to a complex disease: axon guidance and Parkinson disease. PLoS Genet. 3, e98 (2007).
Article Google Scholar - Moran, L. B. et al. Whole genome expression profiling of the medial and lateral substantia nigra in Parkinson's disease. Neurogenetics 7, 1–11 (2006).
Article CAS Google Scholar - Zhang, Y., James, M., Middleton, F. A. & Davis, R. L. Transcriptional analysis of multiple brain regions in Parkinson's disease supports the involvement of specific protein processing, energy metabolism, and signaling pathways, and suggests novel disease mechanisms. Am. J. Med. Genet. B Neuropsychiatr. Genet. 137B, 5–16 (2005).
Article Google Scholar - Zheng, B. et al. PGC-1alpha, a potential therapeutic target for early intervention in Parkinson's disease. Sci. Transl. Med. 2, 52ra73 (2010).
Article Google Scholar - Hudson, N. J., Reverter, A. & Dalrymple, B. P. A differential wiring analysis of expression data correctly identifies the gene containing the causal mutation. PLoS Comput. Biol. 5, e1000382 (2009).
Article ADS Google Scholar - Presson, A. P. et al. Integrated weighted gene co-expression network analysis with an application to chronic fatigue syndrome. BMC Syst. Biol. 2, 95 (2008).
Article Google Scholar - D'Haeseleer, P., Liang, S. & Somogyi, R. Genetic network inference: from co-expression clustering to reverse engineering. Bioinformatics 16, 707–726 (2000).
Article CAS Google Scholar - Margolin, A. A. et al. ARACNE: an algorithm for the reconstruction of gene regulatory networks in a mammalian cellular context. BMC Bioinformatics 7, S7 (2006).
Article Google Scholar - Reverter, A., Hudson, N. J., Nagaraj, S. H., Perez-Enciso, M. & Dalrymple, B. P. Regulatory impact factors: unraveling the transcriptional regulation of complex traits from expression data. Bioinformatics 26, 896–904 (2010).
Article CAS Google Scholar - Myers, A. J. et al. A survey of genetic human cortical gene expression. Nat. Genet. 39, 1494–1499 (2007).
Article CAS Google Scholar - Braak, H. et al. Nigral and extranigral pathology in Parkinson's disease. J. Neural. Transm. Suppl. 46, 15–31 (1995).
CAS PubMed Google Scholar - Webster, J. A. et al. Genetic control of human brain transcript expression in Alzheimer disease. Am. J. Hum. Genet. 84, 445–458 (2009).
Article CAS Google Scholar - Kim, J. et al. A MicroRNA feedback circuit in midbrain dopamine neurons. Science 317, 1220–1224 (2007).
Article ADS CAS Google Scholar - Kuo, Y. M. et al. Extensive enteric nervous system abnormalities in mice transgenic for artificial chromosomes containing Parkinson disease-associated alpha-synuclein gene mutations precede central nervous system changes. Hum. Mol. Genet. 19, 1633–1650 (2010).
Article CAS Google Scholar - Mosharov, E. V. et al. Interplay between cytosolic dopamine, calcium, and alpha-synuclein causes selective death of substantia nigra neurons. Neuron 62, 218–229 (2009).
Article CAS Google Scholar - Park, S. S., Schulz, E. M. & Lee, D. Disruption of dopamine homeostasis underlies selective neurodegeneration mediated by alpha-synuclein. Eur. J. Neurosci. 26, 3104–3112 (2007).
Article Google Scholar - Alberio, T. et al. Proteomic analysis of dopamine and alpha-synuclein interplay in a cellular model of Parkinson's disease pathogenesis. FEBS J. 277, 4909–4919 (2010).
Article CAS Google Scholar - Gomez-Santos, C. et al. Dopamine induces autophagic cell death and alpha-synuclein increase in human neuroblastoma SH-SY5Y cells. J. Neurosci. Res. 73, 341–350 (2003).
Article CAS Google Scholar - Freedman, M. L. et al. Principles for the post-GWAS functional characterization of cancer risk loci. Nat. Genet. 43, 513–518 (2011).
Article CAS Google Scholar - Lewis, B. P., Burge, C. B. & Bartel, D. P. Conserved seed pairing, often flanked by adenosines, indicates that thousands of human genes are microRNA targets. Cell 120, 15–20 (2005).
Article CAS Google Scholar - Vasudevan, S., Tong, Y. & Steitz, J. A. Switching from repression to activation: microRNAs can up-regulate translation. Science 318, 1931–1934 (2007).
Article ADS CAS Google Scholar - Junn, E. et al. Repression of alpha-synuclein expression and toxicity by microRNA-7. Proc. Natl Acad. Sci. USA 106, 13052–13057 (2009).
Article ADS CAS Google Scholar - Sylvestre, J., Margeot, A., Jacq, C., Dujardin, G. & Corral-Debrinski, M. The role of the 3′ untranslated region in mRNA sorting to the vicinity of mitochondria is conserved from yeast to human cells. Mol. Biol. Cell 14, 3848–3856 (2003).
Article CAS Google Scholar - Corral-Debrinski, M., Blugeon, C. & Jacq, C. In yeast, the 3′ untranslated region or the presequence of ATM1 is required for the exclusive localization of its mRNA to the vicinity of mitochondria. Mol. Cell Biol. 20, 7881–7892 (2000).
Article CAS Google Scholar - Russo, A. et al. cis-acting sequences and trans-acting factors in the localization of mRNA for mitochondrial ribosomal proteins. Biochim. Biophys. Acta 1779, 820–829 (2008).
Article CAS Google Scholar - Kamp, F. et al. Inhibition of mitochondrial fusion by alpha-synuclein is rescued by PINK1, Parkin and DJ-1. EMBO J. 29, 3571–3589 (2010).
Article CAS Google Scholar - Subramanian, A. et al. Gene set enrichment analysis: a knowledge-based approach for interpreting genome-wide expression profiles. Proc. Natl Acad. Sci. USA 102, 15545–15550 (2005).
Article ADS CAS Google Scholar - Goecks, J., Nekrutenko, A. & Taylor, J. Galaxy: a comprehensive approach for supporting accessible, reproducible, and transparent computational research in the life sciences. Genome Biol. 11, R86 (2010).
Article Google Scholar - Langmead, B., Trapnell, C., Pop, M. & Salzberg, S. L. Ultrafast and memory-efficient alignment of short DNA sequences to the human genome. Genome Biol. 10, R25 (2009).
Article Google Scholar - Rhinn, H. et al. Housekeeping while brain's storming Validation of normalizing factors for gene expression studies in a murine model of traumatic brain injury. BMC Mol. Biol. 9, 62 (2008).
Article Google Scholar - Qiang, L., Yu, W., Andreadis, A., Luo, M. & Baas, P. W. Tau protects microtubules in the axon from severing by katanin. J. Neurosci. 26, 3120–3129 (2006).
Article CAS Google Scholar - Staropoli, J. F. et al. Parkin is a component of an SCF-like ubiquitin ligase complex and protects postmitotic neurons from kainate excitotoxicity. Neuron 37, 735–749 (2003).
Article CAS Google Scholar - Vonsattel, J. P., Del Amaya, M. P. & Keller, C. E. Twenty-first century brain banking. Processing brains for research: the Columbia University methods. Acta Neuropathol. 115, 509–532 (2008).
Article Google Scholar - Gruber, A. R., Lorenz, R., Bernhart, S. H., Neubock, R. & Hofacker, I. L. The Vienna RNA websuite. Nucleic Acids Res. 36, W70–W74 (2008).
Article CAS Google Scholar
Acknowledgements
We thank Arnon Rosenthal and Oliver Hobert for comments on the manuscript, Jie Shen for technical help, and the New York Brain Bank and Jean Paul Vonsattel for banked tissue samples. We thank Jane Dunning for assistance in the rodent preparation. We are grateful to the many generous contributors who made their data publicly available at the Gene Expression Omnibus or on their lab's website. The work was supported by grants from the Michael J. Fox Foundation, the NIH and the NINDS (RO1NS064433).
Author information
Authors and Affiliations
- Departments of Pathology and Neurology, Center for Neurobiology and Behavior, and Taub Institute, Columbia University, College of Physicians and Surgeons 15-403, 630 West 168th Street, New York, 10032, New York, USA
Herve Rhinn, Liang Qiang, Toru Yamashita, David Rhee, Ari Zolin, William Vanti & Asa Abeliovich
Authors
- Herve Rhinn
You can also search for this author inPubMed Google Scholar - Liang Qiang
You can also search for this author inPubMed Google Scholar - Toru Yamashita
You can also search for this author inPubMed Google Scholar - David Rhee
You can also search for this author inPubMed Google Scholar - Ari Zolin
You can also search for this author inPubMed Google Scholar - William Vanti
You can also search for this author inPubMed Google Scholar - Asa Abeliovich
You can also search for this author inPubMed Google Scholar
Contributions
A.A. and H.R. designed studies, interpreted data and wrote the manuscript. H.R. performed the bioinformatics analysis and the molecular biology experiments. L.Q., A.Z. and W. V. performed the cell culture experiments. T.Y. performed the animal experiments. D. R. performed the northern blot.
Corresponding author
Correspondence toAsa Abeliovich.
Ethics declarations
Competing interests
The authors declare no competing financial interests.
Supplementary information
Supplementary Figures, Tables, Methods and References
Supplementary Figures S1-S8, Supplementary Tables S1-S5, Supplementary Methods and Supplementary References (PDF 3283 kb)
Supplementary Data 1
List of probesets differentially expressed in PD vs unaffected SN samples (GEO GSE7621) that show a nominally significant difference in expression levels (p-value <5.10−2). (XLSX 19 kb)
Supplementary Data 2
List of genes differentially correlated with aSynL in PD vs unaffected SN as in Figure 1c, presented with their aSynL coexpression correlation coefficients. (XLSX 112 kb)
Supplementary Data 3
List of genes differentially correlated with aSynL in rs356168 CC vs TT non PD-affected cortex samples as in Fig. 1f, presented with their aSynL coexpression correlation coefficients. (XLSX 61 kb)
Supplementary Data 4
Detailed results of aSyn ratio-QTL analysis. A List of SNPs found to be significantly associated with aSynLtotal ratio in unaffected cortex, as in Fig. 1f (p-value <10−3; linear regression analysis between aSynLtotal ratio and each variant allelic load). (XLSX 46 kb)
Rights and permissions
About this article
Cite this article
Rhinn, H., Qiang, L., Yamashita, T. et al. Alternative α-synuclein transcript usage as a convergent mechanism in Parkinson's disease pathology.Nat Commun 3, 1084 (2012). https://doi.org/10.1038/ncomms2032
- Received: 28 March 2012
- Accepted: 30 July 2012
- Published: 25 September 2012
- DOI: https://doi.org/10.1038/ncomms2032