The effects of human population structure on large genetic association studies (original) (raw)
Main
Recent advances in genotyping technologies and increases in genetic marker availability have paved the way for association studies on genomic scales1. A potential problem for every population-based association study is the presence of undetected population structure that can mimic the signal of association and lead to more false positives or to missed real effects (Fig. 1). These concerns have influenced the design, interpretation and funding of association studies during the past decade2. Still, levels of population structure in many ethnic groups are typically small, and despite concerns3,4, there is an increasing sense5,6 that the problem is not serious if association studies avoid gross levels of population structure.
Figure 1: The effects of population structure at a SNP locus.
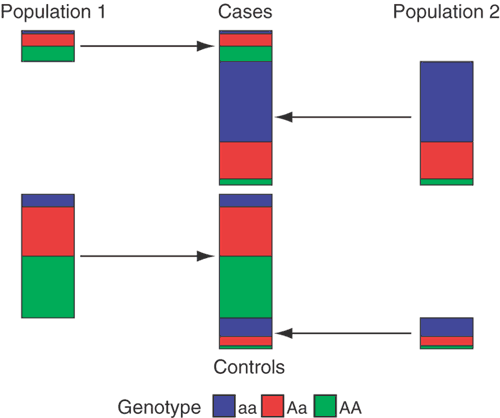
If the study population consists of subpopulations that differ genetically, and if disease prevalence also differs across these subpopulations, then the proportions of cases and controls sampled from each subpopulation will tend to differ, as will allele or genotype frequencies between cases and controls at any locus at which the subpopulations differ. The figure shows an example of this scenario with two populations in which the cases have an excess of individuals from population 2 and population 2 has a lower frequency of allele A than population 1. In this example, the structure mimics the signal of association in that there is a significant difference in allele and genotype frequencies between cases and controls.
Upcoming association studies will genotype many markers and evaluate many individuals, owing to the realization that case-control studies powered to detect realistic effect sizes will typically require thousands of individuals7,8. This concern raises two general questions: (i) how much underlying structure is there in various human populations and when might this pose problems for large-scale association studies, and (ii) how accurate and efficient are available methods for correcting for population structure in case-control studies?
Using genome-wide single-nucleotide polymorphisms (SNPs) in multiple populations (European Americans, African Americans and Asians of known Japanese or Chinese ancestry), we quantified the extent of population structure within and between the populations and then examined the consequences of population structure for association studies.
Using Bayesian methodology, we fitted a statistical model of population structure that is natural for SNP loci9,10,11 to two versions of our data set: data set I, the whole data set (partitioned into the three main subpopulations); and data set II, the Asian sample (partitioned into Japanese and Chinese subpopulations). Fitting a statistical model has several advantages over traditional approaches that use summary statistics such as _F_ST (ref. 12) to assess population structure. First, with abundant SNP loci, the model can be validated by checking whether it actually fits the data (Fig. 2). Second, when the model fits well, it can be used statistically to extrapolate beyond the actual data (e.g., to larger sample sizes). Third, using the model can provide better estimates of parameters that quantify population differentiation than can traditional approaches10,13. The present model measures the difference of each population from a hypothetical average, or ancestral, population by a parameter _c_j for each population j. These parameters can be thought of as a generalization of _F_ST (ref. 10).
Figure 2: Differences between actual and predicted values (residuals) in data set II (the Asian sample).
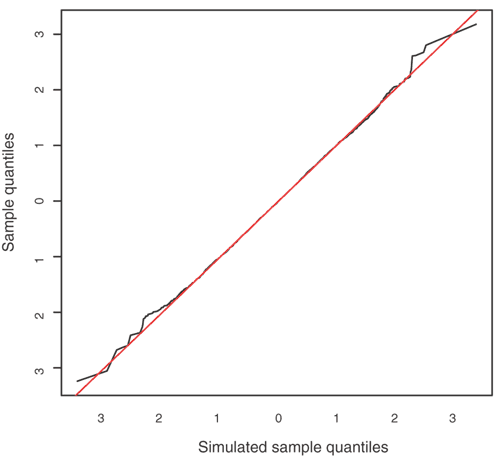
The figure plots the two sets of sorted residuals against each other. The x = y line represents exact agreement between the two sets of residuals, i.e., a perfect fit of the model and data. The fluctuations around the line in the tails of the distributions are expected, as there are relatively fewer points in these parts of the plot.
For data set I, the c estimates were 0.234, 0.116 and 0.152 for the Asian, African American and European American populations, respectively, and _F_ST was estimated to be 0.145. For data set II the c estimates were 0.0085 and 0.016 for the Chinese and Japanese subpopulations, and _F_ST was estimated to be 0.013. These results indicate a substantial difference between the three main populations and a much smaller, but still measurable, difference between the Japanese and Chinese subpopulations. The difference between the Chinese and Japanese subpopulations is consistent with earlier population genetic studies based on many fewer loci14.
We assessed the effect of population structure on association studies in two ways. We simulated cases and controls under the null hypothesis of no genetic effect on disease status. In the first set of simulations, we randomly assigned the individuals in data sets I and II to case or control status according to a model in which disease prevalence differs across subpopulations. Next, to understand the effects of population structure for larger sample sizes, we took advantage of the very good fit of the statistical model (Fig. 2) to simulate samples with the parameter values estimated from our data, again randomly assigning case or control status to the individuals. In addition to the amount of population structure, we examined a range of differences in disease prevalence, as these effects also contribute to false positive results.
In genome-wide applications, association results considered 'real' require higher significance levels than those accepted for single loci, owing to multiple-testing corrections for the thousands of markers tested. Although appropriate genome-wide significance levels are not yet clear15, they are thought to be in the range of 10−4–10−8 (ref. 8). It is therefore important to assess the effects of population structure on tests with P values in this range. We focused on the χ2 (trend) test16,17 for association.
For the relatively few individuals genotyped in this study, the χ2 test is conservative (Fig. 3), which could lead to missed real effects in spite of the structure, though these sample sizes are uncharacteristically small for case-control studies. For larger studies, the consequences of population structure comparable to that in the data are presented in Figure 4. Figure 4a considers the setting in which controls are equally sampled from the three main populations, but because of a difference in disease prevalence, the cases have a different mix of populations. Figure 4b considers a study that intends to examine one main population but doesn't quite succeed. For example, cases may come from only one population but the control set may include small fractions from other populations (10% from each). In each case, these levels of population structure cause substantial difficulties.
Figure 3: Multiplicative change in P values due to population structure in small samples.
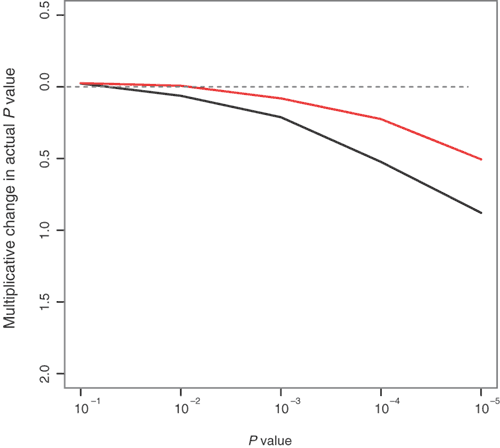
The P values are based on the χ2 (trend) test16,17 for association. Multiplicative change of the P values of the trend statistic, defined as the actual P value divided by the nominal P value for the Asian sample (black line) and whole sample (red line) is shown on log10 scale. Comparing the distribution in this way magnifies the tails of the distribution, i.e., the part of the distribution of greatest interest for studies of many markers. The horizontal line at 0 represents exact agreement between the actual distribution of the trend statistic and the theoretical (χ2) distribution. Values below 0 indicate that the actual distribution has less weight at large values (shorter tails) than the theoretical distribution and the test is conservative, potentially leading to loss of power and missed real effects. Values above 0 indicate that the actual distribution has longer tails than the theoretical distribution and the test is anticonservative, leading to excessive false positive results. For both data sets, the test statistic seems to be conservative, resulting from a trade-off between the effect of structure, which tends to make the test anticonservative, and the inadequacy of the asymptotic χ12 distribution for such small sample sizes (Supplementary Note online), which tends to make the test conservative. The numbers of individuals genotyped in these data is small for case-control applications, though typical of some early-stage pharmacogenetics studies29.
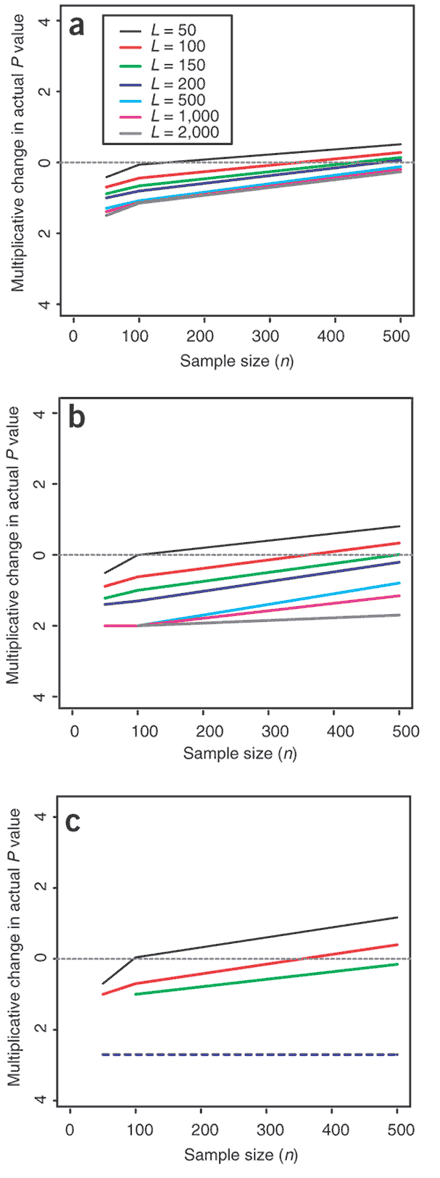
Figure 4: Multiplicative change in P values due to population structure in large samples (shown on log10 scale).
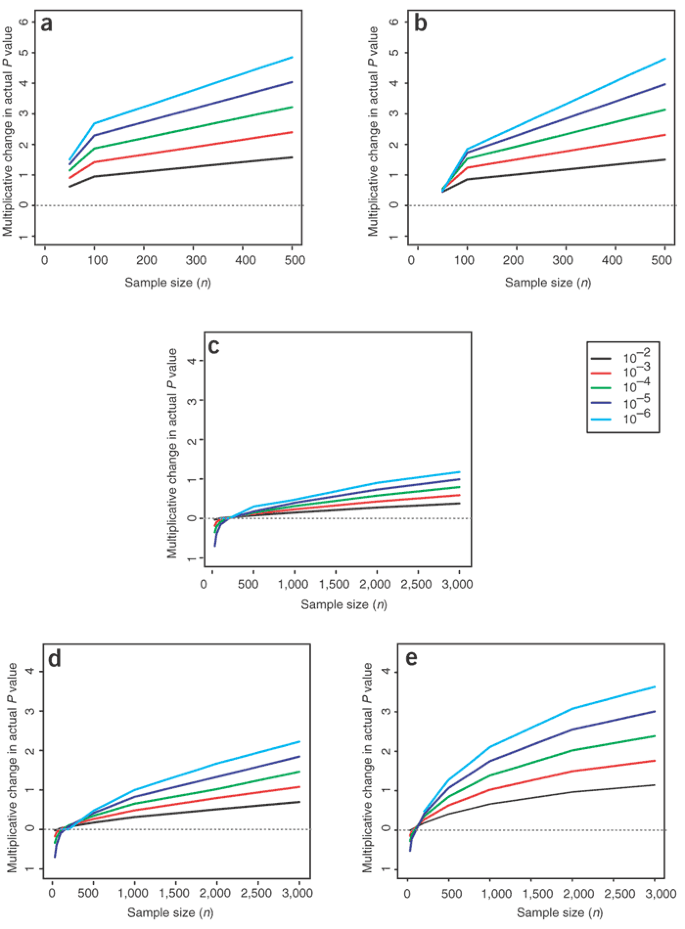
Multiplicative change in P value under scenarios A1 (a) and A2 (b), in which three populations were simulated with the same structure found in the whole sample. (c–e) Multiplicative change under scenarios B1–B3, in which samples were simulated from two populations with the same level of structure as estimated from the Asian sample. Scenarios are described in Methods. As sample size increases, the effects of structure become more severe (see Supplementary Note online for more information). The key indicates the different P values considered.
Studies usually avoid combining individuals across continental groups, and a more common scenario involves the combination of different individuals within a population. The average _F_ST between pairs of European populations (Sardinian, Danish, English, Greek and Italian) has been reported to be 0.01715, with an average _F_ST excluding Sardinia of 0.0102 (Table 2.3.1A in ref. 14). The smaller of these values is similar to the estimated _F_ST from our Chinese and Japanese subpopulations of 0.0133 (average c = 0.0122), suggesting that the level of structure between these two samples is comparable to that in current mixed European populations. The consequences of this level of structure for association studies depend on the difference in disease prevalence between subpopulations. Differences in disease prevalence of a factor of two or more are not uncommon, even within countries3,18. Much of this variation may be due to environmental or geographical risk factors. If studies do not (or cannot) measure and correct for such factors, serious problems could arise (Fig. 4e). In addition, residual variance in disease risk remains after allowance for confounders, leaving some difficulties even for large studies and small P values (Fig. 4c,d).
Several statistical methods have recently been developed to account for population structure so that association studies can proceed even when structure is present16,19,20,21,22,23,24,25. One commonly used method, Genomic Control, uses a set of anonymous markers to correct for population stratification16. The method is based on the observation that population structure changes the null distribution of the χ2 statistic by a simple multiplicative factor, which may be estimated by a collection of L anonymous markers. Here we extend previous assessments of Genomic Control3,16,20,26,27 to consider large sample sizes and small P values.
In the scenarios described above, when only a small number of loci (L = 50–100) are used to correct for structure, the Genomic Control test is often anticonservative (that is, the actual P value is larger than that given by the χ2 distribution) and still results in false positives (Figs. 5 and 6). Conversely, when L is large, the test is conservative, which avoids false positives but results in a loss of power. For the levels of structure within the main population groups (Fig. 6) and realistic differences in disease prevalence, the latter consequence does not seem serious. But with more extreme population structure, such as a small degree of admixture from across populations (Fig. 5) or large differences in disease prevalence between subpopulations (data not shown), this consequence can render the correction ineffective. In some studies it may be unrealistic to genotype the many Genomic Control markers necessary to avoid false positive results. In such cases, methods that use fewer ancestry-informative SNPs4,25 may be more appropriate.
Figure 5: Multiplicative change in P values due to population structure after Genomic Control correction for scenario A2.
Nominal P values of 10−3 (a), 10−4 (b), 10−5 (c) are plotted for each scenario, and each plot shows the multiplicative change (on a log10 scale) for a range of sample sizes (n) and for numbers of loci (L) used in the Genomic Control correction (see key in a). When only a small number of loci (L < 100) are used in the Genomic Control correction, the effects of structure are not removed and the test remains anticonservative (lines above 0), effectively because the correction parameter λ is not estimated well enough. When more loci are used (L ≥ 500) the Genomic Control correction results in a conservative test (lines below 0). (There is an asymmetry caused by the nonlinearity: underestimation of λ, though rarer, has a much more serious consequence than overestimation.) This pattern becomes more extreme for smaller nominal P values and larger sample sizes; for example, with L ≥ 500 loci, we observed no examples with P values <10−5 in the 108 simulations (c). The blue dotted line represents an upper 95% confidence limit for the actual P value given this observation.
Figure 6: Multiplicative change in P values due to population structure after Genomic Control correction for scenarios B1 (a–c), B2 (d–f) and B3 (g–i).
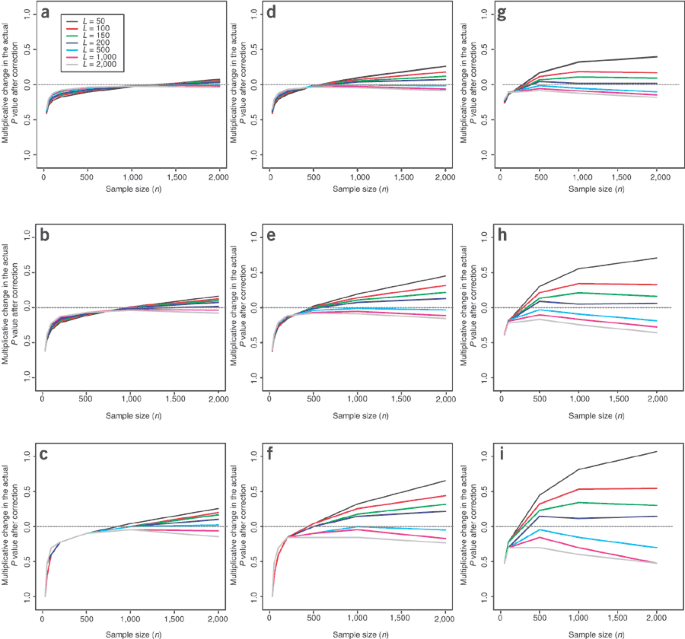
Each plot shows the multiplicative change for a range of sample sizes (n) and for numbers of loci (L) used in the Genomic Control correction (on a log10 scale). For larger sample sizes, when only a small number of loci (L < 100) are used in the Genomic Control correction, the effects of structure are not removed and the test is anticonservative (lines above 0), whereas when more loci are used (L ≥ 500), the Genomic Control correction results in a conservative test (lines below 0). This pattern becomes more extreme for smaller nominal P values and larger sample sizes (c,f,i). Nominal P values were 10−3 (a,d,g), 10−4 (b,e,h) and 10−5 (c,f,i).
Large-scale association studies are emerging as a tool for understanding the genetics of common human diseases. We used a genome-wide SNP collection to measure the extent of population structure across three population groups (European American, African American and Asian) and within the Asian group. Association studies typically avoid combining individuals across populations, but a large, multicenter study might inadvertently include some individuals outside the primary study group or some individuals with substantial but undetected levels of admixture. Even small amounts of population admixture can undermine an association study and lead to false positive results. These adverse effects increase markedly with sample size. For the size of study required for many complex diseases7,8, relatively modest levels of structure within a population can have serious consequences. Population structure can also lead to missed real associations26, so it cannot safely be ignored in future association studies. Finally, we showed that Genomic Control will not adequately correct for population structure if too few loci are used in estimating the correction factor. If enough loci are used, then the test will typically be approximately calibrated, although for more extreme population structure, (larger λ) it can become unacceptably conservative.
Methods
Data set.
The data set consists of genotype data from 42 European Americans, 43 African Americans and 42 Asians. The data were generated by Orchid Biosciences as part of The SNP Consortium. The Asian sample consists of 10 subjects with Han Chinese ancestry and 32 subjects with Japanese ancestry. There were 12,337 markers (in European Americans), 8,134 markers (in African Americans) and 13,016 markers (in Asians) with maximum 25% missing data. Of these, 3,845 markers were common to all three populations (data set I) and 8,801 markers segregated within the Asian sample (data set II). Pairwise plots of sample allele frequencies are shown in Supplementary Note online.
Measuring population diversity.
To assess the levels of population differentiation in our data sets, we fitted a statistical model of population structure9,10,11. The model takes the form

where P is the number of populations, L is the number of loci, n ij is the number of chromosomes typed at the _i_th SNP in the _j_th population and x ij is the number of copies of the chosen SNP variant at locus i in population j. The variance parameter c j specifies how far the _j_th subpopulation's allele frequencies tend to be from typical values. Our c j parameters are analogous to _F_ST values, but with one for each population10,13. We estimated the model parameters in a Bayesian framework as described in Supplementary Note online.
We assessed the fit of the model using the standardized residuals10:
where Π̂i and ĉ j are the posterior mean values of π i and c j. We simulated a data set using the parameters Π̂i and ĉ j, fitted the model to the simulated data and compared the residuals with those obtained from fitting the model to the observed data. The very good agreement between the two sets of residuals (Fig. 2) indicates that the model fits the data well. A similarly good fit was obtained for data set I (data not shown).
Measuring association at a SNP locus and Genomic Control.
As in ref. 16, we measured association at a given SNP locus (with alleles A and a) using Armitage's trend test for an additive genetic model:
where N is the total sample size, R is the number of cases, _n_1 and _n_2 are the total number of individuals with genotypes Aa and AA, respectively, and _r_1 and _r_2 are the number of cases with genotypes Aa and AA, respectively. In the absence of population structure, under the null hypothesis of no association, this test statistic has an asymptotic χ12 distribution. The statistic can be derived as a score test statistic for the additive genetic effect on log-odds scale28.
The key idea underlying the Genomic Control16 approach is that population structure elevates the test statistic by an approximate constant factor: _Y_2 ∼λ_χ_12. The value of λ depends on the nature of the population structure. Because population structure is expected to have a similar effect on all loci across the genome, λ can be estimated from the empirical distribution of _Y_2 from a set of L unlinked markers. As in ref. 27, we estimated λ as the median value of the trend statistic divided by 0.456, where values below 1 are changed to 1.
The pattern of results in Figure 6 reflects, in part, nonlinearity in the effects of estimating λ. With few loci, there is less precision in estimating λ. When λ is near 1, the truncation induces overestimation of λ, which tends to make the test conservative. The overestimation, and hence the conservativeness, increases as L decreases. For values of λ further from 1 the truncation effect diminishes. Here, a nonlinearity means that over- and underestimation of λ have different effects on the true P value, so that increasing the variance of the estimator (decreasing L) gives a less conservative test. Earlier studies16,20,27 seem to have considered the former effect, but the latter may be more relevant for large studies.
Assigning case or control status to data set I and data set II.
To assess the effects of population structure on a data set with a similar structure to the whole sample, we randomly assigned the samples case or control status as described in Supplementary Note online.
Simulating data sets with population structure.
We simulated data sets with 10,000 unlinked loci using the model specified above for the parameter values estimated for each data set and the same number of cases and controls (here and in Figs. 4,5,6 denoted n). Unless specified, we sampled controls uniformly from populations and sampled cases according to the Relative Risk (RR) proportions specified below. To mimic the large-scale structure between the three main populations, we considered two different scenarios:
A1: three populations, _c_1 = 0.234, _c_2 = 0.116, _c_3 = 0.152, RR = 1:1:3
A2: three populations, _c_1 = 0.234, _c_2 = 0.116, _c_3 = 0.152, with all controls and 80% of cases sampled from population 3 and 10% of cases sampled from the other two populations.
We varied the number of cases (and controls) and the number of independent loci used for the Genomic Control correction.
To mimic the small-scale structure between the Japanese and Chinese subpopulations, and similar levels of structure between European populations, we considered the following five scenarios:
B1: two populations, _c_1 = 0.0085, _c_2 = 0.016, RR = 1:1.3
B2: two populations, _c_1 = 0.0085, _c_2 = 0.016, RR = 1:1.5
B3: two populations, _c_1 = 0.0085, _c_2 = 0.016, RR = 1:2.0
B4: four populations, _c_1 = 0.008, _c_2 = 0.01, _c_3 = 0.012, _c_4 = 0.015, RR = 0.5:1:1.5:2
B5: four populations, _c_1 = 0.008, _c_2 = 0.01, _c_3 = 0.012, _c_4 = 0.015, RR = 0.5:1:3:10
Scenarios B1–B3 have the same level of structure as estimated in the Japanese and Chinese subpopulations. Scenario B4 has four populations with approximately the same level of structure as B1–B3. Scenario B5 is the same as B4 but with greater differences in disease prevalence between populations.
URLs.
Information about The SNP Consortium is available at http://snp.cshl.org/.
Note: Supplementary information is available on the Nature Genetics website.
References
- International HapMap Consortium. The International HapMap Project. Nature 426, 789–796 (2003).
- Spence, M.A., Greenberg, D.A., Hodge, S.E. & Vieland, V.J. The emperor's new methods. Am. J. Hum. Genet. 72, 1084–1087 (2003).
Article CAS Google Scholar - Thomas, D.C. & Witte, J.S. Point: population stratification: a problem for case-control studies of candidate-gene associations? Cancer Epidemiol. Biomarkers Prev. 11, 505–512 (2002).
Google Scholar - Ziv, E. & Burchard, E.G. Human population structure and genetic association studies. Pharmacogenomics 4, 431–441 (2003).
Article Google Scholar - Ardlie, K.G., Lunetta, K.L. & Seielstad, M. Testing for population subdivision and association in four case-control studies. Am. J. Hum. Genet. 71, 304–311 (2002).
Article CAS Google Scholar - Wacholder, S., Rothman, N. & Caporaso, N. Counterpoint: bias from population stratification is not a major threat to the validity of conclusions from epidemiological studies of common polymorphisms and cancer. Cancer Epidemiol. Biomarkers Prev. 11, 513–520 (2002).
Google Scholar - Risch, N. & Merikangas, K. The future of genetic studies of complex human diseases. Science 273, 1516–1517 (1996).
Article CAS Google Scholar - Risch, N.J. Searching for genetic determinants in the new millennium. Nature 405, 847–856 (2000).
Article CAS Google Scholar - Balding, D.J. & Nichols, R.A. A method for quantifying differentiation between populations at multi-allelic loci and its implications for investigating identity and paternity. Genetica 96, 3–12 (1995).
Article CAS Google Scholar - Nicholson, G. et al. Assessing population differentiation and isolation from single nucleotide polymorphism data. J. R. Stat. Soc. (B) 64, 695–716 (2002).
Article Google Scholar - Marchini, J.L. & Cardon, L. Discussion of Nicholson et al. J. R. Stat. Soc. (B) 64, 1–21 (2002).
Article Google Scholar - Excoffier, L. Analysis of population subdivision. in Handbook of Statistical Genetics (eds. Balding, D.J., Bishop, M. & Cannings, C.) 271–308 (John Wiley & Sons, New York, 2001).
Google Scholar - Balding, D.J. Likelihood-based inference for genetic correlation coefficients. Theor. Popul. Biol. 63, 221–230 (2003).
Article Google Scholar - Cavalli-Sforza, L.L., Menozzi, P. & Piazza, A. History and Geography of Human Genes (Princeton University Press, Princeton, New Jersey, 1994).
Google Scholar - Storey, J.D. & Tibshirani, R. Statistical significance for genomewide studies. Proc. Natl. Acad. Sci. USA 100, 9440–9445 (2003).
Article CAS Google Scholar - Devlin, B. & Roeder, K. Genomic control for association studies. Biometrics 55, 997–1004 (1999).
Article CAS Google Scholar - Sasieni, P.D. From genotypes to genes: doubling the sample size. Biometrics 53, 1253–1261 (1997).
Article CAS Google Scholar - Moller, T. et al. Cancer prevalence in Northern Europe: the EUROPREVAL study. Ann. Oncol. 14, 946–957 (2003).
Article CAS Google Scholar - Pritchard, J.K. & Rosenberg, N.A. Use of unlinked genetic markers to detect population stratification in association studies. Am. J. Hum. Genet. 65, 220–228 (1999).
Article CAS Google Scholar - Reich, D.E. & Goldstein, D.B. Detecting association in a case-control study while correcting for population stratification. Genet. Epidemiol. 20, 4–16 (2001).
Article CAS Google Scholar - Pritchard, J.K., Stephens, M. & Donnelly, P. Inference of population structure using multilocus genotype data. Genetics 155, 945–959 (2000).
CAS Google Scholar - Pritchard, J.K., Stephens, M., Rosenberg, N.A. & Donnelly, P. Association mapping in structured populations. Am. J. Hum. Genet. 67, 170–181 (2000).
Article CAS Google Scholar - Satten, G.A., Flanders, W.D. & Yang, Q. Accounting for unmeasured population substructure in case-control studies of genetic association using a novel latent-class model. Am. J. Hum. Genet. 68, 466–477 (2001).
Article CAS Google Scholar - Ripatti, S., Pitkaniemi, J. & Sillanpaa, M.J. Joint modeling of genetic association and population stratification using latent class models. Genet. Epidemiol. 21 Suppl 1, S409–S414 (2001).
Article Google Scholar - Hoggart, C.J. et al. Control of confounding of genetic associations in stratified populations. Am. J. Hum. Genet. 72, 1492–1504 (2003).
Article CAS Google Scholar - Pritchard, J.K. & Donnelly, P. Case-control studies of association in structured or admixed populations. Theor. Popul. Biol. 60, 227–237 (2001).
Article CAS Google Scholar - Bacanu, S.A., Devlin, B. & Roeder, K. The power of genomic control. Am. J. Hum. Genet. 66, 1933–1944 (2000).
Article CAS Google Scholar - Clayton, D. Population association. in Handbook of Statistical Genetics (eds. Balding, D.J., Bishop, M. & Cannings, C.) 519–540 (John Wiley & Sons, New York, 2001).
Google Scholar - Goldstein, D.B., Tate, S.K. & Sisodiya, S.M. Pharmacogenetics goes genomic. Nat. Rev. Genet. 4, 937–947 (2003).
Article CAS Google Scholar
Acknowledgements
L.R.C. and J.M. thank The Wellcome Trust for support. L.R.C. and P.D. acknowledge the US National Institutes of Health and The SNP Consortium.
Author information
Authors and Affiliations
- Department of Statistics, University of Oxford, 1 South Parks Road, Oxford, OX1 3TG, UK
Jonathan Marchini & Peter Donnelly - Wellcome Trust Center for Human Genetics, University of Oxford, Oxford, OX3 7BN, UK
Lon R Cardon - Genome Quebec and McGill University Genome Center, Montreal, H3A 1A4, Canada
Michael S Phillips
Authors
- Jonathan Marchini
You can also search for this author inPubMed Google Scholar - Lon R Cardon
You can also search for this author inPubMed Google Scholar - Michael S Phillips
You can also search for this author inPubMed Google Scholar - Peter Donnelly
You can also search for this author inPubMed Google Scholar
Corresponding author
Correspondence toPeter Donnelly.
Ethics declarations
Competing interests
The authors declare no competing financial interests.
Supplementary information
Rights and permissions
About this article
Cite this article
Marchini, J., Cardon, L., Phillips, M. et al. The effects of human population structure on large genetic association studies.Nat Genet 36, 512–517 (2004). https://doi.org/10.1038/ng1337
- Received: 01 December 2003
- Accepted: 12 March 2004
- Published: 28 March 2004
- Issue Date: 01 May 2004
- DOI: https://doi.org/10.1038/ng1337