Zika virus directly infects peripheral neurons and induces cell death (original) (raw)
Abstract
Zika virus (ZIKV) infection is associated with neurological disorders of both the CNS and peripheral nervous systems (PNS), yet few studies have directly examined PNS infection. Here we show that intraperitoneally or intraventricularly injected ZIKV in the mouse can infect and impact peripheral neurons in vivo. Moreover, ZIKV productively infects stem-cell-derived human neural crest cells and peripheral neurons in vitro, leading to increased cell death, transcriptional dysregulation and cell-type-specific molecular pathology.
Main
ZIKV, a flavivirus transmitted primarily by Aedes mosquitoes, has spread to a growing number of countries. While most ZIKV-infected patients exhibit few or relatively mild symptoms, including mild fever, skin rash, conjunctivitis, muscle and joint pain, malaise or headache, prenatal ZIKV infection may cause microcephaly and other serious brain anomalies in fetuses or infants1,2. Recent studies of ZIKV pathogenesis in the CNS have shown that ZIKV crosses the placenta and causes microcephaly by targeting cortical neural progenitor cells, inducing cell death and impairing neurodevelopment3,4,5,6,7,8. Other pronounced symptoms of ZIKV infection in children and adults are retro-orbital pain, abdominal pain and diarrhea9, which are associated with the PNS, and more specifically sensory and enteric neurons. In particular, peripheral neuropathy without any CNS symptom in a patient infected with ZIKV has been reported10,11, which is supported by persistent ZIKV detection in the PNS of rhesus macaques12. In addition, ZIKV causes Guillain-Barré syndrome (GBS)1, another PNS disorder. In contrast to CNS model systems3,4,5,6, PNS model systems for investigating ZIKV pathology are limited. In this study, we investigated PNS infection of ZIKV using both in vivo and in vitro model systems.
We adopted type-I interferon receptor–deficient (A129) mice to generate a ZIKV infection model in vivo. ZIKV SZ01 was injected intraperitoneally into 5-week-old A129 mice, which were inspected 3 d later. To determine the potential for ZIKV infection in the PNS, we examined the dorsal root ganglia (DRG) and small intestine from ZIKV-infected and mock-treated mice. We detected the presence of ZIKV in both DRG and small intestine with ZIKV antiserum (Supplementary Fig. 1a,b). In addition, robust ZIKV signals colocalized with neuron-specific class III β-tubulin (Tuj1), indicating that mouse peripheral neurons in the DRG and gut were infected by ZIKV (Supplementary Fig. 1a,b). To test whether PNS infection of ZIKV could also occur in a mouse model of microcephaly5, we injected ZIKV SZ01 into the lateral ventricle of wild-type mouse brains at embryonic day (E) 13.5 and analyzed tissue at postnatal day (P) 1. We also detected ZIKV in the DRG, small intestine and spinal cord, with colocalization with neuronal markers Tuj1 and NeuN or cleaved caspase 3 (cl-Casp3; Fig. 1 and Supplementary Fig. 1c,d), demonstrating that brain-injected ZIKV can infect and impact peripheral neurons in the mouse DRG and gut in vivo.
Figure 1: ZIKV infection results in apoptosis of somatosensory neurons in mouse PNS.
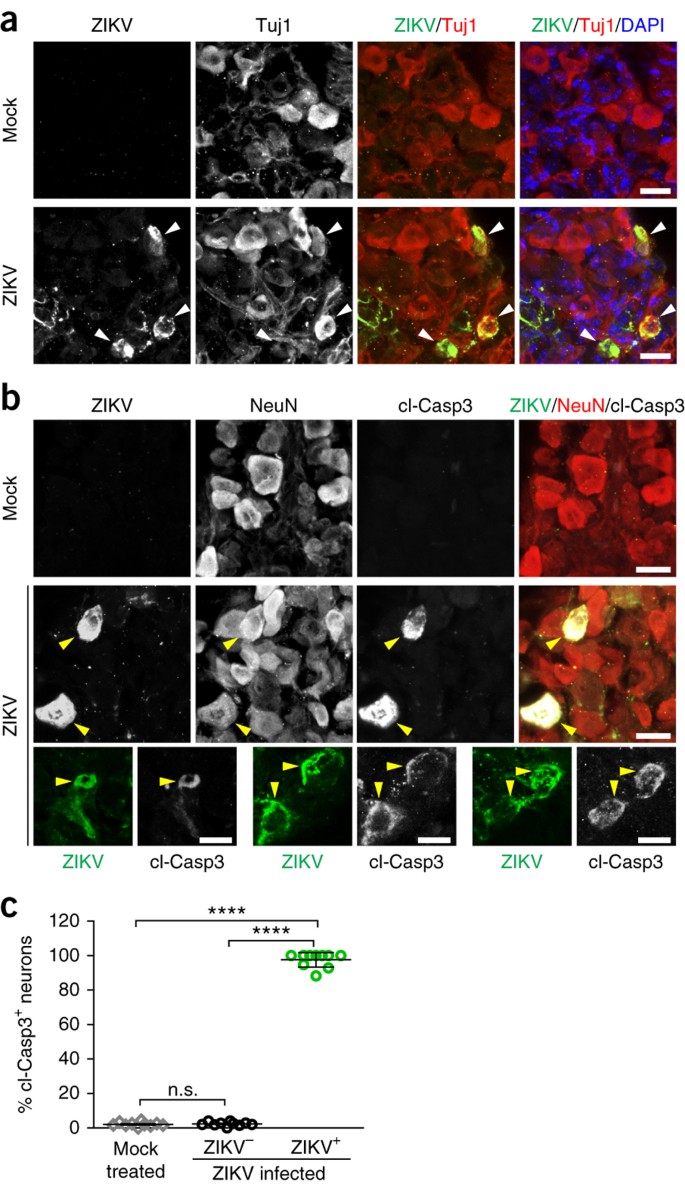
Mouse embryos were infected by intraventricular injection of 650 plaque-forming units of ZIKVSZ01 or mock injection at E13.5 and analyzed at P1. (a) Representative images of mouse DRG sections stained with the indicated antibodies. White arrowheads, ZIKV-infected DRG neurons. (b) Sample images of DRG sections stained with the indicated antibodies. Cleaved caspase 3, cl-Casp3. Yellow arrowheads, ZIKV-infected apoptotic DRG neurons. Scale bars, 20 μm (a,b). (c) The percentage of apoptotic neurons in the mock-treated and ZIKV-infected DRGs. Error bars represent mean ± s.e.m. ****P < 0.0001; n.s., not significant; unpaired Student's _t_-test; n = 10 DRGs from 4 pups for each group.
These in vivo observations prompted us to use a human stem-cell-based model to directly examine ZIKV infection and its molecular pathology. Neural crest cells are migratory multipotent progenitors that give rise to various cell types, including neurons and glia of the PNS13. We previously developed an efficient protocol14 to differentiate human pluripotent stem cells (hPSCs) into human neural crest cells (hNCCs), which can be further differentiated into human peripheral neurons (hPNs) (Supplementary Fig. 2). We used a clinically isolated ZIKV strain from the 2015 Puerto Rico Zika outbreak, PRVABC59 (hereafter ZIKVPR), which is closely related to epidemic strains circulating in the Americas that have been linked to in utero ZIKV infection15. We performed infections at a low or moderate multiplicity of infection (MOI; 0.04 or 0.4) for 2 h. Infection rates were quantified 65 h later with immunocytochemistry using an anti-ZIKV envelope protein (ZIKVE) antibody. hNCCs expressing neural crest markers were readily infected by ZIKVPR (Fig. 2a,b). As in previous CNS model systems for ZIKV infection3,16, the staining signal for ZIKVE was concentrated in the perinuclear structures of hNCCs (Fig. 2a), and ZIKVPR infection reduced the cell viability of hNCCs compared to mock-infected cells (Fig. 2c and Supplementary Fig. 3a). These results are in accordance with a recent publication demonstrating that ZIKV infects cranial NCCs, resulting in reduced viability17.
Figure 2: ZIKV efficiently infects human pluripotent stem cell–derived neural crest cells.
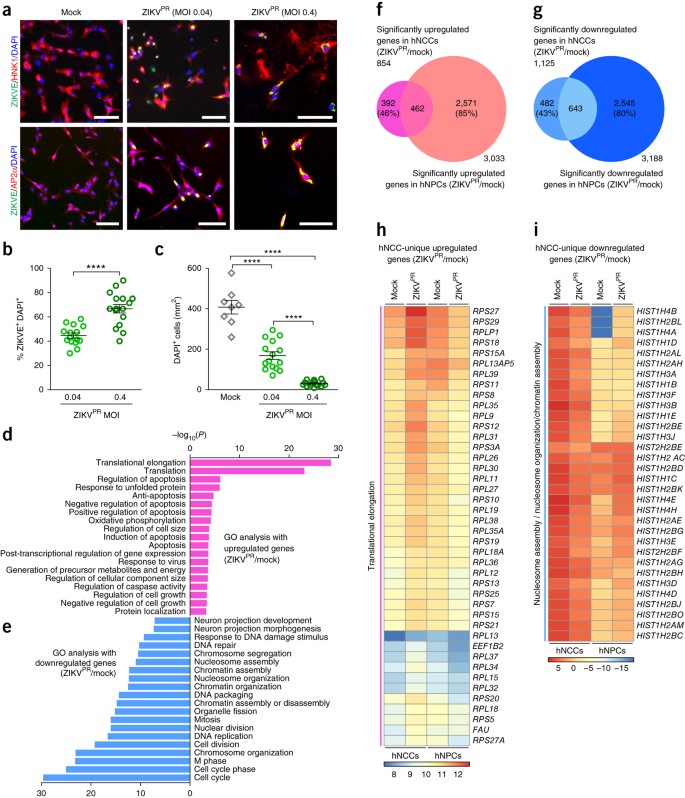
hNCCs were treated with ZIKVPR (MOI of 0.04 or 0.4) or mock-treated for 65 h. (a) Representative images of hNCCs immunostained with the indicated antibodies. Scale bars, 100 μm. (b) Quantification of the percentage of ZIKVE+ hNCCs, relative to the number of DAPI+ cells (n = 15 cultures for MOI of 0.04, n = 16 for MOI of 0.4; ****P < 0.0001; unpaired Student's _t_-test). (c) The number of DAPI+ hNCCs per mm2 (n = 8 cultures for mock, n = 15 for MOI of 0.04, n = 16 for MOI of 0.4; ****P < 0.0001; unpaired Student's _t_-test). All error bars represent mean ± s.e.m. (d,e) Genes with significant differential expression between infected and uninfected hNCCs were subjected to GO analyses. (d) All significant terms for upregulated genes. (e) Top 20 most significant terms for downregulated genes. (f,g) Weighted Venn diagrams between ZIKVPR-infected hNCCs and CNS hNPCs, showing overlap of (f) significantly upregulated genes or (g) significantly downregulated genes. (h,i) Heat maps showing expression levels, in log2(fragments per kilobase of transcript per million mapped reads), of specific genes in mock-infected and ZIKVPR-infected hNCCs and hNPCs.
To investigate the impact of ZIKVPR infection on hNCCs at the molecular level, we employed global transcriptome analyses (RNA-seq). Our genome-wide analyses identified a large number of genes differentially expressed upon viral infection (Supplementary Fig. 4a,b and Supplementary Table 1). Gene ontology (GO) analyses of ZIKVPR-infected hNCCs revealed a particular enrichment of upregulated genes in apoptotic, cell-death-related terms, which was more pronounced than in infected CNS human neural progenitor cells (hNPCs)3,16, and enrichment in translation-related terms (Fig. 2d). The downregulated genes were enriched in cell-cycle-related terms (Fig. 2e), which is consistent with our previous findings in CNS hNPCs3,16. Transcriptome-wide comparison of gene expression to ZIKVPR-infected CNS hNPCs revealed some similarities and differences (Fig. 2f–i, Supplementary Fig. 5 and Supplementary Table 2). Between ZIKVPR-infected hNCCs and CNS hNPCs, a number of genes were up- and downregulated in common (462 and 643 genes, respectively), but there were still many genes that were differentially expressed (874 genes in hNCCs and 5,116 genes in CNS hNPCs; Fig. 2f,g and Supplementary Fig. 5). Further GO analyses showed that genes in the term “translational elongation” were uniquely upregulated in ZIKVPR-infected hNCCs (false discovery rate (FDR) = 8.4 × 10−39; Fig. 2h and Supplementary Fig. 5b) and genes in the term “nucleosome organization” were uniquely downregulated in ZIKVPR-infected hNCCs compared to CNS hNPCs (FDR = 3.9 × 10⁻⁸; Fig. 2i and Supplementary Fig. 5b). This suggests that molecular pathology in ZIKVPR-infected hNCCs is distinct from that in CNS hNPCs.
Several recent studies have shown that in the CNS ZIKV targets NPCs, with little direct infection of neurons, both in culture and in vivo3,4,5,18,19,20. In contrast, ZIKVPR readily infected hPNs expressing the neuronal markers peripherin (PRPH) and TUJ1 (Fig. 3a,b). ZIKVE was concentrated in perinuclear structures of the hPSC-derived hPNs (Fig. 3a), in accordance with a recent report that infectious ZIKV particles are located in the disrupted endoplasmic reticulum of CNS neurons in the human fetal brain1. ZIKVPR infection in hPNs led to reduced cell numbers compared to those in mock-infected cells (Fig. 3c and Supplementary Fig. 3b). Mechanistically, ZIKVPR infection increased CASP3 activation in hNCCs and hPNs 65 h after infection, as compared to mock infection, suggesting increased cell death (Supplementary Fig. 3c–f). Genome-wide transcription analyses of ZIKVPR-infected hPNs identified many differentially expressed genes upon viral infection (Supplementary Fig. 4c,d and Supplementary Table 3). GO analyses of ZIKVPR-infected hPNs revealed that differential gene expression patterns were similar to that of ZIKVPR-infected hNCCs (Figs. 2d,e and 3d,e), mainly associated with apoptotic cell death and cell cycle. In ZIKVPR-infected hPNs and hNCCs, large numbers of transcripts were differentially expressed (1,983 genes in hPNs and 945 genes in hNCCs), while a subset of these genes were up- and downregulated in common (419 and 615 genes, respectively; Supplementary Figs. 6 and 7). Further GO analyses with the list of differentially expressed genes unique to ZIKVPR-infected hPNs showed several enriched terms for downregulated genes, including “regulation of cell development” and “regulation of neurogenesis” (Supplementary Figs. 6g and 7a), suggesting that ZIKVPR causes substantial developmental and cellular changes in hPNs. In particular, ZIKVPR disrupted “WNT signaling pathway” genes in infected hPNs (Supplementary Fig. 7b), highlighting marked molecular perturbations upon ZIKVPR infection.
Figure 3: Effective ZIKV infection in human peripheral neurons causes substantial cell death and pathogenic transcriptional dysregulation.
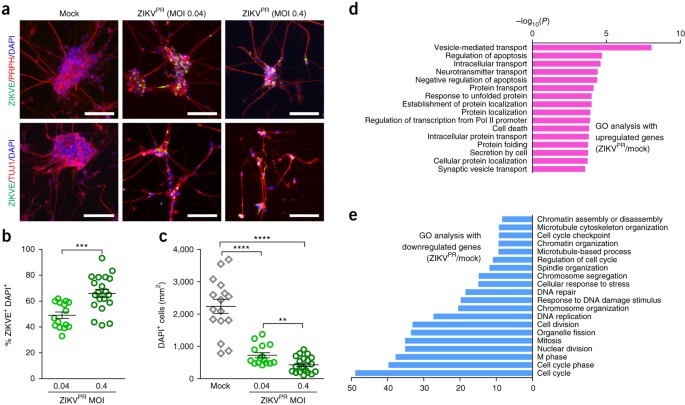
hPNs were treated with ZIKVPR (MOI of 0.04 or 0.4) or mock-treated for 65 h. (a) Representative images of hPNs immunostained with the indicated antibodies. Scale bars, 100 μm. (b) Quantification of the percentage of ZIKVE+ hPNs, relative to the number of DAPI+ cells (n = 15 cultures for MOI of 0.04, n = 20 for MOI of 0.4; ***P < 0.001; unpaired Student's _t_-test). (c) The number of DAPI+ hPNs per mm2 (n = 16 cultures for mock, n = 15 for MOI of 0.04, n = 20 for MOI of 0.4; **P < 0.01; ****P < 0.0001; unpaired Student's _t_-test). All error bars represent mean ± s.e.m. (d,e) Genes with significant differential expression between infected and uninfected hPNs were subjected to GO analyses. (d) All significant terms for upregulated genes. (e) Top 20 most significant terms for downregulated genes.
To verify our RNA-seq results, we focused on genes associated with apoptosis and epigenetic regulation, using quantitative real-time reverse transcription PCR (qRT-PCR), western blotting and immunocytochemical analyses (Supplementary Fig. 8). We confirmed that the expression and phosphorylation levels of c-Jun were increased only in ZIKVPR-infected hPNs (Supplementary Fig. 8c,e,f,i,j), suggesting that c-Jun phosphorylation-associated apoptosis is one of the possible cell death pathways in ZIKVPR-infected hPNs (Supplementary Fig. 9). We also confirmed that the expression and acetylation levels of histone H3 were decreased only in ZIKVPR-infected hNCCs (Supplementary Fig. 8d,g,h), indicating that dysregulation of histone protein expression and acetylation may be associated with cell death of ZIKVPR-infected hNCCs (Supplementary Fig. 9). Overall, our unbiased global transcriptome data sets not only support our findings of massive cell death in infected hNCCs and hPNs, but also provide a resource to the field for cell-type-specific molecular pathology caused by ZIKVPR.
While it has been established that ZIKV can cause neural developmental defects during brain development6, whether ZIKV can efficiently infect hPNs was not previously known. Here we demonstrated that either intraperitoneal injection or fetal mouse brain injection of ZIKV led to infection of the PNS. Both human stem-cell-derived hNCCs and hPNs were permissive to ZIKV infection, presenting far more cell death than CNS cells. In addition, we found ZIKV infection in human stem-cell-derived Schwann cells, but not in skeletal muscle cells (Supplementary Fig. 10), which suggests a tissue-specific vulnerability to ZIKV infection. Our results are also supported by recent human case studies and a primate model study that showed PNS ZIKV pathology10,11,12. We were also able to detect high levels of ZIKV in mouse spinal cord after intraventricular injection and secretion of infectious ZIKV particles from infected hNCCs and hPNs in culture (Supplementary Fig. 11). It remains to be determined how ZIKV can be transmitted from the abdominal cavity or the brain to PNS regions. Potential routes include bloodstream, cerebrospinal fluid and interneuronal transmission. It is also important to elucidate how PNS ZIKV infection is relevant to peripheral neuropathies.
In summary, our study provides an efficient humanized model to study ZIKV infection in the PNS, showing similarities and differences in the molecular pathophysiology of ZIKV in the PNS compared to the developing CNS. Our study opens new avenues for further investigating cellular and molecular mechanisms, and our humanized peripheral neuron model can facilitate the discovery and validation of therapeutic agents for ZIKV-related PNS symptoms.
Methods
ZIKV preparation and animal infection.
The Asian lineage ZIKV SZ01 strain (GenBank accession code KU866423) was isolated from a patient who had returned to China from Samoa and was amplified in C6/36 cells21. The ZIKV replicated efficiently in C6/36 cells and the viral growth curve was determined by qRT-PCR assay. Type-I interferon receptor–deficient (A129) mice were used to generate a ZIKV intraperitoneal infection model. Around 5 × 10⁵ plaque-forming units (PFU) of ZIKV SZ01 or culture medium was injected intraperitoneally into 5-week-old A129 mice, which were inspected 3 d later. To generate the microcephaly mouse model, we anesthetized pregnant ICR mice at embryonic day 13.5 (E13.5), exposed the uterine horns and injected 1 μL of ZIKV SZ01 (6.5 × 10⁵ PFU/mL) or culture medium (RPMI medium 1640 basic + 2% FBS) into the lateral ventricles of embryos using a calibrated micropipette, as described previously5. For each pregnant dam, two-thirds of the embryos received ZIKV infection while the rest were injected with culture medium to provide littermate controls. After virus injection, the embryos were placed back into the abdominal cavity of dams and wound was closed. Tissue was collected and analyzed at P1. All experimental procedures were performed in accordance with protocols approved by the Institutional Animal Care and Use Committee at Beijing Institute of Microbiology and Epidemiology and conducted in a biological safety protection laboratory. The experimenters were blinded to treatment. None of the viable animals were excluded from our analyses.
Immunohistochemistry.
The trunk tissues with dorsal root ganglion (DRG) and spinal cord from the infected pups and their littermate controls were collected at P1. The tissues were fixed in 4% paraformaldehyde overnight, dehydrated with 20% sucrose in PBS and embedded in OCT compound for cryostat sectioning. The sections with DRG and spinal cord were immunostained with human convalescent serum from ZIKV-infected patients5 and commercial primary antibodies (Supplementary Table 4). For measuring the percentage of apoptotic DRG neurons labeled by cl-Casp3, we counted 10 tissue slices (30 μm/slice) from 4 pairs of animals under fluorescence microscopy. We did not dissect the DRG out of trunk tissues from P1 mice but directly sectioned the trunk tissue containing spinal cord and DRG. We obtained around 10 slices containing DRG tissues from among more than 30 slices for each group and counted the infected and apoptotic neurons for quantification. Some slices contain more than 150 DRG neurons but others had less than 50 DRG. We counted all slices with DRG neurons. Preparations of enteric ganglia were generated by peeling off the small intestinal villus layer from a freshly dissected segment of the jejunum. The stretched surface along with the attached myenteric plexus were fixed overnight in 4% PFA in PBS. The wholemounts were used for immunofluorescence staining. The experimenters were blinded to treatment. None of the viable animals were excluded from our analyses. We also did not exclude any data points from quantification.
hPSC culture and PNS differentiation.
Undifferentiated H9 hESCs (passages 40–50) were cultured on mitotically inactivated mouse embryonic fibroblasts (MEFs, Applied Stem Cell) in hESC medium, consisting of DMEM/F12, 20% knockout serum replacement (KSR), 0.1 mM MEM-NEAA, 2 mM L-glutamine, 55 μM β-mercaptoethanol (Life Technologies) and 10 ng/mL FGF2 (R&D Systems). All cells were maintained at 37 °C and 5% CO2 in a humidified incubator. For neural differentiation, hESCs were plated at 5–20 × 103 cells on a confluent layer of irradiated (50 Gy) stromal cells (MS-5) in 60-mm cell culture plates in a medium containing DMEM/F12, 20% KSR, 0.1 mM MEM-NEAA, 2 mM L-glutamine and 55 μM β-mercaptoethanol (KSR medium) as described previously14,22,23. After 16 d in KSR medium, cultures were switched to N2 medium14,22,23,24. Medium was changed every 2 d, and growth factors were added as described previously14,22,23,24. Briefly, differentiation was initiated by adding 100 nM LDN193189 (Abcam) and 10 μM SB431542 (Cayman Chemical) in KSR medium. Other small-molecule compounds used in neural induction and differentiation were as follows: 0.2 mM ascorbic acid, 0.2 mM dibutyryl cyclic AMP (Sigma-Aldrich) and 1 μM purmorphamine (PMP, Cayman Chemical). Recombinant growth factors were as follows: 50 ng/ml sonic hedgehog (Shh), 100 ng/ml FGF8 (R&D Systems) and 10 ng/ml BDNF (PeproTech). Rosette structures were harvested mechanically at day 22–28 of differentiation (termed passage 0; P0) and gently replated on 15 μg/ml polyornithine/1 μg/ml laminin/10 ng/ml fibronectin (PO/Lam/FN)-coated culture dishes in N2 medium (termed passage 1; P1). P1 cultures were supplemented with ascorbic acid, PMP, Shh, FGF8 and BDNF. After 6–7 d of P1 culture, cells were mechanically triturated after exposure to Ca2+/Mg2+-free Hanks' balanced salt solution (CMF-HBSS, 20 min at 25 °C) and labeled with antibodies for flow cytometry (Supplementary Table 4). FACS sorting (p75+ HNK1+) was performed on a MoFlo (Dako). Sorted cells were plated on culture dishes precoated with PO/Lam/FN (10–30 × 103 cells/cm2). hPSC-derived hNCCs were maintained in hNCC medium, consisting of Neurobasal medium supplemented with 2 mM L-glutamine, B-27, N-2 supplements (Life Technologies), 20 ng/ml FGF2 and 20 ng/ml EGF (R&D Systems). For directed differentiation of hPSC-derived NCCs toward hPNs, FGF2/EGF-expanded hNCCs were differentiated for at least for 2 weeks with hPN medium, consisting of Neurobasal medium supplemented with 2 mM L-glutamine, B-27, N-2 supplements, 0.2 mM ascorbic acid, 0.2 mM dibutyryl cyclic AMP, 10 ng/mL BDNF, 10 ng/mL NGF (PeproTech) and 10 ng/mL GDNF (R&D Systems)23. For directed differentiation of hPSC-derived NCCs toward Schwann cells, we followed a previously described protocol14,22. Myogenic differentiation and myotube formation followed a previously described protocol25.
hPSC culture and CNS hNPC differentiation.
Human iPSC lines have been fully characterized26 and were passaged on MEF feeder layers. All studies followed institutional IRB and ISCRO guidelines and protocols approved by Johns Hopkins University School of Medicine. Human iPSCs were differentiated into forebrain-specific hNPCs and immature neurons following a previously established protocol26. Briefly, hiPSCs colonies were detached from the feeder layer with 1 mg/mL collagenase treatment for 1 h and suspended in embryonic body (EB) medium, consisting of FGF2-free iPSC medium supplemented with 2 μM dorsomorphin and 2 μM A-83, in untreated polystyrene plates for 4 d with daily medium changes. After 4 d, EB medium was replaced by neural induction medium (hNPC medium), consisting of DMEM/F12, N2 supplement, NEAA, 2 μg/mL heparin and 2 μM cyclopamine. The floating EBs were then transferred to Matrigel-coated six-well plates at day 7 to form neural-tube-like rosettes. The attached rosettes were kept for 15 d with hNPC medium changed every other day. On day 22, the rosettes were picked mechanically and transferred to low-attachment plates (Corning) to form neurospheres in hNPC medium containing B27. The neurospheres were then dissociated with Accutase at 37 °C for 10 min and placed onto Matrigel-coated six-well plates at day 24 to form monolayer hNPCs in hNPC medium containing B27. These hNPCs expressed forebrain-specific progenitor markers, including NESTIN, PAX6, EMX-1, FOXG1 and OTX2 (ref. 26).
Preparation of ZIKVPR and cell infection.
The ZIKV PRVABC59 strain (ZIKVPR) was obtained from ATCC (Manassas, VA) and subsequently amplified in Aedes albopictus clone C6/36 cells (ATCC). Briefly, C6/36 cells were inoculated with viral inoculum for 1 h at 28 °C in a low volume of medium (3 mL per T-75 flask), with rocking every 15 min, before the addition of an additional 17 mL medium. Virus-inoculated cells were then incubated at 28 °C for 6–7 d before harvesting the supernatant. C6/36-amplified ZIKVPR titer was determined by infecting Vero cells for 48 h with a methylcellulose overlay and analyzed for focus-forming units (FFU) per mL. In mock infections, an equal volume of spent uninfected C6/36 culture medium was used. hPSC-derived hNCCs were seeded at a density of 50 cells/mm2 and maintained for 2–4 d before ZIKV infection. hNCC-derived hPNs were seeded at a density of 1,700 cells/mm2 and matured for 2–3 weeks before ZIKV infection. Then these cells were infected with ZIKVPR at MOI of 0.04 or 0.4 and analyzed 65 h after infection after washing the cells three times with culture medium or PBS. The experimenter was not blinded to treatment. None of cell cultures were excluded from our analyses.
Immunocytochemistry.
Cells were fixed in 4% paraformaldehyde and stained with primary antibodies (Supplementary Table 4) after permeabilization with 0.1% Triton X-100/0.5% BSA/PBS solution. Appropriate Alexa Fluor 488- or 568-labeled secondary antibody (Life Technologies) and DAPI (Roche Applied Science) nuclear counter-staining were used for visualization. The stained samples were analyzed using fluorescence microscopy (Eclipse TE2000-E, Nikon). The numbers of ZIKVE+, Ki-67+ or DAPI+ cells per mm2 were counted under fluorescence microscopy. Cell viability 65 h after ZIKVPR infection was represented as percentage fold change (relative to mock) of DAPI+ cell number (per mm2) in ZIKVPR-infected cells (mean ± s.e.m.). The experimenter was not blinded to treatment. None of cell cultures were excluded from our analyses.
RNA isolation, RNA-seq library preparation and sequencing.
RNA-seq libraries were prepared from isolated total RNA and were sequenced as previously described16. Briefly, total cellular RNA was purified from cell pellets using TRIzol reagent (Life Technologies) according to the manufacturer's instructions. RNA-seq libraries were generated from 1 μg of total RNA from duplicated or triplicated samples (2 or 3 cell cultures) per condition using the TruSeq LT RNA Library Preparation Kit v2 (Illumina) following the manufacturer's protocol. An Agilent 2100 BioAnalyzer and DNA1000 kit (Agilent) were used to quantify amplified cDNA and to control the quality of the libraries. An Illumina HiSeq2500 or HiSeq3000 was used to perform 100- or 50-cycle single-read sequencing. Image processing and sequence extraction were performed using the standard cloud-based Illumina pipeline in BaseSpace. The experimenter was blinded to treatment.
Bioinformatic analyses.
Single-end RNA-seq reads were first aligned to human transcriptome annotations and genome assembly (hg19) using TopHat27 v2.0.13. The numbers of mapped reads for each condition can be found in Supplementary Tables 1 and 3. FPKM (fragments per kilobase of transcript per million mapped reads) values were calculated by Cufflinks28 v2.2.1. Pairwise comparisons between infected and mock conditions were performed to detect differentially expressed (DE) genes using Cuffdiff28 v2.2.1. In hPNs and hNCCs, DE genes are defined as ones with q less than 0.05; and in CNS hNPCs, DE genes are defined as ones with q less than 0.05 and absolute log2 fold change of expression no less than 0.57 (the same significance cut-off used by Cuffdiff for the RNA-seq data of hNCCs). Gene ontology (GO) analyses on biological processes were performed by the Database for Annotation, Visualization and Integrated Discovery (DAVID)29 v6.7. To identify significantly enriched GO terms, a Benjamini–Hochberg procedure was used to control the false discovery rate (FDR) at 0.05. Pathway enrichment analyses and disease-related gene enrichment analyses were performed by the web-based Gene SeT AnaLysis Toolkit (WebGestalt)30 update 2015 with adjusted P no greater than 0.05. The experimenter was blinded to treatment.
qRT-PCR.
Total RNA was extracted by using the TRIzol Reagent and reverse transcribed by using High Capacity cDNA Reverse Transcription Kit (Applied Biosystems). qRT-PCR mixtures were prepared with KAPA SYBR FAST qPCR Kit Master Mix (Kapa Biosystems) and reactions were done with the Mastercycler ep Realplex2 (Eppendorf). Each transcript level was assessed by qRT-PCR normalized to GAPDH expression. Primers for qRT-PCR are listed in Supplementary Table 5. The experimenter was not blinded to treatment. None of cell cultures were excluded from our analyses.
Western blot analyses.
Cells were lysed in RIPA buffer (Cell Signaling Technology) and supplemented with 1% SDS, 10% glycerol and 1 mM PMSF. After sonicating to reduce the viscosity, cell lysates were mixed with Benzonase (Sigma-Aldrich) and incubated for 15 min at 37 °C. The samples were clarified by centrifugation at 15,000_g_ for 30 min at 14 °C, boiled at 98 °C for 2 min in Laemmli sample buffer (Sigma-Aldrich) supplemented with 20 mM DTT, resolved by SDS-PAGE and transferred to nitrocellulose membranes (Bio-Rad). Western blot analyses were performed with the indicated antibodies (Supplementary Table 4). The bands were quantified by densitometry using ImageJ (NIH). The experimenter was not blinded to treatment. Uncropped blots are shown in Supplementary Figure 12.
Viral titer by focus forming assay.
Cells were infected with ZIKVPR at MOI of 0.04 for 65 h before harvesting the supernatant. Human cell amplified ZIKVPR titer was determined by infecting Vero cells for 48 h with a methylcellulose overlay and analyzed for FFUs per mL as previously described31. The experimenter was not blinded to treatment.
Statistical analysis.
All data were tested for normal distribution. Values are from at least three independent experiments with multiple biological replicates each and reported as mean ± s.e.m. Differences between two samples were analyzed for significance using the unpaired two-tailed Student's _t_-test in Prism (GraphPad). No statistical methods were used to predetermine sample sizes, but our sample sizes are similar to those reported in previous publications3,5,16,18,22,23,26,31. Experimenters using in vivo samples were always blinded to treatment. No special randomization procedures were used for assigning groups.
A Life Sciences Reporting Summary is available.
Code availability.
TopHat27 v2.0.13 and Cuffdiff28 v2.2.1, used for data analysis, are freely available at https://ccb.jhu.edu/software/tophat/index.shtml and http://cole-trapnell-lab.github.io/cufflinks/cuffdiff/. R packages ggplot2 and pheatmap used for data visualization are freely available at http://ggplot2.org/ and the Comprehensive R Archive Network (CRAN).
Data availability.
The RNA-seq data reported in this paper has been deposited in GEO, GSE87750. The remaining data that support the findings of this study are available from the corresponding authors upon reasonable request.
Additional information
Publisher's note: Springer Nature remains neutral with regard to jurisdictional claims in published maps and institutional affiliations.
Accession codes
Accessions
NCBI Reference Sequence
References
- Mlakar, J. et al. N. Engl. J. Med. 374, 951–958 (2016).
Article CAS Google Scholar - Rasmussen, S.A., Jamieson, D.J., Honein, M.A. & Petersen, L.R. N. Engl. J. Med. 374, 1981–1987 (2016).
Article CAS Google Scholar - Tang, H. et al. Cell Stem Cell 18, 587–590 (2016).
Article CAS Google Scholar - Cugola, F.R. et al. Nature 534, 267–271 (2016).
Article CAS Google Scholar - Li, C. et al. Cell Stem Cell 19, 120–126 (2016).
Article CAS Google Scholar - Ming, G.L., Tang, H. & Song, H. Cell Stem Cell 19, 690–702 (2016).
Article CAS Google Scholar - Li, H., Saucedo-Cuevas, L., Shresta, S. & Gleeson, J.G. Neuron 92, 949–958 (2016).
Article CAS Google Scholar - Wen, Z., Song, H. & Ming, G.L. Genes Dev. 31, 849–861 (2017).
Article CAS Google Scholar - Brasil, P. et al. PLoS Negl. Trop. Dis. 10, e0004636 (2016).
Article Google Scholar - Medina, M.T. et al. J. Neurol. Sci. 369, 271–272 (2016).
Article Google Scholar - Cleto, T.L., de Araújo, L.F., Capuano, K.G., Rego Ramos, A. & Prata-Barbosa, A. Pediatr. Neurol. 65, e1–e2 (2016).
Article Google Scholar - Hirsch, A.J. et al. PLoS Pathog. 13, e1006219 (2017).
Article Google Scholar - Fuchs, S. & Sommer, L. Neurodegener. Dis. 4, 6–12 (2007).
Article Google Scholar - Lee, G., Chambers, S.M., Tomishima, M.J. & Studer, L. Nat. Protoc. 5, 688–701 (2010).
Article CAS Google Scholar - Faria, N.R. et al. Science 352, 345–349 (2016).
Article CAS Google Scholar - Zhang, F. et al. Nucleic Acids Res. 44, 8610–8620 (2016).
Article CAS Google Scholar - Bayless, N.L., Greenberg, R.S., Swigut, T., Wysocka, J. & Blish, C.A. Cell Host Microbe 20, 423–428 (2016).
Article CAS Google Scholar - Qian, X. et al. Cell 165, 1238–1254 (2016).
Article CAS Google Scholar - Li, H. et al. Cell Stem Cell 19, 593–598 (2016).
Article CAS Google Scholar - Onorati, M. et al. Cell Rep. 16, 2576–2592 (2016).
Article CAS Google Scholar - Deng, Y.Q. et al. Sci. China Life Sci. 59, 428–430 (2016).
Article Google Scholar - Lee, G. et al. Nat. Biotechnol. 25, 1468–1475 (2007).
Article CAS Google Scholar - Oh, Y. et al. Cell Stem Cell 19, 95–106 (2016).
Article CAS Google Scholar - Perrier, A.L. et al. Proc. Natl. Acad. Sci. USA 101, 12543–12548 (2004).
Article CAS Google Scholar - Choi, I.Y. et al. Cell Rep. 15, 2301–2312 (2016).
Article CAS Google Scholar - Wen, Z. et al. Nature 515, 414–418 (2014).
Article CAS Google Scholar - Kim, D. et al. Genome Biol. 14, R36 (2013).
Article Google Scholar - Trapnell, C. et al. Nat. Biotechnol. 31, 46–53 (2013).
Article CAS Google Scholar - Huang, W., Sherman, B.T. & Lempicki, R.A. Nat. Protoc. 4, 44–57 (2009).
Article CAS Google Scholar - Wang, J., Duncan, D., Shi, Z. & Zhang, B. Nucleic Acids Res. 41, W77–W83 (2013).
Article Google Scholar - Xu, M. et al. Nat. Med. 22, 1101–1107 (2016).
Article CAS Google Scholar
Acknowledgements
We thank K.M. Christian for comments. We acknowledge the services of H. Zhang at Flow Cytometry Core Facility (JHSPH), W. Tang at Omega Bioservices (Omega Bio-tek, Inc.), and M. Zwick and B. Isett at the Emory Integrated Genomics Core (EIGC). This work was supported by grants from the Robertson Investigator Award from New York Stem Cell Foundation (G.L.), Maryland Stem Cell Research Funding (MSCRF; G.L., H.S. and G.-l.M.), NIH R01NS093213 (G.L.), R01MH105128 and R35NS097370 (G.-l.M.), U19AI131130 (G.-l.M., Z.W., H.T. and P.J.), U19MH106434, P01NS097206 and R37NS047344 (H.S.), R21AI119530 (H.T.), National Natural Science Foundation of China (31430037), Innovation Program of the Chinese Academy of Sciences (QYZDJ-SSW-SMC007), Shanghai Brain-Intelligence Project from STCSM (16JC1420500), Beijing Brain Project (Z161100002616004) to Z.X. and Y.W., FSU Zika seed funding (H.T.), and the Adelson Medical Research Foundation (G.-l.M.). The authors (G.L., Y.O., G.-l.M. and H.S.) acknowledge the joint participation of the Adrienne Helis Malvin Medical Research Foundation.
Author information
Author notes
- Hengli Tang, Zhiheng Xu, Peng Jin, Hongjun Song, Guo-li Ming and Gabsang Lee: These authors jointly directed this work.
Authors and Affiliations
- Institute for Cell Engineering, Johns Hopkins University School of Medicine, Baltimore, Maryland, USA
Yohan Oh, In Young Choi, Hotae Lim, Fahimeh Mirakhori, Zhexing Wen, Hongjun Song, Guo-li Ming & Gabsang Lee - Adrienne Helis Malvin Medical Research Foundation, New Orleans, Louisiana, USA
Yohan Oh, Hongjun Song, Guo-li Ming & Gabsang Lee - Department of Human Genetics, Emory University School of Medicine, Atlanta, Georgia, USA
Feiran Zhang, Ronghua Li, Luoxiu Huang & Peng Jin - State Key Laboratory of Molecular Developmental Biology, CAS Center for Excellence in Brain Science and Intelligence Technology, Institute of Genetics and Developmental Biology, Chinese Academy of Sciences, Beijing, China
Yaqing Wang, Cui Li, Qing-Feng Wu & Zhiheng Xu - Department of Biological Science, Florida State University, Tallahassee, Florida, USA
Emily M Lee & Hengli Tang - Department of Mathematics and Computer Science, Emory University, Atlanta, Georgia, USA
Tianlei Xu - Department of Biostatistics and Bioinformatics, Emory University Rollins School of Public Health, Atlanta, Georgia, USA
Hao Wu - Department of Virology, State Key Laboratory of Pathogen and Biosecurity, Beijing Institute of Microbiology and Epidemiology, Beijing, China
Cheng-Feng Qin - Department of Neurology, Johns Hopkins University School of Medicine, Baltimore, Maryland, USA
Zhexing Wen, Hongjun Song, Guo-li Ming & Gabsang Lee - Departments of Psychiatry and Behavioral Sciences, Cell Biology and Neurology, Emory University School of Medicine, Atlanta, Georgia, USA
Zhexing Wen - Parkinson's Disease Center, Beijing Institute for Brain Disorders, Beijing, China
Zhiheng Xu - The Solomon H. Snyder Department of Neuroscience, Johns Hopkins University School of Medicine, Baltimore, Maryland, USA
Hongjun Song, Guo-li Ming & Gabsang Lee - Department of Neuroscience, and Mahoney Institute for Neurosciences, Perelman School for Medicine, University of Pennsylvania, Philadelphia, Pennsylvania, USA
Hongjun Song & Guo-li Ming - Institute for Regenerative Medicine, Perelman School for Medicine, University of Pennsylvania, Philadelphia, Pennsylvania, USA
Hongjun Song & Guo-li Ming - The Epigenetics Institute, Perelman School for Medicine, University of Pennsylvania, Philadelphia, Pennsylvania, USA
Hongjun Song - Department of Psychiatry and Behavioral Science, Johns Hopkins University School of Medicine, Baltimore, Maryland, USA
Guo-li Ming
Authors
- Yohan Oh
You can also search for this author inPubMed Google Scholar - Feiran Zhang
You can also search for this author inPubMed Google Scholar - Yaqing Wang
You can also search for this author inPubMed Google Scholar - Emily M Lee
You can also search for this author inPubMed Google Scholar - In Young Choi
You can also search for this author inPubMed Google Scholar - Hotae Lim
You can also search for this author inPubMed Google Scholar - Fahimeh Mirakhori
You can also search for this author inPubMed Google Scholar - Ronghua Li
You can also search for this author inPubMed Google Scholar - Luoxiu Huang
You can also search for this author inPubMed Google Scholar - Tianlei Xu
You can also search for this author inPubMed Google Scholar - Hao Wu
You can also search for this author inPubMed Google Scholar - Cui Li
You can also search for this author inPubMed Google Scholar - Cheng-Feng Qin
You can also search for this author inPubMed Google Scholar - Zhexing Wen
You can also search for this author inPubMed Google Scholar - Qing-Feng Wu
You can also search for this author inPubMed Google Scholar - Hengli Tang
You can also search for this author inPubMed Google Scholar - Zhiheng Xu
You can also search for this author inPubMed Google Scholar - Peng Jin
You can also search for this author inPubMed Google Scholar - Hongjun Song
You can also search for this author inPubMed Google Scholar - Guo-li Ming
You can also search for this author inPubMed Google Scholar - Gabsang Lee
You can also search for this author inPubMed Google Scholar
Contributions
Y.O.: conception and study design, performing experiments, data analysis, data assembly, interpretation of data and writing manuscript; F.Z., Y.W., E.M.L., Q.-F.W., I.Y.C., H.L., F.M., R.L., L.H., T.X., C.L., Z.W. and C.-F.Q.: performing experiments and/or data analysis; H.W., H.T., Z.X., P.J., H.S., G.-l.M. and G.L.: study design and data analysis; H.T., Z.X., P.J., H.S., G.-l.M. and G.L.: conception and study design, data analysis and interpretation, and writing manuscript.
Corresponding authors
Correspondence toHengli Tang, Zhiheng Xu, Peng Jin or Guo-li Ming.
Ethics declarations
Competing interests
The authors declare no competing financial interests.
Integrated supplementary information
Supplementary Figure 1 ZIKV infects mouse peripheral neurons in DRG and gut
(a,b) Either 5 × 10⁵ plaque-forming unit (PFU) of ZIKV SZ01 or culture medium (mock) was injected intraperitoneally into A129 mice, and the tissue was analyzed 3 days later. Isolated DRG (a) or intestinal tissues (b) were immunostained with ZIKV and Tuj1 antibodies. Bottom panels, high magnification of the area outlined by the white box. (c,d) Embryonic brains were injected with 650 PFU of ZIKV SZ01 or culture medium (mock) in the lateral ventricle at E13.5 and examined at P1. (c) Isolated intestinal tissues were immunostained with ZIKV and Tuj1 antibodies. The white arrowheads indicate the co-localization of ZIKV with Tuj1. (d) Spinal cord sections were immunostained with antibodies against ZIKV, NeuN, and cleaved Caspase 3 (cl-Casp3). Bottom panels, high magnification of the area outlined by the white box. ZIKV-infected apoptotic motor neurons co-labeled with cl-Casp3 are indicated by yellow arrowheads. Scale bars, 20 μm.
Supplementary Figure 2 Characterization of hPSC-derived hNCCs and hPNs
(a,b) Representative image of FACS isolation for hNCCs. For flow cytometric isolation, cells are sorted for expression of p75 and HNK1. Red box, p75+/HNK1+ double positive gate for hNCCs sorting. (c) Representative phase-contrast image and immunofluorescence images of hPNs differentiated from hPSC-derived hNCCs. Immunofluorescence analyses were performed using ISL1 (green), BRN3A (red or green), PRPH (red), and RUNX1 (green) antibodies. The majority of cells was ISL1/2+/BRN3A+/RUNX1+/PRPH+ sensory neurons. (d) Representative image of hPNs immunostained with Ki-67 (green) and PRPH (red) antibodies. Scale bars, 100 μm. (e) Quantification of the percentage of Ki-67+ hPNs, relative to the number of DAPI-stained cells (n = 7). The n represents the number of cell cultures. Error bars represent mean ± s.e.m.
Supplementary Figure 3 ZIKV infection reduces cell viability of hPSC-derived hNCCs and hPNs
(a,b) Representative DAPI-stained images of (a) hNCCs and (b) hPNs 65 h after PRVABC59 (ZIKVPR) exposure (multiplicity of infection (MOI) of 0.04 or 0.4) or mock infections. (c,d) Quantification of cleaved Caspase 3 (cl-CASP3) expression levels in (c) hNCCs and (d) hPNs 65 h after ZIKVPR (MOI of 0.04) or mock infections. ZIKVPR infection was confirmed by western blotting with ZIKVE antibody, and both ZIKVPR-infected (c) hNCCs and (d) hPNs show significantly increased levels of cl-CASP3 expression (*P < 0.05; **P < 0.01; unpaired Student’s _t_-test; n = 3). HSP90 served as a protein loading control. All error bars represent mean ± s.e.m. The number of cell cultures is indicated for each group (n). For uncropped western blots please see Supplementary Fig. 12. (e,f) Representative immunostaining images 65 h after ZIKVPR (MOI of 0.04) or mock infections show that both ZIKVPR-infected (e) hNCCs and (f) hPNs expressed distinct levels of cl-CASP3 immunoreactivity. ZIKVPR-infected apoptotic (e) hNCCs and (f) hPNs co-labeled with cl-CASP3 are indicated by white arrowheads. Scale bars, 100 μm.
Supplementary Figure 4 Scatter and volcano plots of global transcriptome analyses (RNA-seq)
Significantly upregulated and downregulated genes upon ZIKVPR infection (MOI of 0.04) are highlighted in red and blue, respectively. (a,c) Scatter plots of global transcriptome changes between mock and ZIKVPR-infected either (a) hNCCs or (c) hPNs. Log2 expression levels of genes from RNA-seq data are plotted. FPKM, fragments per kilobase of transcript per million mapped reads. (b,d) Volcano plots of global transcriptome changes between mock and ZIKVPR-infected either (b) hNCCs or (d) hPNs. The log2(fold change) of expression levels (ZIKVPR-infected vs mock) and -log10(_p_-value) of genes from RNA-seq data are plotted.
Supplementary Figure 5 Gene expression comparison between ZIKV-infected PNS and CNS neural progenitors
(a,b) Genes with significant differential expression between ZIKVPR-infected hNCCs (MOI of 0.04) and ZIKVPR infected hNPCs (MOI of 0.08) were subjected to gene ontology (GO) analyses. (a) All significant terms for commonly up-regulated genes and top 20 most significant terms for commonly down-regulated genes. (b) All significant terms for hNCC-unique up- or down-regulated genes. The -log10 _p_-values are indicated by bar plots. (c) A heatmap showing the expression levels (log2 FPKM) of specific genes in mock and ZIKVPR-infected hNCCs and hNPCs. Genes that were only significantly down-regulated in ZIKVPR-infected hNCCs and involved in “neuron projection development” are shown. FPKM, fragments per kilobase of transcript per million mapped reads.
Supplementary Figure 6 Gene expression comparison between ZIKV-infected hPNs and hNCCs
(a,b) Weighted Venn diagrams between ZIKVPR-infected hPNs and hNCCs, showing overlap of (a) significantly up-regulated genes or (b) significantly down-regulated genes, identified by RNA-seq from ZIKVPR-infected hPNs and ZIKVPR-infected hNCCs, at 65 h post-infection. (c) Scatter plot of global differences in transcriptome changes between ZIKVPR-infected hPNs and hNCCs (MOI of 0.04). Log2 fold change of FPKM values from RNA-seq data are plotted. Regions with a higher density of genes are shown in warmer colors. (d) Scatter plot of global differences in transcriptome changes between ZIKVPR-infected hPNs and hNCCs. Log2 fold change of FPKM values from RNA-seq data are plotted. Genes that are involved in “cell cycle”, and were only significantly downregulated in ZIKVPR-infected hPNs or ZIKVPR-infected hNCCs are highlighted in blue or red, respectively. The commonly downregulated “cell cycle”-related genes are highlighted in green. Like the cranial NCC study16, ZIKV infection also significantly increased LIF (2.26-fold; P = 0.0104) and VEGFA expressions (1.98-fold; P = 0.00005) in hNCCs and VEGFA (3.34-fold; P = 0.00005) and VEGFB expressions (1.78-fold; P = 0.00595) in hPNs (please refer Supplementary Table 1 and 3). (e-g) Genes with differential expression between ZIKVPR-infected hPNs and hNCCs were subjected to GO analyses. (e) All significant terms for commonly up-regulated genes and the top 20 most significant terms for commonly down-regulated genes. (f) All significant terms for hNCC-unique up-regulated genes and the top 20 most significant terms for hNCC-unique down-regulated genes. (g) All significant terms for hPN-unique down-regulated genes. The -log10 _p_-values are indicated by bar plots.
Supplementary Figure 7 Gene expression comparison of ZIKV-infected neural cells
Heatmaps showing the expression levels (log2 FPKM) of specific genes in mock and ZIKVPR-infected (a,b,d-f) hPNs, hNCC or (c) hPNs, hNCC, and CNS human neural progenitor cells (hNPCs). FPKM, fragments per kilobase of transcript per million mapped reads. (a) Genes that were significantly down-regulated only in ZIKVPR-infected hPNs and involved in “regulation of cell development” and “regulation of neurogenesis” are shown. (b) Genes that were only significantly up- or down-regulated in ZIKVPR-infected hPNs and involved in “WNT signaling pathway” are shown. (c) Genes that were commonly up-regulated and involved in “vesicle-mediated transport” and “Golgi organization” are shown. (d) Genes that were only significantly up-regulated in ZIKVPR-infected hNCCs and involved in “translational elongation” are shown. (e,f) Genes that were only significantly down-regulated in ZIKVPR-infected hNCCs and involved in (e) “nucleosome assembly/nucleosome organization/chromatin assembly” and (f) “neuron projection development” are shown.
Supplementary Figure 8 Validation of RNA-seq analyses of ZIKV-infected hPSC-derived hNCCs and hPNs
After 65 h of ZIKVPR exposure (MOI of 0.04) or mock infections, (a,b) commonly up/down-regulated genes (ZIKVPR/Mock), (c) hPN-unique up-regulated genes (ZIKVPR/Mock), and (d) hNCC-unique down-regulated genes (ZIKVPR/Mock) were validated using qRT-PCR analyses (*P < 0.05; **P < 0.01; ***P < 0.001; n.s., not significant; unpaired Student’s _t_-test; n = 3). All error bars represent mean ± s.e.m. The number of cell cultures is indicated for each group (n). (e,f) Data with hPN-unique upregulated gene was further confirmed with western blot experiments, showing that significantly increased levels of c-Jun and phosphorylated-c-Jun (p-c-Jun, Ser73) expression were found only in ZIKVPR-infected hPNs, but not in hNCCs (**P < 0.01; ***P < 0.001; ****P < 0.0001; n.s., not significant; unpaired Student’s _t_-test; n = 3). HSP90 served as a protein loading control. All error bars represent mean ± s.e.m. The number of cell cultures is indicated for each group (n). (g,h) An hNCC-unique down-regulated gene was further tested with western blot experiments, showing that significantly decreased levels of histone H3 and acetylated histone H3 were found only in ZIKVPR-infected hNCCs, but not in hPNs (***P < 0.001; ****P < 0.0001; n.s., not significant; unpaired Student’s _t_-test; n = 3). HSP90 was used as a protein loading control. All error bars represent mean ± s.e.m. The number of cell cultures is indicated for each group (n). For uncropped western blots please see Supplementary Fig. 12. (i,j) Representative immunostaining images indicate that only ZIKVPR-infected hPNs have a distinct immunoreactivity to c-Jun and p-c-Jun antibodies, but not ZIKVPR-infected hNCCs. Scale bars, 50 μm.
Supplementary Figure 9 A model for ZIKV-induced cell death in hNCCs and hPNs
p-c-Jun, phospho-c-Jun (Ser73). ac-H3, acetyl-Histone H3 (Lys9). cl-CASP3, cleaved (active) Caspase 3.
Supplementary Figure 10 ZIKV efficiently infects hPSC-derived Schwann cells, but not skeletal muscle cells
Representative images of (a) human Schwann cells and (b) skeletal muscle cells immunostained with ZIKV envelope protein (ZIKVE; green) and either GFAP (red) or MF20 (red) antibodies 65 h after ZIKVPR exposure (MOI of 0.04). Scale bars, 100 μm.
Supplementary Figure 11 ZIKV can replicate in hPSC-derived hNCCs and hPNs
In order to determine whether each cell type can support the full ZIKV lifecycle, the cells were infected with ZIKVPR (MOI of 0.04) or mock for 65 h before harvesting the supernatant. Cell-amplified ZIKV titer was determined by infecting Vero cells for 48 h with a methylcellulose overlay and analyzed for focus-forming units per mL (FFU/mL). Infectious virion production from ZIKVPR-infected hPSC-derived (a) hNCCs (****P < 0.0001; unpaired Student’s _t_-test; n = 3) or (b) hPNs (*P < 0.05; unpaired Student’s _t_-test; n = 3). The n represents the number of cell cultures. All error bars represent mean ± s.e.m.
Supplementary information
Supplementary Text and Figures
Supplementary Figures 1–12 and Supplementary Tables 4 and 5. (PDF 2380 kb)
Life Sciences Reporting Summary (PDF 86 kb)
Supplementary Table 1
A list of differentially expressed genes upon ZIKV infection in human pluripotent stem cell (hPSC)-derived neural crest cells (hNCCs). (XLSX 1930 kb)
Supplementary Table 2
A list of the global gene expression comparison between human neural crest cells (hNCCs) and neural progenitor cells (hNPCs), before and after ZIKV infection. (XLSX 2904 kb)
Supplementary Table 3
A list of differentially expressed genes upon ZIKV infection in human pluripotent stem cell (hPSC)-derived peripheral neurons (hPNs). (XLSX 1965 kb)
Rights and permissions
About this article
Cite this article
Oh, Y., Zhang, F., Wang, Y. et al. Zika virus directly infects peripheral neurons and induces cell death.Nat Neurosci 20, 1209–1212 (2017). https://doi.org/10.1038/nn.4612
- Received: 12 October 2016
- Accepted: 01 July 2017
- Published: 31 July 2017
- Issue Date: 01 September 2017
- DOI: https://doi.org/10.1038/nn.4612