Association of the gut microbiota mobilome with hospital location and birth weight in preterm infants (original) (raw)
Main
Preterm infants constitute a unique patient population completing their development in an extra-uterine environment influenced by a concommitantly developing microbiome. Further, this patient group largely acquires its initial microbiota from within the hospital environment. As preterm infants spend many months in the hospital, their health is dependent on different factors to which they are exposed, such as chemicals (1), parenteral feeding (2), and exposure to neonatal intensive care unit (NICU) microbial flora (1). In addition to this, very low birth weight (<1500 g) preterm infants are affected by feeding intolerance and minimal intestinal growth (3). These factors threaten the development of the commensal gut microbiota and are responsible for delay in the succession of the adult gut microbiota, which may enhance the risk for sepsis (4) and necrotizing enterocolitis (NEC) (5). Approximately 7% of very low birth weight infants develop NEC, with a mortality rate of 20–30% (2, 6). This multifactorial condition is based on premature birth, aberrant intestinal microbiota development, and enteral feeding (2).
Although differences in the bacterial taxa of the gastrointestinal tract during preterm development have been extensively studied, the gene pool linked to mobile genetic elements (MGEs) has not been investigated. Therefore, the aim of this work was to investigate the mobilome (collection of MGEs) of the gut microbiota in NEC-positive and NEC-negative preterm infants and their potential association with birth weight and hospital location.
The mobilome, in general, includes transposons, plasmids, and bacteriophages (7). Some of the major constituents of the gut mobilome are conjugative plasmids (8). Conjugative plasmids are self-replicating genetic elements that propagate in an infectious manner (8). They can harbor several accessory functional elements that help to maintain long-term stability in a microbial population (9). In addition, two conjugative plasmid groups having identical replication machinery are incompatible in the same bacterial cell; hence, plasmids are identified based on their incompatibility (9). To date, 27 incompatibility groups have been defined (10). However, the most prominent are the incompatibility group F (IncF) plasmids that are commonly found within the Enterobacteriaceae family (11). These plasmids have been detected in bacteria from several human and animal sources. IncF conjugative plasmids contain an assortment of other MGEs and virulence genes (12). Plasmid-mediated hospital-acquired infections have been previously reported, explaining the influence of conjugal transfer of virulence factors and inducement of bacterial biofilms (13, 14). Virulence traits associated with MGEs include bacterial toxins (15), secretion systems (16), and hemolysins (14). These properties can transform the characteristics of the host cell.
Integrons are accessory components of conjugative plasmids (17). They are genetic elements capable of integration and expression of genetic cassettes by an overall common promoter (17, 18). The integron consists of three main parts: an integrase (_int_1) gene that helps in the integration of specific gene cassettes; an attachment (_att_1) site into which the gene cassettes are integrated; and the common promoter (Pc) for expression of the gene cassettes (19).
In this study, we investigated the intestinal microbiome of very low birth weight preterm infants from three neonatal intensive care units. Amplicon sequencing was used to identify compositional signatures in the microbiota composition. Then, full metagenome deep sequencing was used for analyzing the phylogeny and genetic background of MGEs in selected samples. Finally, quantitative PCR was used to study the prevalence and quantity of plasmid signature sequences and their association with MGEs.
Methods
Workflow
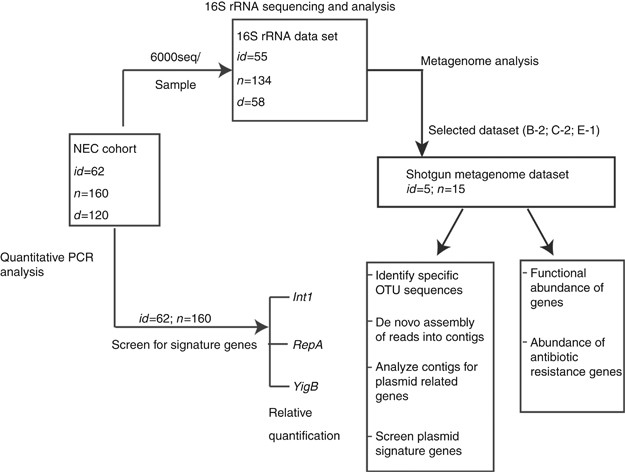
A workflow of the experimental design and the total number of samples used are shown in Figure 1.
Figure 1
Workflow of the experimental setup. B, Boston; C, Chicago; d, duplicate samples; E, Evanston; id, number of patients; n, number of samples included.
Cohort Description
Table 1 provides a summary of the cohort’s characteristics. The study consists of premature infants with and without NEC. All infants with NEC showed NEC symptoms that were more severe than Bell’s stage II, with mild to moderate systemic illness and pneumatosis intestinalis. The infants were recruited from three different hospitals in the USA: Beth Israel Hospital in Boston, MA (_n_=24); Comer Children’s Hospital at The University of Chicago in Chicago, IL (_n_=29); and NorthShore University HealthSystem Hospital in Evanston, IL (_n_=9). These infants resided in the NICU of the respective hospitals. In total, the study consists of 23 NEC-positive infants and 39 NEC-negative infants. The children were treated individually, and not as matched case controls, because of the limitations of the data set related to NEC sampling.
Table 1 Description of the cohorta
There were 63 samples from NEC-positive infants, including 51 samples from the longitudinal data sets. There were 97 samples from NEC-negative infants, where 73 samples were from longitudinal data sets, with samples from 29 infants being collected over a 3-day period. Informed consent was obtained from the preterm infants’ parents for fecal sample collection and storage. The samples were collected directly from the diaper into the collection tube using the wooden end of a sterile cotton swab. The samples were immediately frozen at −80 °C until processed. The samples were sent to Genetic Analysis, Ås, Norway, for longtime storage and DNA extraction.
DNA Extraction
DNA was isolated from 160 samples using an automated protocol of MagNA Pure Compact System (Roche Applied Science, Basel, Switzerland). DNA from a subset of samples in the data set was also manually extracted using the QIAamp DNA Stool mini kit (Qiagen, Venlo, Netherlands). These were termed duplicates. Fifty mg of frozen fecal sample was dissolved in 1 ml extraction buffer [50 mM Tris (pH 7.4), 100 mM EDTA (pH 8.0), and 400 mM NaCl, 0.5% SDS] containing 20 μl proteinase K (20 mg/ml), and 500 μl of 0.1-mm-diameter zirconia/silica beads (BioSpec Products, Bartlesville, OK) was added to the extraction tubes and a Mini-Beadbeater-16 (BioSpec Products) was used to lyse the microbial cells. The lysed cells were centrifuged, and 50 μl of the supernatant was taken for DNA isolation. In the MagNA Pure Compact System, the supernatant was mixed with paramagnetic beads and eluted using a 96 super Magnet plate (Alpaqua,Beverly, MA). In the QIAamp DNA stool mini kit, purified DNA was extracted using QIAamp mini Spin columns according to the manufacturer’s protocol.
DNA concentration and quality were determined by fluorometry using a Qubit system (Invitrogen, Waltham, MA, USA) (10–74 ng/μl; 1.4–1.8 [260/280]) and stored at −40 °C until further use.
Polymerase Chain Reaction and Gene Quantification
The primers used in the study are presented in Table 2. Each 25 μl PCR reaction contained 1 × HOT FIREPol PCR mix (Solis BioDyne, Tartu, Estonia), 200 nM forward and reverse primers, and 1 μl of sample DNA and sterile deionized water. The reaction mix was amplified using LightCycler 480 (Roche) and the resultant flourescence data were uploaded into the LinRegPCR program (20) to perform baseline correction and calculate the mean PCR efficiency. High-resolution melting curve analysis and DNA sequencing using BigDye Terminator v1.1 chemistry (Thermo Fisher Scientific, Waltham, MA) was used to verify the identity of the PCR products. The thermal cycling conditions for the 16S rRNA primer pair targeting the conserved regions of the 16S rRNA gene were 95 °C initial denaturation for 15 min, followed by 40 cycles at 95 °C for 30 s and at 60 °C for 30 s (7). Primers flanking the _int_1 gene of the integron (21), _rep_A gene of the conjugative plasmid, and the yigB gene of the hemolysin expression-modulating protein (hha) gene family were used at thermal cycling conditions of 95 °C for 15 min and for 40 cycles at 95 °C for 30 s, specified annealing temperatures for the genes (Table 2), and at 72 °C for 30 s.
Table 2 Primers used in the study
Microbial Community Analysis
The structure of the microbial community of the samples was assessed using Illumina amplicon sequencing of the 16S rRNA gene. The 16S rRNA genes were amplified using PRK341F/PRK806R primers that target the V3-V4 hypervariable regions and were modified to contain Illumina-specific adapters. Each PCR reaction contained HOT FIREPol PCR mix, 200 nM Illumina-adapter-attached forward and reverse primers, and 1 μl of sample DNA and water. The thermal cycling conditions were 95 °C for 15 min and 30 cycles at 95 °C for 30 s, at 50 °C for 1 min, and at 72 °C for 45 s. The PCR amplicons were pooled and concentration was measured using the PerfeCta NGS quantification kit (Quanta Biosciences, Beverly, MA) and purified using the Agencourt AMPure XP-PCR Purification kit (Beckman Coulter, Brea, CA). The purified products were sequenced with the Miseq platform (Illumina, San Diego, CA) using V3 chemistry with 300-bp paired-end reads.
Sequences from the 16S rRNA amplicon data were analyzed using the QIIME pipeline (22). Sequences were quality-filtered (split_libraries.py; sequence length 200–600 bp; minimum average quality score 25; and no more than six ambiguous bases, but with no primer mismatches) and then clustered at 97% homology level using Usearch version 8 against the Greengenes database (23).
Shot-gun Metagenome Sequencing and Analysis
The metagenome was fragmented, tagged, and quantified according to the Nextera XT sample preparation guide (Illumina). Concentration of the pooled library was normalized using the PerfeCta NGS quantification kit. Sequencing was done in-house on a MiSeq platform using V3 chemistry and 300-bp paired-end reads.
Metagenome data mapping and assembly was performed on Geneious (Geneious, Biomatters, New Zealand) (24) following the recommended criteria. De novo assembling of the reads was performed by Geneious Read Mapper (Geneious). MG-RAST metagenome analyzer (25) (Argonne National Laboratory, Lemont, IL) was used to analyze the functional classification in the samples using the SEED (subsystem) database that houses collections of functionally related protein families (26). The ResFinder program (DTU, Copenhagen, Denmark), an online tool, was used to find antimicrobial resistance genes in the sequences based on the NCBI database (27). The RAST (Rapid Annotation using Subsystem Technology) server using SEED-based annotation was used to identify genes within the contigs built by Geneious (28). Reference genomes for assembly and annotation were downloaded from the NCBI database.
Validation and Statistical Analyses
Technical variation was detetermined by Pearson regression analyses between the technical duplicates. To account for the uneven sampling and the presence of duplicates across the individuals, we used the average microbiota and average quantification of genes across all sampling points for each individual in the comparative statistical analyses.
Fisher’s Exact test, Pearson’s correlation, and binomial testing were used for pairwise comparisons of relative abundances of _rep_A, _int_1, and _yig_B genes within the 16S rRNA amplicon analyses and between the relative abundances of the individual genes across different hospitals. Correction for multiple testing was done using the Benjamini and Hochberg false discovery rate (BHFDR) test. Principal Component Analysis (PCA) plot was used to determine the microbiome structure of the adjusted gestational age in the preterm infants. The median from the adjusted gestational age was used to categorize the infants. Predictive models using operational taxanomic units (OTUs) in the study were made using Partial Least Squares (PLS) discriminant analysis (DA) (Eigenvector Research, Manson, WA). The models were calibrated using a subset of the data set and cross-validated using Venetian Blinds procedure, where the data were split into subsets and each subset was validated to fit the model. Cross-validated models with an accuracy of classification >0.5 indicate significance. Predictive models were made for predicting hospital location, for detection of NEC, and for determining the association of NEC with plasmid signature genes. Correlations with birth weight were identified using PLS regression. Variables important in the models were identified by the Variable Importance in Projection score, with scores >1 indicating importance to the model. All data analyses was performed using MATLAB R2014a software (The MathWorks, Natick, MA).
Results
Microbiota Composition
On average, 44,194 sequences per sample were generated by Illumina V3-V4 16S rRNA amplicon sequencing after quality filtering and chimera removal. To ensure even amounts of sequence information and to gather information on the most abundant OTUs from all samples, 6,000 sequences/sample were randomly picked from the whole data set. The final data set after quality filtering and integration of the sample information contained 192 samples, of which 58 were technical duplicates. The technical duplicates showed a mean squared regression coefficient of 0.75 and a standard deviation of 0.33 for pairwise OTU level comparisons, whereas comparison of different samples gave squared regression coefficients <0.3. In total, the sequences in the data set belonged to 299 OTUs of 13 bacterial classes. Overall, the gut microbiota composition was mainly composed of Proteobacteria with lower levels of Firmicutes.
Microbiota Associations with Metadata
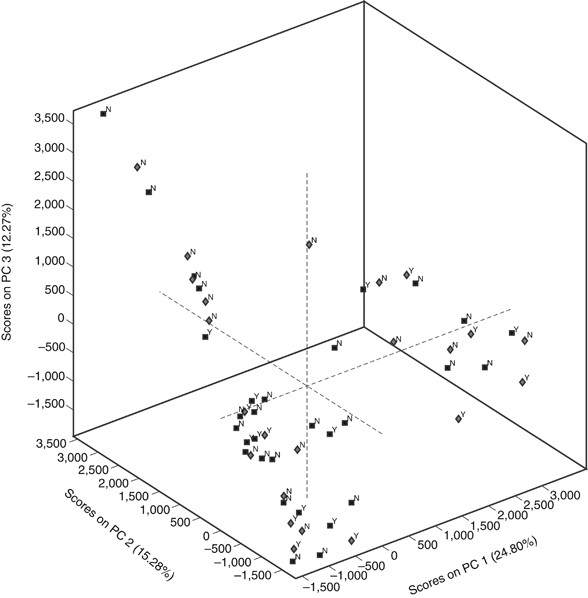
There were no major differences in the microbiome structure taking into account the adjusted gestational age between all infants (including NEC-positive and NEC-negative infants) (Figure 2). The median adjusted gestational age was 31.1weeks, which was used to categorize the preterm groups. The microbiome structure between the NEC-positive and NEC-negative infants revealed differences in a group of NEC-negative infants. However, we found no major differences in the α-diversity between the NEC-positive and NEC-negative infants (Supplementary Figure S1a); however, when calculated between the different hospitals, infants from Evanston displayed higher diversity than those from Boston and Chicago (_P_=0.003, Boston and Evanston; _P_=0.003, Chicago and Evanston, Kruskal-Wallis test) (Supplementary Figure S1b). The β-diversity estimates from PC1, on the other hand, showed significant differences between NEC-positive (median=0.16) and NEC-negative samples (median=−0.01) (_P_=0.00001, Kruskal-Wallis test), but no differences among hospitals (median=0.12 (Chicago); median=0.07 (Boston); median=0.16 (Evanston)) (_P_=0.35, Kruskal-Wallis test).
Figure 2
Adjusted gestational age microbiome structure through PCA. Squares, NEC-negative; diamond-shaped, NEC-positive; black, gestational week >31.1; gray, gestational week <31.1.
On average the proportion of Enterobacteriaceae was significantly more abundant in NEC-positive infants (59%) when compared with that in NEC-negative infants (44%, _P_=0.001, Kruskal-Wallis test). An OTU classified as Enterobacteriaceae (referred to as OTU2) revealed the strongest association with NEC having a Variable Importance in Projection score of 40 in a PLS-DA predictive model (classification accuracy of 0.80 for the calibrated model and 0.65 for the cross-validated model). OTU2 also showed a direct significant correlation with NEC (_P_=0.04, Kruskal-Wallis test) (OTU2 abundance, median=25 (NEC); median=5 (No NEC)). There were, however, no OTUs that were significantly related to mode of delivery (BHFDR-corrected Kruskal-Wallis test).
With regard to the association between microbiota composition and hospital location, predictive models using PLS-DA showed an accuracy of classification of location based on the microbiota (calibrated/cross-validated) – for Boston, 0.78/0.63; for Chicago, 0.67/0.56; and for Evanston, 0.74/0.64 – indicating predictive information in the microbiota for all locations. Specifically, an OTU classified as Enterobacteriaceae (referred to as OTU9) showed pronounced association with hospital location, having a median of 5.0% for Boston, 0.7% for Chicago, and 0.3% for Evanston (P<0.0005, Kruskal-Wallis test). OTU2 also showed significant associations with Evanston (median= 11.4%) as opposed to 0.1% and 0.2% in Chicago and Boston, respectively (_P_=0.05, Kruskal-Wallis test). A predictive model for the association between microbiota composition and birth weight by PLS-DA showed an accuracy of classification of 0.76/0.59 (calibrated and cross-validated) in the median binarized data set. When directly correlated, OTU2 and birth weight showed the strongest negative correlation (Spearman rho=0.45; _P_=0.005), whereas OTU9 showed the strongest positive correlation (Spearman rho=0.45; _P_=0.004).
Shot-gun Metagenome Analyses
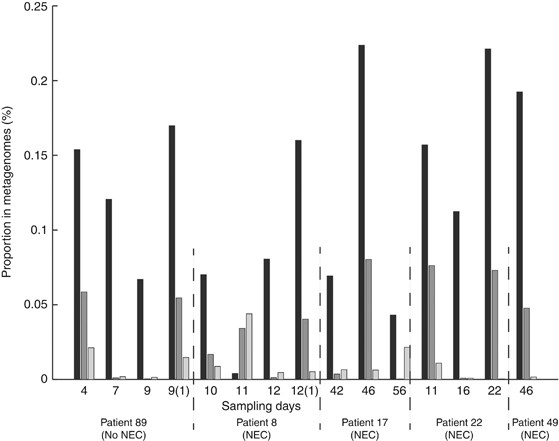
Because OTU2 was positively associated with the detection of NEC and negatively associated with birth weight, we selected longitudinal samples from three patients having high abundance of OTU2: Patient 17 from Chicago and Patient 49 from Evanston positive for NEC and Patient 89 from Boston negative for NEC. In addition to this, longitudinal samples of Patient 86 from Boston and Patient 22 from Chicago having low abundance of OTU2 and positive for NEC were also selected (Supplementary Table S1). On average, 691,759 sequences were generated per sample with a size range of 35-301 bp. The unassembled reads were uploaded into MG-RAST metagenome analyzer. The functional abundance of genes related to conjugative plasmids, MGE, and virulence were analyzed in the metagenomes using the SEED Subsystem Annotation database (mininum identity 90%; minimum alignment length 50 bp). However, there were no clear differences in gene distribution between NEC-positive and NEC-negative samples (Figure 3).
Figure 3
Abundance of functional genes for conjugative plasmid, MGE, and virulence genes. Maximum E-value, 1e-5; minimum identity, 90%; and minimum alignment length, 50bp was regarded as hit. Black, hits to conjugative plasmid; dark gray, hits to mobile genetic elements; light gray, hits to virulence; and invasin genes; (1) extra sample with same sampling day.
Common antibiotics used in the NICU, such as gentamicin, vancomycin, and ampicillin, were received by all infants. The unassembled raw reads were uploaded onto ResFinder to locate AR genes in the samples. Genes associated with resistance to β-lactams, macrolides, and aminoglycosides were found in almost all samples (threshold pairwise identity 99%) (Table 3). Longitudinal carriage of particular resistance genes was observed in all infants; however, no clear association was identified for AR genes and NEC.
Table 3 Antibiotic resistance genes found in longitudinal samples of the patients taken from ResFinder
Metagenome Assembly
The reads were trimmed (error probability 0.05) and paired using Geneious. The paired reads were then built into contigs by Geneious Read Mapper. On average, 1,800 contigs greater than 1,000 bp in length with at least 96 contigs greater than the N50 length were assembled per sample by the assembler. The contigs from all samples were evaluated for the presence of an OTU2 representative sequence (Supplementary Table S2). The contigs with OTU2 representative sequence of each sample showed highest identity to HG428755, an enteropathogenic E coli (EPEC) (E-value=0; identity >96%; query coverage >80%) that was used as a model to study host–pathogen interactions. In order to understand the coverage of this genome by our metagenomic reads, the samples were mapped directly toward this genome and its corresponding plasmids (CBTO010000001 and CBTO010000002) (Supplementary Table S3).
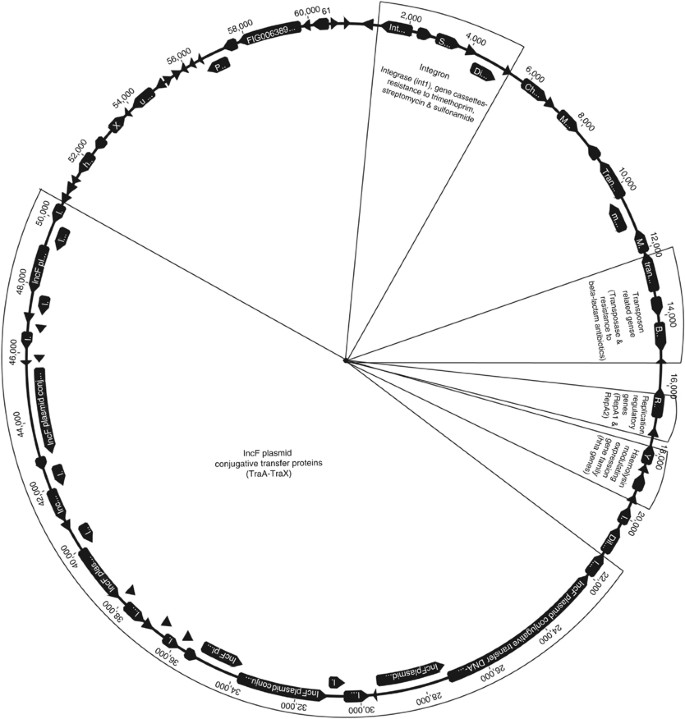
To identify potential complete conjugative plasmids assembled from our data set, the _de novo_-assembled contigs from each sample having plasmid-related genes were annotated using the RAST annotation server. All the identified contigs were 97% identical with 98% pairwise identity with each other. A representative contig 61,058 bp in length annotated by RAST was found to belong to a conjugative plasmid homolog of the IncF group of plasmids (Figure 4). This annotated plasmid contained genes for transfer (_tra_A-_tra_X), replication (_rep_A), and resistance for trimethoprim, streptomycin, and sulfonamides carried in an integron. In addition there were genes for the hemolysin expression-modulating (hha) family (_yih_A, _yig_B, and _fin_O) that regulate the production of α-hemolysin toxin and several invasin genes (29). NCBI-BLAST analysis of this contig revealed similar IncF conjugative plasmids in E. coli (E-value 0; identity 100%; average query coverage 58% range (35–78%)).
Figure 4
_De novo_-assembled conjugative plasmid. A conjugative plasmid of 61,058 bp was assembled by de novo assembling of metagenomic reads and annotated by RAST using SEED subsystem database.
To determine the presence of other conjugative plasmids in our data set, the metagenomic reads from all samples were mapped toward the _de novo_-assembled conjugative plasmid. Seven of the fifteen samples covered >80% of the assembled conjugative plasmids with 98% pairwise identity (sampling day 4 (and 91) of Patient 89; sampling day 12 of Patient 86; sampling day 46 of Patient 17; sampling day 11 of Patient 22; and sampling day 46 of Patient 49). The seven samples with >80% coverage also covered the integron with the gene cassettes and the replication and transfer genes of the IncF plasmid family (coverage >80%; pairwise identity >97%). Eight samples including the seven samples and day 11 sample of Patient 86 covered >90% of plasmid sequences mapped to the hha gene family (coverage >80%; pairwise identity >97%) (Supplementary Table S4).
Quantification of Signature Sequences of Conjugative Plasmids
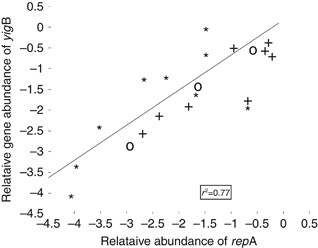
Distinct regions of the _de novo_-assembled conjugative plasmid were selected as signature sequences. Replication machinery (replication regulatory gene _rep_A), virulence (hha gene family _yig_B), and carrier of multidrug resistance genes (class I integron integrase gene _int_1) were targeted and screened in our data set using quantitative PCR. In total, 23% of the samples from the data set contained at least one of these genes. Interestingly, the relative gene abundance of _rep_A strongly correlated with _yig_B (P<0.0001, Pearson correlation; _r_2=0.8), indicating that the replication genes and virulence genes are likely in the same genetic element (Figure 5). No significant correlations were found between _int_1 and _rep_A or between _int_1 and _yig_B (_r_2<0.5).
Figure 5
Correlation analysis of _rep_A and _yig_B gene abundances. Pearson correlation of _rep_A and _yig_B genes in samples from Boston, Chicago, and Evanston. * samples from Boston; + samples from Chicago; o samples from Evanston.
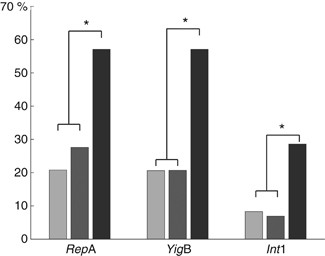
With respect to the association of OTUs and signature genes, the genes showed a significant microbiota association with an accuracy of classification (calibrated/validated) of 0.80/0.67 for _int_1 gene, 0.85/0.74 for _rep_A gene, and 0.8/0.66 for _yig_B gene on using PLS-DA. OTU2 showed significant association with _rep_A and _int_1, showing a median of 5.6% for _int_1-positive samples and 0.0006% for _int_1-negative samples (_P_=0.015. Kruskal-Wallis test) and 8.9% for _rep_A-positive samples and 0.0006% for _rep_A-negative samples (P<0.0005, Kruskal-Wallist test). However, there was no significant association between OTU2 and _yig_B (_P_=0.13, Kruskal-Wallis test). Samples from Evanston showed a higher prevalence of the signature genes compared with the other hospitals (Figure 6). There were no direct significant correlations between the signature genes and NEC, nor with the mode of delivery.
Figure 6
Geographical distribution of plasmid signature genes. Relative proportion of samples positive to _rep_A, _yig_B, and _int_1 genes in Boston, Chicago, and Evanston. Black, samples from Evanston; dark gray, samples from Chicago; light gray, samples from Boston. *P value>0.0001(binomial testing).
Longitudinal Associations of OTU2 and Signature Sequences
Samples were plotted on a longitudinal time scale from time of birth to end of sampling in order to detect temporal acquisition of plasmid-related signature genes and co-occurence of OTU2 (Table 4). The diagnosis of NEC was significantly associated with high levels of OTU2 (>25%) (_P_=0.01, Fisher’s Exact test)
Table 4 Abundance levels of OTU2 and signature genes in longitudinal data sets of NEC-positive and -negative infants
PLS-DA revealed that NEC is associated with signature sequences with an accuracy of classification of 0.79/0.56 (calibrated/validated). r_ep_A and _int_1 showed the highest Variable Importance in Projection score (>1) associated with NEC. All NEC-positive infants showed an increase in the levels of _rep_A and _yig_B at the time of NEC diagnosis.
Discussion
Although many studies have attempted to characterize the microbiome of preterm infants, this work to our knowledge is the first to investigate the mobilome. We found clear differences in the distribution of the plasmids and OTUs among the three hospitals investigated. Even the hospitals in Evanston and Chicago, which are in the same metropolitan area, had significant differences in microbial populations and plasmid content of the preterm infants. The hospital environment has been identified as an important reservoir for both the bacteria and the plasmids (30). The NICUs in different hospitals also house their own unique microbial flora consisting of a suite of genes possibly encoded in plasmid genomes (31). Thus, a likely explanation for the observed differences between hospitals in the preterm infant gut microbiota could be environmental exposure.
We also found potential association of the prevalence of conjugative plasmids and integrons with NEC. However, to demonstrate the connection of the mobilome to NEC, a larger study cohort with case controls, defined longitudinal time periods, and extensive enrollment data would be needed.
The _de novo_-assembled conjugative plasmids that were identified contained the genes necessary for conjugal transfer, as well as virulence genes and AR genes. Potential virulence factors were also found within the conjugative plasmid, as the _rep_A gene, the replication regulatory gene of the conjugative plasmid, and _yig_B, the gene from the hha family, showed a significant correlation. The hha gene family plays a role in regulating the expression of virulence genes such as the α-hemolysin gene family, in response to virulence factor expression (29, 32). The α-hemolysin toxin has been previously shown to play a role in the development of enterocolitis in humans and animals (33). In addition, a correlation between the hha gene family and other conjugative plasmids has been previously reported (34).
In addition to this, an integron that contained trimethoprim and streptomycin resistance gene cassettes was also assembled within the conjugative plasmid. The integron is a genetic element most commonly found within transposons and plasmids. They can carry multiple resistance genes as gene cassettes (17). The use of antibiotics can drive the selection pressure to antibiotic-resistant bacteria in the gut. Unfortunately, the lack of control groups with no antibiotic usage limits our study to link the effect of antibiotics to the mobilome.
Differences in the microbiome structure due to adjusted gestational age has been previously reported (35, 36). However, in our data set we did not find any differences in the microbiome structure due to adjusted gestational age. This lack of association, however, could be due to the size and structure of the data set.
In summary, even though this data set has limitations of small size and irregular sampling times, the study data suggest that the preterm infant gut microbiota indeed harbors a mobilome with accessory genes relating to antibiotic resistance and virulence. However, regarding the prevalence of MGEs, as preterm infants spend many months in the hospital environment, understanding the NICU microbial flora and transmission of MGEs will be critical for optimizing the health of these vulnerable infants.
References
- Santos J, Pearce SE, Stroustrup A . Impact of hospital-based environmental exposures on neurodevelopmental outcomes of preterm infants. Curr Opin Pediatr 2015;27:254–260.
Article CAS PubMed PubMed Central Google Scholar - Patel RM, Denning PW . Intestinal microbiota and its relationship with necrotizing enterocolitis. Pediatr Res 2015;78:232–238.
Article CAS PubMed PubMed Central Google Scholar - Unger S, Stintzi A, Shah P, Mack D, O'Connor DL . Gut microbiota of the very-low-birth-weight infant. Pediatr Res 2015;77:205–213.
Article PubMed Google Scholar - Collado MC, Cernada M, Neu J, Perez-Martinez G, Gormaz M, Vento M . Factors influencing gastrointestinal tract and microbiota immune interaction in preterm infants. Pediatr Res 2015;77:726–731.
Article PubMed Google Scholar - Warner BB, Tarr PI . Necrotizing enterocolitis and preterm infant gut bacteria. Semin Fetal Neonatal Med 2016;21:394–399.
Article PubMed PubMed Central Google Scholar - Fitzgibbons SC, Ching Y, Yu D et al. Mortality of necrotizing enterocolitis expressed by birth weight categories. J Pediatr Surg 2009;44:1072–1076.
Article PubMed Google Scholar - Ravi A, Avershina E, Foley SL et al. The commensal infant gut meta-mobilome as a potential reservoir for persistent multidrug resistance integrons. Sci Rep 2015;5:15317.
Article CAS PubMed PubMed Central Google Scholar - Norman A, Hansen LH, Sørensen SJ . Conjugative plasmids: vessels of the communal gene pool. Philos Trans R Soc Lond B Biol Sci 2009;364:2275–2289.
Article CAS PubMed PubMed Central Google Scholar - Bahl MI, Hansen LH, Sørensen SJ Persistence Mechanisms of Conjugative Plasmids. In: Horizontal Gene Transfer: Genomes in Flux Gogarten MB, Gogarten JP, Olendzenski LC eds. Humana Press: Totowa, NJ, 2009, pp 73–102.
Book Google Scholar - Carattoli A . Resistance plasmid families in Enterobacteriaceae. Antimicrob Agents Chemother 2009;53:2227–2238.
Article CAS PubMed PubMed Central Google Scholar - Carattoli A . Plasmids in Gram negatives: molecular typing of resistance plasmids. Int J Med Microbiol 2011;301:654–658.
Article CAS PubMed Google Scholar - Ogilvie LA, Firouzmand S, Jones BV . Evolutionary, ecological and biotechnological perspectives on plasmids resident in the human gut mobile metagenome. Bioeng Bugs 2012;3:13–31.
PubMed PubMed Central Google Scholar - Ghigo J-M . Natural conjugative plasmids induce bacterial biofilm development. Nature 2001;412:442–445.
Article CAS PubMed Google Scholar - Johnson TJ, Nolan LK . Pathogenomics of the virulence plasmids of Escherichia coli. Microbiol Mol Biol Rev 2009;73:750–774.
Article CAS PubMed PubMed Central Google Scholar - Foster TJ . Plasmid-determined resistance to antimicrobial drugs and toxic metal ions in bacteria. Microbiol Rev 1983;47:361–409.
CAS PubMed PubMed Central Google Scholar - Wallden K, Rivera-Calzada A, Waksman G . Type IV secretion systems: versatility and diversity in function. Cell Microbiol 2010;12:1203–1212.
Article CAS PubMed PubMed Central Google Scholar - Ravi A, Avershina E, Ludvigsen J, L′Abée-Lund TM, Rudi K . Integrons in the intestinal microbiota as reservoirs for transmission of antibiotic resistance genes. Pathogens 2014;3:238–248.
Article CAS PubMed PubMed Central Google Scholar - Mazel D . Integrons: agents of bacterial evolution. Nat Rev Microbiol 2006;4:608–620.
Article CAS PubMed Google Scholar - Domingues S, da Silva GJ, Nielsen KM . Integrons: vehicles and pathways for horizontal dissemination in bacteria. Mob Genet Elements 2012;2:211–223.
Article PubMed PubMed Central Google Scholar - Ruijter JM, Pfaffl MW, Zhao S et al. Evaluation of qPCR curve analysis methods for reliable biomarker discovery: bias, resolution, precision, and implications. Methods 2013;59:32–46.
Article CAS PubMed Google Scholar - L'Abee-Lund TM, Sorum H . Class 1 integrons mediate antibiotic resistance in the fish pathogen Aeromonas salmonicida worldwide. Microb Drug Resist 2001;7:263–272.
Article CAS PubMed Google Scholar - Caporaso JG, Kuczynski J, Stombaugh J et al. QIIME allows analysis of high-throughput community sequencing data. Nat Methods 2010;7:335–336.
Article CAS PubMed PubMed Central Google Scholar - DeSantis TZ, Hugenholtz P, Larsen N et al. Greengenes, a chimera-checked 16S rRNA gene database and workbench compatible with ARB. Appl Environ Microbiol 2006;72:5069–5072.
Article CAS PubMed PubMed Central Google Scholar - Kearse M, Moir R, Wilson A et al. Geneious Basic: an integrated and extendable desktop software platform for the organization and analysis of sequence data. Bioinformatics 2012;28:1647–1649.
Article PubMed PubMed Central Google Scholar - Meyer F, Paarmann D, D'Souza M et al. The metagenomics RAST server - a public resource for the automatic phylogenetic and functional analysis of metagenomes. BMC Bioinformatics 2008;9:386.
Article CAS PubMed PubMed Central Google Scholar - Overbeek R, Begley T, Butler RM et al. The subsystems approach to genome annotation and its use in the project to annotate 1000 genomes. Nucleic Acids Res 2005;33:5691–5702.
Article CAS PubMed PubMed Central Google Scholar - Zankari E, Hasman H, Cosentino S et al. Identification of acquired antimicrobial resistance genes. J Antimicrob Chemother 2012;67:2640–2644.
Article CAS PubMed PubMed Central Google Scholar - Aziz RK, Bartels D, Best AA et al. The RAST Server: rapid annotations using subsystems technology. BMC Genomics 2008;9:1–15.
Article Google Scholar - Nieto JM, Carmona M, Bolland S, Jubete Y, de la Cruz F, Juarez A . The hha gene modulates haemolysin expression in Escherichia coli. Mol Microbiol 1991;5:1285–1293.
Article CAS PubMed Google Scholar - Porse A, Schønning K, Munck C, Sommer MOA . Survival and evolution of a large multidrug resistance plasmid in new clinical bacterial hosts. Mol Biol Evol 2016;33:2860–2873.
Article CAS PubMed PubMed Central Google Scholar - Brooks B, Firek BA, Miller CS et al. Microbes in the neonatal intensive care unit resemble those found in the gut of premature infants. Microbiome 2014;2:1.
Article PubMed PubMed Central Google Scholar - Madrid C, Nieto JM, Juárez A . Role of the Hha/YmoA family of proteins in the thermoregulation of the expression of virulence factors. Int J Med Microbiol 2001;291:425–432.
Article Google Scholar - Dittmar E, Beyer P, Fischer D et al. Necrotizing enterocolitis of the neonate with Clostridium perfringens: diagnosis, clinical course, and role of alpha toxin. Eur J Pediatr 2008;167:891–895.
Article PubMed Google Scholar - Paytubi S, Dietrich M, Queiroz MH, Juárez A . Role of plasmid- and chromosomally encoded Hha proteins in modulation of gene expression in E. coli O157:H7. Plasmid 2013;70:52–60.
Article CAS PubMed Google Scholar - Warner BB, Deych E, Zhou Y et al. Gut bacteria dysbiosis and necrotising enterocolitis in very low birthweight infants: a prospective case-control study. Lancet 2016;387:1928–1936.
Article PubMed PubMed Central Google Scholar - Battersby C, Longford N, Costeloe K, Modi N,, UK Neonatal Collaborative Necrotising Enterocolitis Study Group. Development of a gestational age-specific case definition for neonatal necrotizing enterocolitis. JAMA Pediatr 2017;171:256–263.
Article PubMed Google Scholar
Author information
Authors and Affiliations
- Biotechnology and Food Science Department (IKBM), Chemistry, Norwegian University of Life Sciences, Campus Ås, Ås, Norway
Anuradha Ravi, Eva Lena F Estensmo & Knut Rudi - Department of Food Safety and Infection Biology, Norwegian University of Life Sciences, Campus Adamstuen, Oslo, Norway
Trine M L’ Abée-Lund - Division of Microbiology, U.S. Food and Drug Administration, National Center for Toxicology Research, Jefferson, Arkansas
Steven L Foley - Department of Pediatrics, NorthShore University HealthCenter, Evanston, Illinois
Bernhard Allgaier - Department of Neonatology and Division of Translational Research, Beth Israel Deaconess Medical Center, Boston, Massachusetts
Camilia R Martin - Departments of Pediatrics and Medicine, Biological Sciences Division, The University of Chicago, Chicago, Illinois
Erika C Claud
Authors
- Anuradha Ravi
- Eva Lena F Estensmo
- Trine M L’ Abée-Lund
- Steven L Foley
- Bernhard Allgaier
- Camilia R Martin
- Erika C Claud
- Knut Rudi
Corresponding author
Correspondence toKnut Rudi.
Ethics declarations
Competing interests
The authors declare no conflict of interest.
Additional information
Statement of financial support
The work was supported by Quota scholarship and funded by Norwegian University of Life Sciences, Ås campus, Norway.
Supplementary material is linked to the online version of the paper at
Supplementary information
Rights and permissions
About this article
Cite this article
Ravi, A., Estensmo, E., Abée-Lund, T. et al. Association of the gut microbiota mobilome with hospital location and birth weight in preterm infants.Pediatr Res 82, 829–838 (2017). https://doi.org/10.1038/pr.2017.146
- Received: 05 August 2016
- Accepted: 04 June 2017
- Published: 02 August 2017
- Issue Date: November 2017
- DOI: https://doi.org/10.1038/pr.2017.146
