Functional Variant in the GCKR Gene Affects Lactate Levels Differentially in the Fasting State and During Hyperglycemia (original) (raw)
Introduction
Genome-wide association studies (GWAS) have identified over 100 gene variants associated with type 2 diabetes (T2D), including the Glucokinase Regulatory Protein gene (GCKR; MIM 613463)[1](/articles/s41598-018-34501-9#ref-CR1 "Fuchsberger, C. et al. The genetic architecture of type 2 diabetes. Nature 536, 41–7, https://doi.org/10.1038/nature18642
             (2016)."). Glucokinase Regulatory Protein (GKRP; NP\_001477), encoded by _GCKR_, is almost exclusively expressed in the liver, where it inhibits glucokinase (GCK) in the nucleus of the hepatocytes at low glucose concentrations[2](/articles/s41598-018-34501-9#ref-CR2 "Van Schaftingen, E., Detheux, M. & Veiga da Cunha, M. Short-term control of glucokinase activity: role of a regulatory protein. FASEB J. 8, 414–9 (1994)."). An intronic variant rs780094 and a coding variant rs1260326 of _GCKR_ are in high linkage disequilibrium (LD), and these variants have been found to be associated with glucose and lactate levels, and a wide range of other metabolic traits[3](#ref-CR3 "Orho-Melander, M. et al. Common missense variant in the glucokinase regulatory protein gene is associated with increased plasma triglyceride and C-reactive protein but lower fasting glucose concentrations. Diabetes 57, 3112–21,
              https://doi.org/10.2337/db08-0516

             (2008)."),[4](#ref-CR4 "Dupuis, J. et al. New genetic loci implicated in fasting glucose homeostasis and their impact on type 2 diabetes risk. Nature Genet. 42, 105–116,
              https://doi.org/10.1038/ng.520

             (2010)."),[5](#ref-CR5 "Stancáková, A. et al. Hyperglycemia and a common variant of GCKR are associated with the levels of eight amino acids in 9,369 Finnish men. Diabetes 61, 1895–902,
              https://doi.org/10.2337/db11-1378

             (2012)."),[6](#ref-CR6 "Tin, A. et al. GCKR and PPP1R3B identified as genome-wide significant loci for plasma lactate: the Atherosclerosis Risk in Communities (ARIC) study. Diabet Med. 33, 968–75,
              https://doi.org/10.1111/dme.12971

             (2016)."),[7](#ref-CR7 "Aulchenko, Y. S. et al. Loci influencing lipid levels and coronary heart disease risk in 16 European population cohorts. Nat Genet. 41, 47–55,
              https://doi.org/10.1038/ng.269

             (2009)."),[8](#ref-CR8 "Stančáková, A. et al. Effects of 34 risk loci for type 2 diabetes or hyperglycemia on lipoprotein subclasses and their composition in 6,580 nondiabetic Finnish men. Diabetes 60 1608–16 10.2 (2011)."),[9](/articles/s41598-018-34501-9#ref-CR9 "Mahendran, Y. et al. Association of ketone body levels with hyperglycemia and type 2 diabetes in 9,398 Finnish men. Diabetes 62, 3618–26,
              https://doi.org/10.2337/db12-1363

             (2013)."), _de novo_ lipogenesis in obese young individuals[10](/articles/s41598-018-34501-9#ref-CR10 "Santoro, N. et al. Hepatic De Novo Lipogenesis in Obese Youth Is Modulated by a Common Variant in the GCKR Gene. J. Clin. Endocrinol. Metab. 100, E1125–32,
              https://doi.org/10.1210/jc.2015-1587

             (2015)."), and the risk of non-alcoholic fatty liver disease, nonalcoholic steatohepatitis and liver fibrosis[11](#ref-CR11 "Petta, S. et al. Glucokinase regulatory protein gene polymorphism affects liver fibrosis in non-alcoholic fatty liver disease. PLoS One, 9, e87523,
              https://doi.org/10.1371/journal.pone.0087523

             (2014)."),[12](#ref-CR12 "Brouwers, M. C., Jacobs, C., Bast, A., Stehouwer, C. D. & Schaper, N. C. Modulation of Glucokinase Regulatory Protein: A Double-Edged Sword? Trends Mol Med. 21, 583–94,
              https://doi.org/10.1016/j.molmed.2015.08.004

             (2015)."),[13](#ref-CR13 "Santoro, N. et al. Variant in the glucokinase regulatory protein (GCKR) gene is associated with fatty liver in obese children and adolescents. Hepatology 55, 781–9,
              https://doi.org/10.1002/hep.24806

             (2012)."),[14](/articles/s41598-018-34501-9#ref-CR14 "Eslam, M., Valenti, L. & Romeo, S. Genetics and epigenetics of NAFLD and NASH: Clinical impact. J Hepatol. 68, 268–279,
              https://doi.org/10.1016/j.jhep.2017.09.003

             (2018)."). Functional studies of rs1260326 have shown that the minor T allele of a non-synonymous P446L substitution of _GCKR_ leads to a weak GCK binding at low glucose concentrations, and impaired response to fructose-6 phosphate[15](/articles/s41598-018-34501-9#ref-CR15 "Beer, N. L. et al. The P446L variant in GCKR associated with fasting plasma glucose and triglyceride levels exerts its effect through increased glucokinase activity in liver. Hum Mol Genet. 18, 4081–8,
              https://doi.org/10.1093/hmg/ddp357

             (2009)."),[16](/articles/s41598-018-34501-9#ref-CR16 "Rees, M. G. et al. Cellular characterisation of the GCKR P446L variant associated with type 2 diabetes risk. Diabetologia. 55, 114–122,
              https://doi.org/10.1007/s00125-011-2348-5

             (2012)."). We recently demonstrated that the intronic locus including rs780094 is a transcriptional enhancer that regulates _GCKR_ expression in a haplotype specific manner[17](/articles/s41598-018-34501-9#ref-CR17 "López Rodríguez, M. et al. Identification and characterization of a FOXA2-regulated transcriptional enhancer at a type 2 diabetes intronic locus that controls GCKR expression in liver cells. Genome Med. 9(1), 63,
              https://doi.org/10.1186/s13073-017-0453-x

             (2017).").
The important role of GKRP and GCK in the regulation of glucose metabolism in the liver suggests that any functional variant affecting GCKR/GKRP could have an effect on glucose metabolism. Lactate is produced by the reduction of pyruvate coupled to the oxidation of reduced nicotinamide adenine dinucleotide (NADH) to NAD+. Glucose, contributing to about 65% of circulating lactate[18](/articles/s41598-018-34501-9#ref-CR18 "Adeva-Andany, M. et al. Comprehensive review on lactate metabolism in human health. Mitochondrion 17, 76–100, https://doi.org/10.1016/j.mito.2014.05.007
             (2014).") and alanine are the main sources of lactate formation in humans. Plasma lactate levels represent a balance between its formation and clearance. In the fasting state, circulating lactate released mainly from skeletal muscle and adipose tissue is taken up by the liver and used for gluconeogenesis, whereas glucose is metabolized to lactate at high glucose availability[19](/articles/s41598-018-34501-9#ref-CR19 "Ferguson, B. S. et al. Lactate metabolism: historical context, prior misinterpretations, and current understanding. Eur J Appl Physiol. 118, 691–728,
              https://doi.org/10.1007/s00421-017-3795-6

             (2018)."). Therefore, blood lactate levels reflect the rate of hepatic glucose metabolism. Previous studies have shown that P446L of _GCKR_ is associated with lactate levels in the fasting state[6](/articles/s41598-018-34501-9#ref-CR6 "Tin, A. et al. GCKR and PPP1R3B identified as genome-wide significant loci for plasma lactate: the Atherosclerosis Risk in Communities (ARIC) study. Diabet Med. 33, 968–75,
              https://doi.org/10.1111/dme.12971

             (2016)."),[10](/articles/s41598-018-34501-9#ref-CR10 "Santoro, N. et al. Hepatic De Novo Lipogenesis in Obese Youth Is Modulated by a Common Variant in the GCKR Gene. J. Clin. Endocrinol. Metab. 100, E1125–32,
              https://doi.org/10.1210/jc.2015-1587

             (2015)."),[20](/articles/s41598-018-34501-9#ref-CR20 "Suhre, K. et al. Human metabolic individuality in biomedical and pharmaceutical research. Nature 477, 54–60,
              https://doi.org/10.1038/nature10354

             (2011)."), and after an intake of glucose and fructose[10](/articles/s41598-018-34501-9#ref-CR10 "Santoro, N. et al. Hepatic De Novo Lipogenesis in Obese Youth Is Modulated by a Common Variant in the GCKR Gene. J. Clin. Endocrinol. Metab. 100, E1125–32,
              https://doi.org/10.1210/jc.2015-1587

             (2015).").
The aims of our study were, i) to investigate the association of rs780094 of GCKR with lactate levels in the fasting state and during hyperglycemia, and ii) to examine the effects of increasing GKRP levels on lactate production to understand the mechanisms underlying the association of rs780094 of GCKR with lactate levels. Our study, including human data and overexpression models in HepG2 cells and human primary hepatocytes (HPH), provides new insights into the mechanisms by which rs780094 regulates glucose metabolism in the liver.
Results
Association of rs780094 of GCKR with lactate levels
To investigate the association between the genotypes of rs780094 and lactate levels we performed a seven time point oral glucose tolerance test (OGTT) in 1,288 participants of the METSIM study8 (Table 1). Compared to the T allele, the C allele of rs780094 was associated significantly with lower lactate level in the fasting state (p = 5.0 × 10⁻⁶), at 15 min (p = 5.2 × 10⁻⁹), 30 min (p = 1.2 × 10⁻¹¹), 45 min (p = 6.3 × 10⁻¹⁰), 60 min (p = 5.2 × 10⁻⁷), and 90 min (p = 0.034) (Fig. 1a,b; Supplementary Table S1). In contrast, the C allele of rs780094 was associated with higher increment in lactate levels relative to fasting lactate levels than the T allele of rs780094 at 90 min (p = 0.0006, after adjustment for insulin level p = 0.0003), and at 120 min (p = 0.0003, after adjustment for insulin level p = 0.0001) (Fig. 1c; Supplementary Table S1), whereas glucose and insulin levels did not differ significantly at any time point (Table 1; Supplementary Table S1). The associations of rs780094 and rs1260326 with lactate levels (fasting and relative to fasting) were very similar in our study, explained by high LD (0.91) between these genetic variants (Supplementary Tables S1, S2).
Table 1 Association of the genotypes of rs780094 of the GCKR gene with clinical and laboratory measurements in the METSIM study (N = 1,288).
Figure 1
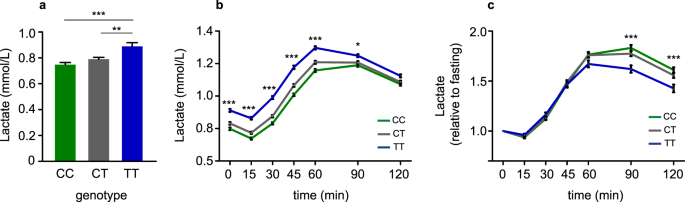
Plasma lactate levels during OGTT. (a) Fasting plasma lactate levels according to the rs780094 genotypes of GCKR (N = 1,288). Error bars represent the mean ± standard error of the mean (SEM). (b) Plasma lactate levels during a seven time point oral glucose tolerance test. (c) Plasma lactate levels relative to fasting lactate (*p < 0.05; **p < 0.01; ***p < 0.001, one-way ANOVA).
Effect of increased amounts of GKRP on lactate levels in HepG2 and HPH cells
We recently demonstrated that a locus represented by rs780094 is a transcriptional enhancer that regulates GCKR expression[17](/articles/s41598-018-34501-9#ref-CR17 "López Rodríguez, M. et al. Identification and characterization of a FOXA2-regulated transcriptional enhancer at a type 2 diabetes intronic locus that controls GCKR expression in liver cells. Genome Med. 9(1), 63, https://doi.org/10.1186/s13073-017-0453-x
             (2017)."). We showed that the CGG haplotype, formed by the rs780094, rs780095 and rs780096 genetic variants, had higher transcriptional activity compared to the TAC haplotype, suggesting that differences in _GCKR_ expression between the carriers of these two haplotypes may explain previously reported associations of this locus with metabolic parameters, including lactate. To investigate the mechanisms underlying the association of the alleles of rs780094 with lactate levels at different glucose concentrations we cotransfected HepG2 cells with plasmids expressing _GCK_ and _GCKR_ at three different molar ratios (_GCK_:_GCKR_ 1:0, 1:1, 1:3). We found that upon stimulation with high glucose, lactate levels increased depending on the amount of _GCKR_ transfected. At 10 mM of glucose, lactate levels increased by 9% (_GCK:GCKR_ ratio of 1:3 compared to 1:0, p = 0.001; and _GCK_:_GCKR_ ratio 1:1 compared to 1.0, p = 0.002) (Fig. [2a](/articles/s41598-018-34501-9#Fig2)), whereas at 16.7 mM of glucose the increments were 27% (p = 1.3 × 10⁻⁴) and 16% (p = 0.004), respectively (Fig. [2b](/articles/s41598-018-34501-9#Fig2)). No differences in lactate levels were observed at nondiabetic level of glucose (5.5 mM) (Fig. [2c](/articles/s41598-018-34501-9#Fig2)). Lactate levels did not differ when the cells were cotransfected with _GCK_ and the control plasmid pCMV6-XL4, and treated with 16.7 mM of glucose (Supplementary Fig. [S1](/articles/s41598-018-34501-9#MOESM1)). These results suggest that an increase in lactate levels is dependent on an increase in GKRP levels. We also showed that the levels of GCK increased with GKRP even when the amount of _GCK_ plasmid transfected was constant, in agreement with previous studies[21](/articles/s41598-018-34501-9#ref-CR21 "Jin, L. et al. Role of glucokinase in the subcellular localization of glucokinase regulatory protein. Int J Mol Sci. 16, 7377–93,
              https://doi.org/10.3390/ijms16047377

             (2015).") (Fig. [2d](/articles/s41598-018-34501-9#Fig2); Supplementary Fig. [S2](/articles/s41598-018-34501-9#MOESM1)).
Figure 2
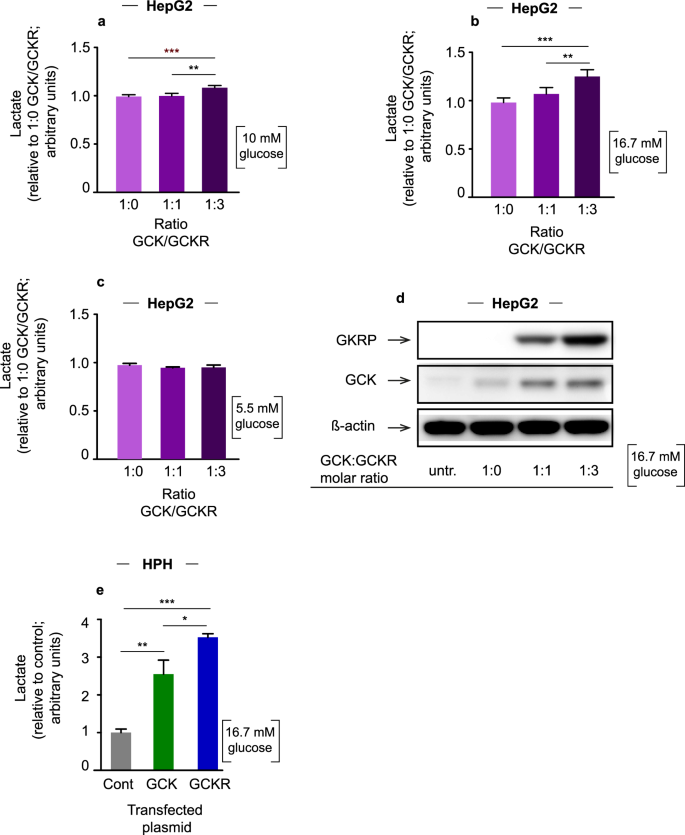
Lactate levels and western blot. (a) Lactate levels in HepG2 cells cotransfected with plasmid expressing GCK and GCKR in three different DNA molar ratios (1:0, 1:1 and 1:3: GCK:GCKR) and stimulated with 10 mM of glucose. (b) Cells stimulated with 16.7 mM of glucose. (c) Cells stimulated with 5 mM of glucose. The values are presented as relative to 1:0. Error bars represent the standard deviation (SD) (**p < 0.01; ***p < 0.001 one-way ANOVA). (d) Cropped images of the representative western blots (at 16.7 mM glucose). Cell extracts from the lactate experiments were used for GCK and GKRP western blots with ß-actin as loading control. Full-length blots are presented in Supplementary Information (Supplementary Fig. S2). (e) Lactate levels in HPH cells transfected with plasmid expressing GCK, GCKR or the control plasmid pCMV6-XL4 and treated with 16.7 mM of glucose. Error bars represent SD (*p < 0.05, **p < 0.01; ***p < 0.001; one-way ANOVA; single donor; 4 technical replicates).
Next we transfected HPH cells from a single male donor with a control plasmid or plasmids expressing GCK or GCKR and treated these cells with 16.7 mM of glucose. Overexpression of GCK resulted in an increase in lactate levels compared to control (2.5 fold; p = 0.002) (Fig. 2e). Overexpression of GKRP resulted in the highest increase in lactate levels upon glucose stimulation, in agreement with the results in HepG2 cells (3.7-fold compared to control, p = 6.5 × 10⁻⁵; 1.5-fold compared to GCK overexpression, p = 0.03) (Fig. 2d).
Effect of glucagon and FOXA2 on GCKR expression
Our previous characterization of an intronic locus including rs780094 demonstrated that a transcriptional enhancer regulates GCKR expression in response to FOXA2 in a haplotype specific way (CGG > TAC; rs780094-rs780095-rs780096)[17](/articles/s41598-018-34501-9#ref-CR17 "López Rodríguez, M. et al. Identification and characterization of a FOXA2-regulated transcriptional enhancer at a type 2 diabetes intronic locus that controls GCKR expression in liver cells. Genome Med. 9(1), 63, https://doi.org/10.1186/s13073-017-0453-x
             (2017)."). This suggests that FOXA2 activating signals may induce differential _GCKR_ transcription through the allele-specific activation of the enhancer by FOXA2\. _GCKR_ expression is induced by insulin and elevated glucose level in the fed state[22](/articles/s41598-018-34501-9#ref-CR22 "Arden, C. et al. Elevated glucose represses liver glucokinase and induces its regulatory protein to safeguard hepatic phosphate homeostasis. Diabetes 60, 3110–20,
              https://doi.org/10.2337/db11-0061

             (2011)."), whereas FOXA2 is activated by glucagon in the fasting state[23](/articles/s41598-018-34501-9#ref-CR23 "von Meyenn, F. et al. Glucagon-induced acetylation of FOXA2 regulates hepatic lipid metabolism. Cell Metab. 17, 436–47,
              https://doi.org/10.1016/j.cmet.2013.01.014

             (2013)."). Therefore, we investigated the relationship between glucagon and FOXA2 in the activation of _GCKR_. To determine the effect of glucagon on _GCKR_ expression we treated HPH cells with two different concentrations of glucagon (0.5 and 1 µg/ml). Our results showed that 0.5 and 1 µg/ml of glucagon increased total _GCKR_ expression by 21% (p = 0.03) and 38% (p = 0.01) in these cells (Fig. [3a](/articles/s41598-018-34501-9#Fig3)). To investigate whether the effect of glucagon on _GCKR_ expression is dependent on FOXA2 we used HepG2 cells, given its significantly higher transfection efficiency compared to HPH cells. We demonstrated that only the cells transfected with FOXA2 and treated with glucagon showed increased _GCKR_ expression compared to control (Fig. [3b](/articles/s41598-018-34501-9#Fig3)). Treatment with a histone acetyl transferase (HAT) inhibitor II reduced _GCKR_ expression in FOXA2 transfected, glucagon treated cells, in agreement with a previous study showing that glucagon induces the activation of FOXA2 through acetylation[23](/articles/s41598-018-34501-9#ref-CR23 "von Meyenn, F. et al. Glucagon-induced acetylation of FOXA2 regulates hepatic lipid metabolism. Cell Metab. 17, 436–47,
              https://doi.org/10.1016/j.cmet.2013.01.014

             (2013).") (Supplementary Fig. [S3](/articles/s41598-018-34501-9#MOESM1)). Together these results suggest that FOXA2 mediates the effect of glucagon on _GCKR_ expression.
Figure 3
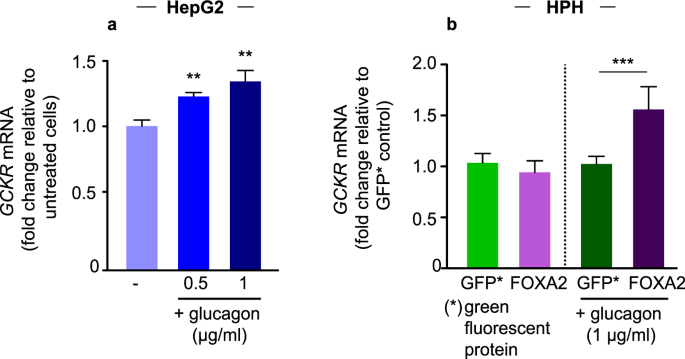
Effect of glucagon on GCKR expression in HepG2 and HPH cells. Total GCKR mRNA levels were determined using a GCKR Taqman Gene Expression Assay. (a) HPH cells were serum starved overnight and incubated for 2 h with trichostatin A (TSA; 5 _µ_M) and nicotinamide (Nam; 5 mM) before stimulation with glucagon for 2 h (0.5–1 _µ_g/ml). Error bars represent SD (**p < 0.01; one-way ANOVA; 4 technical replicates with cells from a single donor). (b) HepG2 cells were transfected with a plasmid expressing GFP (green fluorescent protein) or FOXA2 as indicated. Cells were treated with glucagon for 6 hours. The results are expressed as relative value to the control GFP. Error bars represent SD (***p < 0.001 one-way ANOVA).
Discussion
In the present study we first investigated the association of rs780094 of GCKR with lactate levels in the METSIM study cohort8,[24](/articles/s41598-018-34501-9#ref-CR24 "Laakso, M. et al. The Metabolic Syndrome in Men study: a resource for studies of metabolic and cardiovascular diseases. J Lipid Res. 58, 481–493, https://doi.org/10.1194/jlr.O072629
(2017)."). We found that the C allele of rs780094 was associated with decreased lactate levels in the fasting state, but increased lactate levels relative to fasting lactate at 90 and 120 min in an OGTT. Secondly, we showed that GCK amounts and lactate levels increased with increasing GKRP _in vitro_ in liver cells, and that the expression of _GCKR_ was induced by glucagon.Our finding that the C allele of rs780094 was associated with higher lactate levels relative to the fasting lactate suggests higher lactate formation upon hyperglycemia. This association was independent of insulin level, indicating that the differences in lactate formation between the carriers of C and T alleles were not explained by the effects of insulin. Our results suggest that decreased lactate levels in the carriers of the C allele in the fasting state indicate increased lactate uptake and higher rate of gluconeogenesis, whereas higher lactate levels upon hyperglycemia indicate higher rates of glycolysis[25](#ref-CR25 "Stefanovski, D. et al. Estimating hepatic glucokinase activity using a simple model of lactate kinetics. Diabetes Care 35, 1015–20, https://doi.org/10.2337/dc11-1540
             (2012)."),[26](#ref-CR26 "Agius, L. Comment on: Stefanovski et al. Estimating hepatic glucokinase activity using a simple model of lactate kinetics. Diabetes Care 35, 1015–20,
              https://doi.org/10.2337/dc12-0786

             (2012)."),[27](#ref-CR27 "Agius, L. Glucokinase and molecular aspects of liver glycogen metabolism. Biochem J. 414, 1–18,
              https://doi.org/10.1042/BJ20080595

             (2008)."),[28](/articles/s41598-018-34501-9#ref-CR28 "Agius, L. Hormonal and Metabolite Regulation of Hepatic Glucokinase. Annu Rev Nutr. 36, 389–415,
              https://doi.org/10.1146/annurev-nutr-071715-051145

             (2016).").
A previous study in GCKR knockout mice29 showed that lactate levels were similar in wild-type and mutant mice in the fasting and fed state. These results, compared to our findings, may be explained by a stronger GCK inhibitory capacity of human GKRP compared with murine GKRP[16](/articles/s41598-018-34501-9#ref-CR16 "Rees, M. G. et al. Cellular characterisation of the GCKR P446L variant associated with type 2 diabetes risk. Diabetologia. 55, 114–122, https://doi.org/10.1007/s00125-011-2348-5
             (2012)."),[30](/articles/s41598-018-34501-9#ref-CR30 "Brocklehurst, K. J., Davies, R. A. & Agius, L. Differences in regulatory properties between human and rat glucokinase regulatory protein. Biochem. J. 378, 693–697 (2004)."). Our results showed that GKRP interaction is crucial for the stabilization and protection of GCK, in agreement with previous studies[21](/articles/s41598-018-34501-9#ref-CR21 "Jin, L. et al. Role of glucokinase in the subcellular localization of glucokinase regulatory protein. Int J Mol Sci. 16, 7377–93,
              https://doi.org/10.3390/ijms16047377

             (2015)."),[29](/articles/s41598-018-34501-9#ref-CR29 "Farrelly, D. et al. Mice mutant for glucokinase regulatory protein exhibit decreased liver glucokinase: a sequestration mechanism in metabolic regulation. Proc Natl Acad Sci. 96, 14511–6 (1999)."),[31](/articles/s41598-018-34501-9#ref-CR31 "Slosberg, E. D. et al. Treatment of type 2 diabetes by adenoviral-mediated overexpression of the glucokinase regulatory protein. Diabetes 50, 1813–1820 (2001)."). Thus, increased _GCKR_/GKRP expression is expected to increase the formation of a nuclear pool of GKRP-bound GCK, resulting in the translocation of higher amounts of GCK to the cytoplasm at high glucose. Overall, our results suggest that increased lactate levels relative to fasting lactate in carriers of the C allele of rs780094 upon hyperglycemia may be explained by higher _GCKR_ expression. However, a limitation of our study is that cellular models using HepG2 cells may not reflect the complexity of hepatic lactate regulation in humans.
Our gene expression data in HPH and HepG2 cells demonstrated that glucagon induced GCKR expression via FOXA2. However, GCKR transcription is induced by insulin and high glucose, a condition equivalent to the fed state[22](/articles/s41598-018-34501-9#ref-CR22 "Arden, C. et al. Elevated glucose represses liver glucokinase and induces its regulatory protein to safeguard hepatic phosphate homeostasis. Diabetes 60, 3110–20, https://doi.org/10.2337/db11-0061
             (2011)."),[32](/articles/s41598-018-34501-9#ref-CR32 "Ma, L., Robinson, L. N. & Towle, H. C. ChREBP*Mlx is the principal mediator of glucose-induced gene expression in the liver. J. Biol. Chem. 281, 28721–28730 (2006)."). While the fed-induced expression of _GCKR_ prevents the intracellular accumulation of harmful glucose-6 phosphate and other phosphorylated products[22](/articles/s41598-018-34501-9#ref-CR22 "Arden, C. et al. Elevated glucose represses liver glucokinase and induces its regulatory protein to safeguard hepatic phosphate homeostasis. Diabetes 60, 3110–20,
              https://doi.org/10.2337/db11-0061

             (2011)."), _GCKR_ transcription and GKRP expression in the fasting state allows a maximum equilibration and recovery of GCK into the nucleus in conditions where glycolysis is replaced by gluconeogenesis. Thus, our results suggest that FOXA2-dependent mechanism controls _GCKR_ expression that may involve an allele-specific activation of rs780094 in the fasting state. Because our results were obtained in HepG2 cells, which are intrinsically mutagenic, and in HPH cells from a single donor, future studies using for example _in vivo_ animal models are needed to confirm the effect of fasting on _GCKR_ expression.
In addition to rs780094, another functional genetic variant rs1260326 of GCKR having a high LD with rs780094, encodes P446L that has a weak binding to GCK at low glucose levels[16](/articles/s41598-018-34501-9#ref-CR16 "Rees, M. G. et al. Cellular characterisation of the GCKR P446L variant associated with type 2 diabetes risk. Diabetologia. 55, 114–122, https://doi.org/10.1007/s00125-011-2348-5
             (2012)."). This may generate a cytoplasmic pool of free GCK that is suggested to induce elevated rate of glycolysis in the fasting state. Thus, our current results, together with our previous work[17](/articles/s41598-018-34501-9#ref-CR17 "López Rodríguez, M. et al. Identification and characterization of a FOXA2-regulated transcriptional enhancer at a type 2 diabetes intronic locus that controls GCKR expression in liver cells. Genome Med. 9(1), 63,
              https://doi.org/10.1186/s13073-017-0453-x

             (2017).") and the characterization of the P446L variant[16](/articles/s41598-018-34501-9#ref-CR16 "Rees, M. G. et al. Cellular characterisation of the GCKR P446L variant associated with type 2 diabetes risk. Diabetologia. 55, 114–122,
              https://doi.org/10.1007/s00125-011-2348-5

             (2012)."), allow us to propose a model for the combined effect of these two genetic variants on hepatic glucose metabolism (Fig. [4](/articles/s41598-018-34501-9#Fig4)). The CC haplotype, formed by rs780094 and rs1260326, favors the formation of a richer pool of GCK in the nucleus of the hepatocytes, attributable to higher _GCKR_ expression (rs780094-C) and stronger GKRP-GCK binding (rs1260326-C). The CC haplotype favors a higher translocation and activity of GCK in the cytoplasm, resulting in a higher rate of glycolysis and lactate formation (Fig. [4](/articles/s41598-018-34501-9#Fig4)). Since GCK inhibits gluconeogenesis[33](/articles/s41598-018-34501-9#ref-CR33 "Francini, F., Castro, M. C., Gagliardino, J. J. & Massa, M. L. Regulation of liver glucokinase activity in rats with fructose-induced insulin resistance and impaired glucose and lipid metabolism. Can J Physiol Pharmacol. 87, 702–10,
              https://doi.org/10.1139/y09-064

             (2009)."), its efficient nuclear sequestration during fasting favors a higher rate of gluconeogenesis and increased lactate uptake, which results in reduced circulating lactate and increased glucose levels. Our results are in agreement with the notion that targeted molecular inhibition of GKRP could be a promising option in the treatment of type 2 diabetes[34](/articles/s41598-018-34501-9#ref-CR34 "Raimondo, A., Rees, M. G. & Gloyn, A. L. Glucokinase regulatory protein: complexity at the crossroads of triglyceride and glucose metabolism. Curr Opin Lipidol. 26, 88–95,
              https://doi.org/10.1097/MOL.0000000000000155

             (2015)."). Blocking GKRP by GCK-GKRP disruptors promotes GCK cytosolic translocation, and produces antidiabetic effects in rodent models of diabetes[35](/articles/s41598-018-34501-9#ref-CR35 "Lloyd, D. J. et al. Antidiabetic effects of glucokinase regulatory protein small-molecule disruptors. Nature 504, 437–40,
              https://doi.org/10.1038/nature12724

             (2013).").
Figure 4
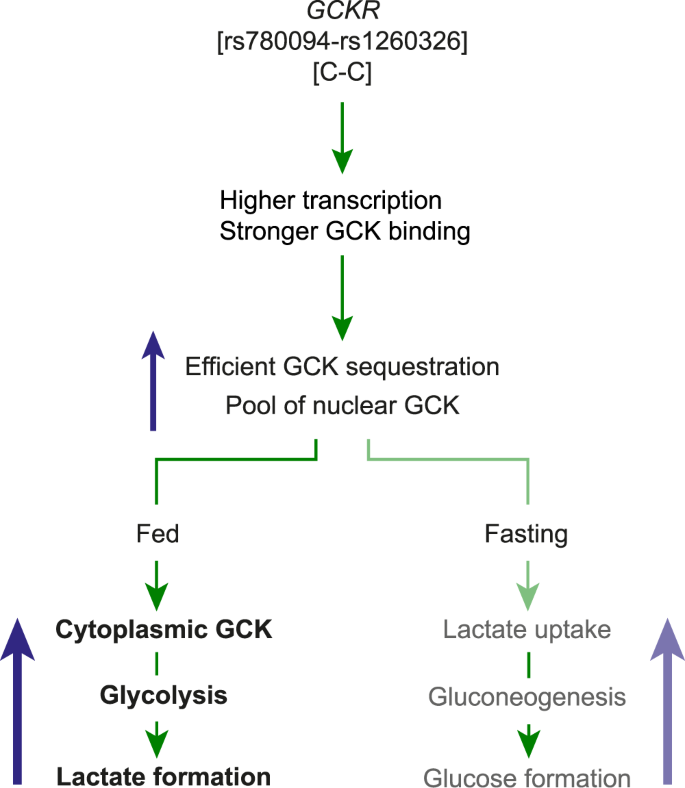
Proposed model for the effects of the C allele of rs780094 on glucose and lactate metabolism in the liver. The characterization of the functional variants of rs780094 and rs1260326 of GCKR suggest that the CC haplotype results in more GCKR and stronger GKRP-GCK binding, favoring the formation of a richer nuclear pool of the enzyme in the fasting state. Consequently, during hyperglycemia, a richer pool of nuclear GCK would favor more efficient translocation and higher amounts of GCK in the cytoplasm, inducing a higher rate of glycolysis and lactate secretion. In the fasting state, the inhibitory effect of GCK on gluconeogenesis suggests that a more efficient nuclear sequestration of GCK may result in a higher rate of gluconeogenesis from precursors such as lactate, which would increase lactate uptake and glucose formation by the liver.
The strength of our study is that we investigated the associations of lactate levels with GCKR variants in an oral glucose tolerance test having multiple measurement points. The limitation of our study is that our subsample of the METSIM cohort is of a moderate size, and included only middle-aged and elderly Finnish men, and therefore we cannot ensure the applicability of our results to women or other populations. Another limitation is that HepG2 cell line shows altered metabolic activity compared to primary hepatocytes, and therefore may not reflect the complexity of hepatic lactate regulation in humans.
In conclusion, our study showed that compared to the carriers of the T allele, the carriers of the C allele of rs780094 of GCKR had lower lactate levels in the fasting state but higher lactate increment relative to fasting lactate during hyperglycemia in humans. These results are consistent with a higher hepatic lactate uptake in the fasting state and increased rate of hepatic glycolysis in the fed state. Our findings based on cellular models suggest that increased GCKR expression in the fasting state, when accompanied by increased GKRP levels, results in increased rate of hepatic glycolysis in the fed state, as reflected by increased lactate levels.
Methods
METSIM study population
The Metabolic Syndrome in Men (METSIM) study is a population-based study including 10,197 Finnish men examined in 2005–20108,[24](/articles/s41598-018-34501-9#ref-CR24 "Laakso, M. et al. The Metabolic Syndrome in Men study: a resource for studies of metabolic and cardiovascular diseases. J Lipid Res. 58, 481–493, https://doi.org/10.1194/jlr.O072629
             (2017)."). A total of 1,288 consecutively selected non-diabetic men participating in the METSIM follow-up study were included in the present study. The participants did not differ according to the genotypes of rs780094 with respect to age, BMI or waist (Table [1](/articles/s41598-018-34501-9#Tab1)). The genotyping of rs780094 of _GCKR_ was performed using TaqMan Allelic Discrimination Assay at the University of Eastern Finland, as previously described[5](/articles/s41598-018-34501-9#ref-CR5 "Stancáková, A. et al. Hyperglycemia and a common variant of GCKR are associated with the levels of eight amino acids in 9,369 Finnish men. Diabetes 61, 1895–902,
              https://doi.org/10.2337/db11-1378

             (2012).").
Oral glucose tolerance test and metabolic measurements
An OGTT (75 g glucose) including seven time-points (0, 15, 30, 45, 60, 90 and 120 min) was performed. We calculated a relative increase in lactate levels compared to the fasting lactate. Plasma glucose was measured by enzymatic hexokinase photometric assay (Konelab Systems Reagents, Thermo Fischer Scientific). Insulin was determined using an immunoassay (ADVIA Centaur Insulin IRI, no 02230141, Siemens Medical Solutions Diagnostics), and plasma lactate levels using an enzymatic colorimetric test (Thermo Fischer Scientific).
Cell culture
HepG2 cells (ATCC, HB-8065) were cultured in Dulbecco’s modified Eagle medium (DMEM; 4.5 g/L glucose, 2 mM L-glutamine, 100 U/ml penicillin, 100 μg/ml streptomycin; LONZA) supplemented with 10% fetal bovine serum (FBS; GIBCO). Cells were seeded at 0.2–0.3 × 10⁶ cells/ml. Cryopreserved HPH cells from a single non-diabetic donor were purchased from Biopredic International and cultured on collagen I coated 24-well plates at 0.8 × 10⁶ cells/ml following the recommended protocol36,37. Both HepG2 and HPH cells were incubated on 24 well plates at 37 °C in 5% CO2 in a humidified incubator overnight before further manipulations.
Lactate assay in HepG2 and HPH cells
HepG2 cells were cotransfected with plasmids expressing human GCK (SC127236, Origene) and GKRP (SC119244, Origene) or GCK and the control vector pCMV6-XL4 (Origene) in 1:0, 1:1 and 1:3 plasmid molar ratios (GCK to GCKR; GCK to pCMV6-XL4). All transfections were carried out with Lipofectamine 3000 according to manufacturer’s instructions (Thermo Fisher Scientific). Transfection conditions have been previously optimized in our laboratory. In all cases, we transfected 500 ng of DNA with 0.75 µl of Lipofectamine 3000 reagent per well. Forty-eight hours after transfection the cells were serum starved overnight in low glucose DMEM (1 g/L glucose, 2 mM L-glutamine, 100 U/ml penicillin, 100 μg/ml streptomycin) followed by stimulation with glucose at the indicated concentrations in DMEM (supplemented only with 2 mM L-glutamine). The medium was collected three hours after stimulation for lactate measurement, which was carried out with a colorimetric L-lactate assay according to the manufacturer´s instructions (ab65331, Abcam). The absorbance was measured in a microplate reader at OD 450 nm. Three independent experiments were performed using different cell and DNA preparations. Three to four technical replicates were used for each treatment within each experiment.
HPH cells were transfected with the control vector, or the vectors expressing GCK or GKRP using Tergefect-Hepatocyte transfection kit (Tergeting Systems) according to manufacturer’s instructions. The cells expressed the constructs for 72 hours before conducting the stimulation with glucose and lactate assay as described for HepG2 cells. Three technical replicates per treatment were used.
Protein immunodetection by Western-blot
HepG2 cells were washed twice with ice cold Phosphate Buffered Saline (PBS) and lysed with radioimmunoprecipitation assay buffer (RIPA; Thermo Fisher Scientific) supplemented with protease inhibitor and phosphatase inhibitor cocktails (Roche). The concentration of proteins was measured with BCA protein assay (Pierce) and 10–15 ug of protein per sample was used in the assay. Samples were prepared with NuPage LDS sample buffer (Life Technologies) and loaded into 4–12% NuPAGE Bis-Tris gels (Life Technologies) for gel electrophoresis. We used the Dual-Color Precision Plus Protein Standards as molecular weight marker (Biorad). Gel-immobilized proteins were then transferred to polyvinylidene fluoride (PVDF) membranes (GE Healthcare) for immunodetection. A mouse monoclonal antibody (RRID:AB_2107650; sc74552, Santa Cruz) and a rabbit polyclonal antibody (RRID:AB_2232078; ab 37796, Abcam) were used for GKRP and GCK detection, respectively. ß-actin was used as loading control and it was detected with a goat polyclonal antibody (RRID:AB_630836; sc1616-R, Santa Cruz). Anti-mouse (NA931V, GE Health care), anti-rabbit (NA934V, GE Health Care) and anti-goat (sc-2020, Santa Cruz) HRP-conjugated IgGs were used accordingly for the detection of the bands by chemiluminiscence (ECL Plus, Pierce). For image acquisition, an Image Quant RT-ECL equipment (GE Healthcare) was used. Band quantitation was carried out with the Gels tool from ImageJ. The list of the antibodies used in this study can be found in Supplementary Table S3.
Stimulation of HepG2 and HPH cells with glucagon
HepG2 cells were transfected with a plasmid expressing a green fluorescence protein (GFP; PS100040, Origene) or a plasmid expressing human FOXA2 (SC122913, Origene) with Lipofectamine 3000 (Thermo Fisher Scientific) as described above. GFP was used as over-expression control. All constructs were expressed for 48 h before overnight serum starvation. Next, the medium was changed to low glucose serum-free DMEM supplemented with 2 mM L-glutamine and 1 _µ_g/ml of glucagon and incubated in cell culture conditions for 6 h. Since glucagon induces FOXA2 activation through acetylation, we used a HAT inhibitor II (abcam) as a control treatment for 2 h. For stimulation of HPH, we adapted a protocol previously reported to evaluate the effect of glucagon on FOXA2 activation[23](/articles/s41598-018-34501-9#ref-CR23 "von Meyenn, F. et al. Glucagon-induced acetylation of FOXA2 regulates hepatic lipid metabolism. Cell Metab. 17, 436–47, https://doi.org/10.1016/j.cmet.2013.01.014
(2013)."). Briefly, cells were incubated in serum and antibiotics free medium overnight, followed by incubation with the histone deacetylase inhibitors trichostatin A (TSA; 5 µM) and nicotinamide (Nam; 5 mM) for 2 h. Glucagon (0.5 or 1 _µ_g/ml) was added to the medium for 2 h.RNA isolation, cDNA preparation and GCKR mRNA expression
After glucagon stimulation, both HepG2 and HPH cells were subject to total RNA extraction with an RNeasy Mini Kit (Qiagen). The cDNA was prepared with a High Capacity cDNA Reverse Transcription Kit (Applied Biosystems) using random hexamer primers according to manufacturer´s instructions. GCKR mRNA and RPLP0 mRNA (housekeeping gene; MIM 180510) expression were measured with specific TaqMan gene expression assays (Thermo Fisher Scientific) in a 7500 Real-Time PCR System (Applied Biosystems). The relative gene expression was calculated using the _dd_Ct-quantification method.
Statistical analysis
Statistical analyses were performed using the SPSS version 25 (IBM). All variables were log-transformed except for age to correct for their skewed distribution. ANOVA was used to compare the three genotype groups, and t test for independent samples to compare the two groups. Statistical analyses applied in cellular experiments are described in the corresponding figure legend. p < 0.05 indicates statistical significance.
Data Availability
All datasets generated during the current study can be found within the manuscript or the Supplementary Information. Other datasets are available from the corresponding author on request.
References
- Fuchsberger, C. et al. The genetic architecture of type 2 diabetes. Nature 536, 41–7, https://doi.org/10.1038/nature18642 (2016).
Article ADS CAS PubMed PubMed Central Google Scholar - Van Schaftingen, E., Detheux, M. & Veiga da Cunha, M. Short-term control of glucokinase activity: role of a regulatory protein. FASEB J. 8, 414–9 (1994).
Article PubMed Google Scholar - Orho-Melander, M. et al. Common missense variant in the glucokinase regulatory protein gene is associated with increased plasma triglyceride and C-reactive protein but lower fasting glucose concentrations. Diabetes 57, 3112–21, https://doi.org/10.2337/db08-0516 (2008).
Article CAS PubMed PubMed Central Google Scholar - Dupuis, J. et al. New genetic loci implicated in fasting glucose homeostasis and their impact on type 2 diabetes risk. Nature Genet. 42, 105–116, https://doi.org/10.1038/ng.520 (2010).
Article CAS PubMed Google Scholar - Stancáková, A. et al. Hyperglycemia and a common variant of GCKR are associated with the levels of eight amino acids in 9,369 Finnish men. Diabetes 61, 1895–902, https://doi.org/10.2337/db11-1378 (2012).
Article CAS PubMed PubMed Central Google Scholar - Tin, A. et al. GCKR and PPP1R3B identified as genome-wide significant loci for plasma lactate: the Atherosclerosis Risk in Communities (ARIC) study. Diabet Med. 33, 968–75, https://doi.org/10.1111/dme.12971 (2016).
Article CAS PubMed Google Scholar - Aulchenko, Y. S. et al. Loci influencing lipid levels and coronary heart disease risk in 16 European population cohorts. Nat Genet. 41, 47–55, https://doi.org/10.1038/ng.269 (2009).
Article CAS PubMed Google Scholar - Stančáková, A. et al. Effects of 34 risk loci for type 2 diabetes or hyperglycemia on lipoprotein subclasses and their composition in 6,580 nondiabetic Finnish men. Diabetes 60 1608–16 10.2 (2011).
Article CAS PubMed PubMed Central Google Scholar - Mahendran, Y. et al. Association of ketone body levels with hyperglycemia and type 2 diabetes in 9,398 Finnish men. Diabetes 62, 3618–26, https://doi.org/10.2337/db12-1363 (2013).
Article CAS PubMed PubMed Central Google Scholar - Santoro, N. et al. Hepatic De Novo Lipogenesis in Obese Youth Is Modulated by a Common Variant in the GCKR Gene. J. Clin. Endocrinol. Metab. 100, E1125–32, https://doi.org/10.1210/jc.2015-1587 (2015).
Article CAS PubMed PubMed Central Google Scholar - Petta, S. et al. Glucokinase regulatory protein gene polymorphism affects liver fibrosis in non-alcoholic fatty liver disease. PLoS One, 9, e87523, https://doi.org/10.1371/journal.pone.0087523 (2014).
Article ADS CAS Google Scholar - Brouwers, M. C., Jacobs, C., Bast, A., Stehouwer, C. D. & Schaper, N. C. Modulation of Glucokinase Regulatory Protein: A Double-Edged Sword? Trends Mol Med. 21, 583–94, https://doi.org/10.1016/j.molmed.2015.08.004 (2015).
Article CAS PubMed Google Scholar - Santoro, N. et al. Variant in the glucokinase regulatory protein (GCKR) gene is associated with fatty liver in obese children and adolescents. Hepatology 55, 781–9, https://doi.org/10.1002/hep.24806 (2012).
Article CAS PubMed Google Scholar - Eslam, M., Valenti, L. & Romeo, S. Genetics and epigenetics of NAFLD and NASH: Clinical impact. J Hepatol. 68, 268–279, https://doi.org/10.1016/j.jhep.2017.09.003 (2018).
Article CAS PubMed Google Scholar - Beer, N. L. et al. The P446L variant in GCKR associated with fasting plasma glucose and triglyceride levels exerts its effect through increased glucokinase activity in liver. Hum Mol Genet. 18, 4081–8, https://doi.org/10.1093/hmg/ddp357 (2009).
Article CAS PubMed PubMed Central Google Scholar - Rees, M. G. et al. Cellular characterisation of the GCKR P446L variant associated with type 2 diabetes risk. Diabetologia. 55, 114–122, https://doi.org/10.1007/s00125-011-2348-5 (2012).
Article CAS PubMed Google Scholar - López Rodríguez, M. et al. Identification and characterization of a FOXA2-regulated transcriptional enhancer at a type 2 diabetes intronic locus that controls GCKR expression in liver cells. Genome Med. 9(1), 63, https://doi.org/10.1186/s13073-017-0453-x (2017).
Article PubMed PubMed Central Google Scholar - Adeva-Andany, M. et al. Comprehensive review on lactate metabolism in human health. Mitochondrion 17, 76–100, https://doi.org/10.1016/j.mito.2014.05.007 (2014).
Article CAS PubMed Google Scholar - Ferguson, B. S. et al. Lactate metabolism: historical context, prior misinterpretations, and current understanding. Eur J Appl Physiol. 118, 691–728, https://doi.org/10.1007/s00421-017-3795-6 (2018).
Article CAS PubMed Google Scholar - Suhre, K. et al. Human metabolic individuality in biomedical and pharmaceutical research. Nature 477, 54–60, https://doi.org/10.1038/nature10354 (2011).
Article ADS CAS PubMed Google Scholar - Jin, L. et al. Role of glucokinase in the subcellular localization of glucokinase regulatory protein. Int J Mol Sci. 16, 7377–93, https://doi.org/10.3390/ijms16047377 (2015).
Article CAS PubMed PubMed Central Google Scholar - Arden, C. et al. Elevated glucose represses liver glucokinase and induces its regulatory protein to safeguard hepatic phosphate homeostasis. Diabetes 60, 3110–20, https://doi.org/10.2337/db11-0061 (2011).
Article CAS PubMed PubMed Central Google Scholar - von Meyenn, F. et al. Glucagon-induced acetylation of FOXA2 regulates hepatic lipid metabolism. Cell Metab. 17, 436–47, https://doi.org/10.1016/j.cmet.2013.01.014 (2013).
Article CAS Google Scholar - Laakso, M. et al. The Metabolic Syndrome in Men study: a resource for studies of metabolic and cardiovascular diseases. J Lipid Res. 58, 481–493, https://doi.org/10.1194/jlr.O072629 (2017).
Article CAS PubMed PubMed Central Google Scholar - Stefanovski, D. et al. Estimating hepatic glucokinase activity using a simple model of lactate kinetics. Diabetes Care 35, 1015–20, https://doi.org/10.2337/dc11-1540 (2012).
Article CAS PubMed PubMed Central Google Scholar - Agius, L. Comment on: Stefanovski et al. Estimating hepatic glucokinase activity using a simple model of lactate kinetics. Diabetes Care 35, 1015–20, https://doi.org/10.2337/dc12-0786 (2012).
Article CAS Google Scholar - Agius, L. Glucokinase and molecular aspects of liver glycogen metabolism. Biochem J. 414, 1–18, https://doi.org/10.1042/BJ20080595 (2008).
Article CAS PubMed Google Scholar - Agius, L. Hormonal and Metabolite Regulation of Hepatic Glucokinase. Annu Rev Nutr. 36, 389–415, https://doi.org/10.1146/annurev-nutr-071715-051145 (2016).
Article CAS PubMed Google Scholar - Farrelly, D. et al. Mice mutant for glucokinase regulatory protein exhibit decreased liver glucokinase: a sequestration mechanism in metabolic regulation. Proc Natl Acad Sci. 96, 14511–6 (1999).
Article ADS CAS PubMed PubMed Central Google Scholar - Brocklehurst, K. J., Davies, R. A. & Agius, L. Differences in regulatory properties between human and rat glucokinase regulatory protein. Biochem. J. 378, 693–697 (2004).
Article CAS PubMed PubMed Central Google Scholar - Slosberg, E. D. et al. Treatment of type 2 diabetes by adenoviral-mediated overexpression of the glucokinase regulatory protein. Diabetes 50, 1813–1820 (2001).
Article CAS PubMed Google Scholar - Ma, L., Robinson, L. N. & Towle, H. C. ChREBP*Mlx is the principal mediator of glucose-induced gene expression in the liver. J. Biol. Chem. 281, 28721–28730 (2006).
Article CAS PubMed Google Scholar - Francini, F., Castro, M. C., Gagliardino, J. J. & Massa, M. L. Regulation of liver glucokinase activity in rats with fructose-induced insulin resistance and impaired glucose and lipid metabolism. Can J Physiol Pharmacol. 87, 702–10, https://doi.org/10.1139/y09-064 (2009).
Article CAS PubMed Google Scholar - Raimondo, A., Rees, M. G. & Gloyn, A. L. Glucokinase regulatory protein: complexity at the crossroads of triglyceride and glucose metabolism. Curr Opin Lipidol. 26, 88–95, https://doi.org/10.1097/MOL.0000000000000155 (2015).
Article CAS PubMed PubMed Central Google Scholar - Lloyd, D. J. et al. Antidiabetic effects of glucokinase regulatory protein small-molecule disruptors. Nature 504, 437–40, https://doi.org/10.1038/nature12724 (2013).
Article ADS CAS PubMed Google Scholar - Guguen-Guillouzo, C., Guillouzo, A. Methods for preparation of adult and fetal hepatocytes. Isolated and Cultured Hepatocytes, (ed. A. Guillouzo, C Guguen-Guillouzo) 1-12 (Paris and London: Les Editions INSERM and John Libbey Eurotext, 198RO8).
- Chesné, C. et al. Viability and function in primary culture of adult hepatocytes from various animal species and human beings after cryopreservation. Hepatology 18, 406–14 (1993).
PubMed Google Scholar
Acknowledgements
This work was supported by grants from the Academy of Finland (287478 (M.U.K.); 294073 (M.U.K.); 321428 (M.L.); the Finnish Foundation for Cardiovascular Research (M.U.K.), Jane and Aatos Erkko Foundation (M.U.K.), the Diabetes Research Foundation (M.U.K.), Juselius Foundation (M.L.); Kuopio University Hospital VTR grant (M.L.); and Centre of Excellence of Cardiovascular and Metabolic Diseases supported by the Academy of Finland (M.L.). The authors thank Nihay Laham-Karam for critical discussion of the results; and Maria Fizelova for assistance and advice in statistical methods.
Author information
Authors and Affiliations
- Institute of Clinical Medicine, Internal Medicine, University of Eastern Finland, Kuopio, Finland
Maykel López Rodríguez, Lilian Fernandes Silva, Jagadish Vangipurapu, Shalem Modi, Johanna Kuusisto & Markku Laakso - Department of Medicine, Kuopio University Hospital, P.O. Box 100 FI 70029 KYS, Kuopio, Finland
Johanna Kuusisto & Markku Laakso - A.I. Virtanen Institute for Molecular Sciences, Department of Biotechnology and Molecular Medicine, University of Eastern Finland, Kuopio, Finland
Minna U. Kaikkonen
Authors
- Maykel López Rodríguez
- Lilian Fernandes Silva
- Jagadish Vangipurapu
- Shalem Modi
- Johanna Kuusisto
- Minna U. Kaikkonen
- Markku Laakso
Contributions
M.L.R. and M.L. designed the study. M.L. and J.K. were responsible for the human data collection. J.V. and M.L.R. performed the statistical analysis. M.L.R., L.F.S. and S.M. performed the cellular experiments and analyzed the data. M.U.K. contributed to the conception of the cellular experiments and revised the manuscript. M.L.R. and M.L. wrote the manuscript. All authors approved the final manuscript. M.L. is the guarantor of this work and, as such, had full access to all the data in the study and takes responsibility for the integrity of the data and accuracy of the data analysis.
Corresponding author
Correspondence toMarkku Laakso.
Ethics declarations
Competing Interests
The authors declare no competing interests.
Additional information
Publisher’s note: Springer Nature remains neutral with regard to jurisdictional claims in published maps and institutional affiliations.
Electronic supplementary material
Rights and permissions
Open Access This article is licensed under a Creative Commons Attribution 4.0 International License, which permits use, sharing, adaptation, distribution and reproduction in any medium or format, as long as you give appropriate credit to the original author(s) and the source, provide a link to the Creative Commons license, and indicate if changes were made. The images or other third party material in this article are included in the article’s Creative Commons license, unless indicated otherwise in a credit line to the material. If material is not included in the article’s Creative Commons license and your intended use is not permitted by statutory regulation or exceeds the permitted use, you will need to obtain permission directly from the copyright holder. To view a copy of this license, visit http://creativecommons.org/licenses/by/4.0/.
About this article
Cite this article
López Rodríguez, M., Fernandes Silva, L., Vangipurapu, J. et al. Functional Variant in the GCKR Gene Affects Lactate Levels Differentially in the Fasting State and During Hyperglycemia.Sci Rep 8, 15989 (2018). https://doi.org/10.1038/s41598-018-34501-9
- Received: 23 April 2018
- Accepted: 06 October 2018
- Published: 30 October 2018
- Version of record: 30 October 2018
- DOI: https://doi.org/10.1038/s41598-018-34501-9