Comparison of MRI and CT based deep learning radiomics analyses and their combination for diagnosing intrahepatic cholangiocarcinoma (original) (raw)
Introduction
Primary liver cancer (PLC) holds the third position in globally cancer-related mortality[1](/articles/s41598-025-92263-7#ref-CR1 "Sung, H. et al. Global Cancer statistics 2020: GLOBOCAN estimates of incidence and mortality worldwide for 36 cancers in 185 countries. CA Cancer J. Clin. 71, 209–249. https://doi.org/10.3322/caac.21660
             (2021)."). Hepatocellular carcinoma (HCC) and combined hepatocellular-cholangiocarcinoma (cHCC-iCCA) represent the most prevalent and rarest subtypes of PLC, respectively. Intrahepatic cholangiocarcinoma (iCCA) emerges as a relatively rare neoplasm, comprising approximately 10–15% of all PLC cases[2](/articles/s41598-025-92263-7#ref-CR2 "Sarcognato, S. et al. Cholangiocarcinoma Pathologica 113, 158–169, doi:
              https://doi.org/10.32074/1591-951x-252

             (2021)."). Its occurrence is intricately linked to bile stagnation, chronic ductal inflammation, and other provocative agents. When lesions were detected through imaging examinations, patients were frequently found to be in the advanced stages of the disease, exhibiting either local invasion or distant metastasis[3](/articles/s41598-025-92263-7#ref-CR3 "Ilyas, S. I. & Gores, G. J. Pathogenesis, diagnosis, and management of cholangiocarcinoma. Gastroenterology 145, 1215–1229.
              https://doi.org/10.1053/j.gastro.2013.10.013

             (2013)."). Radical surgical resection is still considered the foremost therapeutic modality for PLC, but the postoperative recurrence rate of iCCA patients was 59.6–73.4%[4](/articles/s41598-025-92263-7#ref-CR4 "Zhang, X. F. et al. Early versus late recurrence of intrahepatic cholangiocarcinoma after resection with curative intent. Br. J. Surg. 105, 848–856.
              https://doi.org/10.1002/bjs.10676

             (2018)."),[5](/articles/s41598-025-92263-7#ref-CR5 "Tsilimigras, D. I. et al. Recurrent intrahepatic cholangiocarcinoma: A 10-Point score to predict Post-Recurrence survival and guide treatment of recurrence. Ann. Surg. Oncol. 31, 4427–4435.
              https://doi.org/10.1245/s10434-024-15210-2

             (2024)."). Post-resection survival outcomes for iCCA patients are inferior to those of HCC and comparable to those of cHCC-iCCA[6](/articles/s41598-025-92263-7#ref-CR6 "Lin, C. W. et al. Clinical features and outcomes of combined hepatocellular carcinoma and cholangiocarcinoma versus hepatocellular carcinoma versus cholangiocarcinoma after surgical resection: a propensity score matching analysis. BMC Gastroenterol. 21, 20.
              https://doi.org/10.1186/s12876-020-01586-4

             (2021)."). Given the dismal prognosis, it is vital to diagnose iCCA within PLC in order to choose the appropriate therapeutic strategies.
Despite being the gold standard, biopsy necessitates an invasive surgical operation for tissue acquisition, followed by subjective human assessment, highlighting the need for alternative non-invasive methods[7](/articles/s41598-025-92263-7#ref-CR7 "Lim, T. S. & Kim, J. K. Is liver biopsy still useful in the era of non-invasive tests? Clin. Mol. Hepatol. 26, 302–304. https://doi.org/10.3350/cmh.2020.0081
             (2020)."). Recently researches have shown that the application of deep learning (DL) technology, relying on CT and MRI imaging, has been determined to be beneficial in the diagnostic process and prognostic evaluation of iCCA[8](#ref-CR8 "Ding, G. Y. et al. Mining the interpretable prognostic features from pathological image of intrahepatic cholangiocarcinoma using multi-modal deep learning. BMC Med. 22, 282.
              https://doi.org/10.1186/s12916-024-03482-0

             (2024)."),[9](#ref-CR9 "Song, Y. et al. Artificial intelligence CT radiomics to predict early recurrence of intrahepatic cholangiocarcinoma: a multicenter study. Hepatol. Int. 17, 1016–1027.
              https://doi.org/10.1007/s12072-023-10487-z

             (2023)."),[10](/articles/s41598-025-92263-7#ref-CR10 "Yang, C. M. & Shu, J. Cholangiocarcinoma evaluation via imaging and artificial intelligence. Oncology 99, 72–83.
              https://doi.org/10.1159/000507449

             (2021)."). Overall, previous studies generally regard MRI as being more effective than CT in visualizing the morphological features of iCCA[11](/articles/s41598-025-92263-7#ref-CR11 "Saleh, M. et al. Intrahepatic cholangiocarcinoma: pathogenesis, current staging, and radiological findings. Abdom. Radiol. (NY). 45, 3662–3680.
              https://doi.org/10.1007/s00261-020-02559-7

             (2020)."),[12](/articles/s41598-025-92263-7#ref-CR12 "Kim, Y. Y. et al. Clinical staging of Mass-Forming intrahepatic cholangiocarcinoma: computed tomography versus magnetic resonance imaging. Hepatol. Commun. 5, 2009–2018.
              https://doi.org/10.1002/hep4.1774

             (2021)."). Especially, the diagnostic accuracy for individuals with iCCA is improved by the combined utilization of dynamic contrast-enhanced MRI (DCE-MRI) and a specialized T2-weighted cholangiography sequence[13](/articles/s41598-025-92263-7#ref-CR13 "Jhaveri, K. S. & Hosseini-Nik, H. MRI of cholangiocarcinoma. J. Magn. Reson. Imaging. 42, 1165–1179.
              https://doi.org/10.1002/jmri.24810

             (2015)."). DCE-MRI DL features have displayed considerable utility in predicting iCCA grade[14](/articles/s41598-025-92263-7#ref-CR14 "Wang, S., Wang, X., Yin, X., Lv, X. & Cai, J. Differentiating HCC from ICC and prediction of ICC grade based on MRI deep-radiomics: using lesions and their extended regions. Phys. Med. 120, 103322.
              https://doi.org/10.1016/j.ejmp.2024.103322

             (2024)."). Additionally, diffusion-weighted imaging (DWI), as a functional MRI sequence, has potential to enhance the detection sensitivity of tumor extent and liver metastases[15](/articles/s41598-025-92263-7#ref-CR15 "Ejaz, A., Cloyd, J. M. & Pawlik, T. M. Advances in the diagnosis and treatment of patients with intrahepatic cholangiocarcinoma. Ann. Surg. Oncol. 27, 552–560.
              https://doi.org/10.1245/s10434-019-07873-z

             (2020)."). Chen et al. developed a DWI-based DL model to predict microvascular invasion in iCCA preoperatively[16](/articles/s41598-025-92263-7#ref-CR16 "Gao, W. et al. A multiparametric fusion deep learning model based on DCE-MRI for preoperative prediction of microvascular invasion in intrahepatic cholangiocarcinoma. J. Magn. Reson. Imaging. 56, 1029–1039.
              https://doi.org/10.1002/jmri.28126

             (2022)."). Notably, CT is an integral component in the clinical management of iCCA. It can provide an intuitive visualization of iCCA associated with hepatolithiasis and offer an accurate assessment of iCCA resectability[17](/articles/s41598-025-92263-7#ref-CR17 "Weber, S. M. et al. Intrahepatic cholangiocarcinoma: expert consensus statement. HPB (Oxford). 17, 669–680.
              https://doi.org/10.1111/hpb.12441

             (2015)."). Jiang et al. demonstrated the effectiveness of CT-based DL model in predicting early postoperative recurrence for iCCA[18](/articles/s41598-025-92263-7#ref-CR18 "Wakiya, T. et al. CT-based deep learning enables early postoperative recurrence prediction for intrahepatic cholangiocarcinoma. Sci. Rep. 12, 8428.
              https://doi.org/10.1038/s41598-022-12604-8

             (2022).").
In the management of iCCA, CT and MRI are crucial imaging modalities. Consequently, we hypothesize that the integration of CT- and MRI-based DL radiomics can more thoroughly characterize tumor heterogeneity. Thus, the purpose of this research was to assess the predictive capacity of the DL radiomics features from CT and MRI, correlating them with radiological features to enhance the accuracy of iCCA diagnosis.
Materials and methods
Patients
This study was approved by the Medical Ethics Committee of the First Affiliated Hospital of Zhengzhou University and the Medical Ethics Committee of the First Affiliated Hospital of Zhengzhou University waived the requirement of informed consent due to its retrospective design (2022-KY-0752-001). All procedures performed in this study comply with the Declaration of Helsinki (revised in 2013).
We performed a retrospective analysis of 178 patients with PLC, confirmed through histopathological examination, who were treated at the First Affiliated Hospital of Zhengzhou University between January 2016 and October 2023. The exclusion criteria: (1) lack of enhanced CT or MRI before histopathological examination; (2) history of local or systematic treatment before imaging examination; (3) deficient of clinical data; (4) poor image quality. PLC patients who underwent both CT and MRI scans before histopathological examination were enrolled in our research. Fig. 1. depicted the selection process. Consequently, we enrolled 137 patients undergoing resection (iCCA = 25; non-iCCA = 112) and 41 patients undergoing biopsy (iCCA = 14; non-iCCA = 27). The recorded clinical data included age, sex, history of hepatitis B virus (HBV) infection, and laboratory parameters of each patient. A flowchart of the research design is displayed in Fig. 2.
Fig. 1
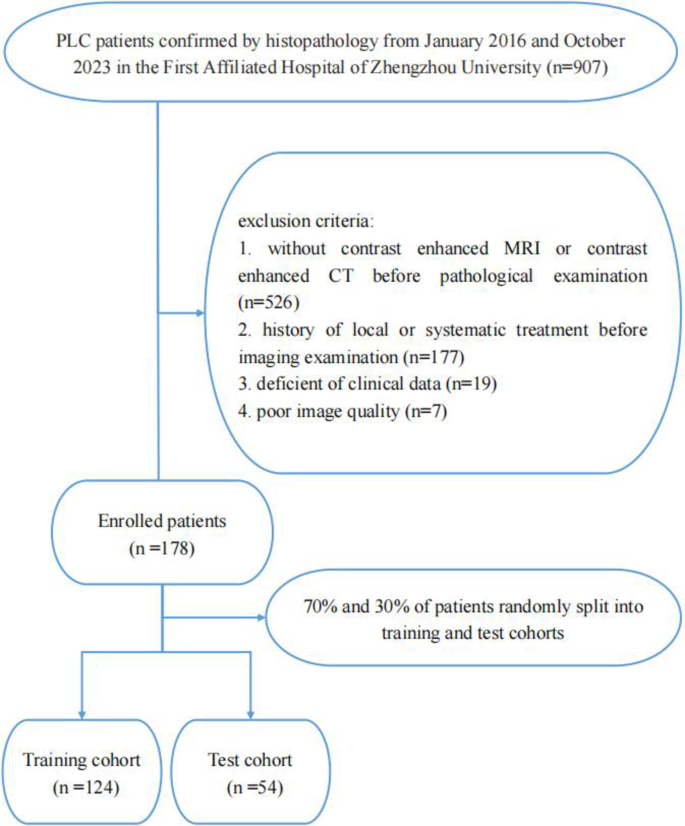
Flowchart shows patient recruitment and study design.
Fig. 2
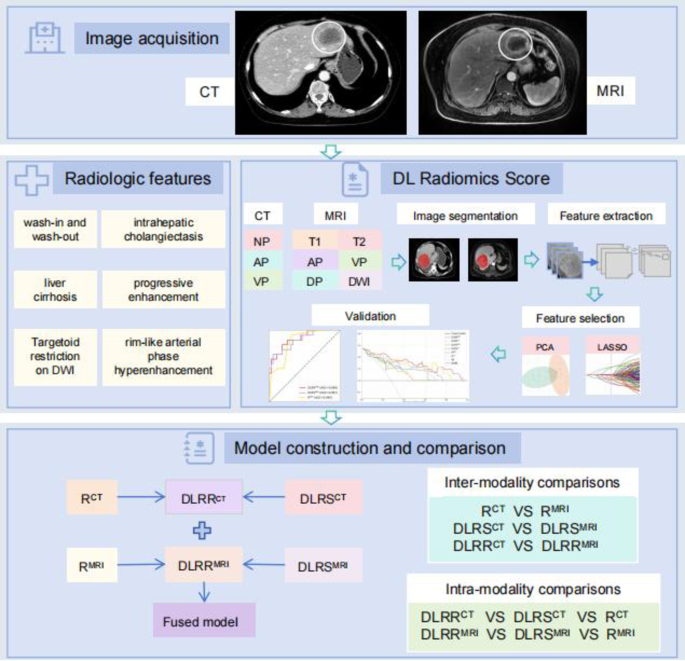
Diagram shows steps involved in feature extraction, feature selection and model construction. NP non-contrast phase; AP arterial phase; VP venous phase; T1 T1-weighted imaging; T2 T2-weighted imaging; DWI diffusion-weighted imaging; PCA principal component analysis; LASSO least absolute shrinkage and selection operator; DLRS CT CT DL radiomics score; R CT CT radiological model; DLRR CT CT DL radiomics-radiological model; DLRS MRI MRI DL radiomics score; R MR MRI radiological model; DLRR MRI MRI DL radiomics-radiological model.
Imaging processing and characteristics analysis
The detailed protocol of CT and MRI scan were outlined in the Supplementary.
Two radiologists performed retrospective interpretation of image characteristics on CT and MR imaging in the picture archiving and communication (PACS) system, both of whom were blinded to pathological results and clinical factors. The following findings[19](#ref-CR19 "Xu, Y. et al. Association between MRI radiomics and intratumoral tertiary lymphoid structures in intrahepatic cholangiocarcinoma and its prognostic significance. J. Magn. Reson. Imaging. 60, 715–728. https://doi.org/10.1002/jmri.29128
             (2024)."),[20](#ref-CR20 "Yang, X. et al. Quantitative assessment of hypovascular component in arterial phase to help the discrimination of combined hepatocellular-Cholangiocarcinoma and hepatocellular carcinoma. J. Hepatocell Carcinoma. 10, 113–122.
              https://doi.org/10.2147/jhc.S390820

             (2023)."),[21](#ref-CR21 "Cannella, R. et al. Targetoid appearance on T2-weighted imaging and signs of tumor vascular involvement: diagnostic value for differentiating HCC from other primary liver carcinomas. Eur. Radiol. 31, 6868–6878.
              https://doi.org/10.1007/s00330-021-07743-x

             (2021)."),[22](/articles/s41598-025-92263-7#ref-CR22 "Park, H. J., Kim, Y. K., Park, M. J. & Lee, W. J. Small intrahepatic mass-forming cholangiocarcinoma: target sign on diffusion-weighted imaging for differentiation from hepatocellular carcinoma. Abdom. Imaging. 38, 793–801.
              https://doi.org/10.1007/s00261-012-9943-x

             (2013).") were documented: (a) location (left lobe, right lobe or subcapsular), (b) satellite nodules, (c) cirrhosis, (d) largest cross-sectional tumor diameter, (e) tumor morphology (round or oval, lobulated or irregular), (f) lesion contour (well defined or obscure), (g) appearance of the liver capsule (neither bulging nor retraction, partial bulging or partial retraction), (h) intrahepatic cholangiectasis, (i) intrahepatic duct stone, (j) macrovascular invasion, (k) intra-tumoral vessels, (l) pseudocapsule, (m) lymph node enlargement, (n) intra-tumoral necrosis, (o) rim-like arterial phase hyperenhancement, (p) diffuse arterial phase hyperenhancement, (q) diffuse arterial phase hypoenhancement, (r) wash-in and wash-out, (s) progressive enhancement, and (t) stable enhancement. For MRI, we also documented: (u) T2-weighted imaging (T2WI) signal (homogeneous signal, peripheral rim high signal or central high signal) and (v) target appearance on the high-b-value (b = 800) DWI. Typical characteristics on MRI and CT images were showed in Fig. [3](/articles/s41598-025-92263-7#Fig3).
Details are presented in the Table S1. Patients were evaluated in random order. When there were multiple lesions, analyze the largest lesion.
Fig. 3
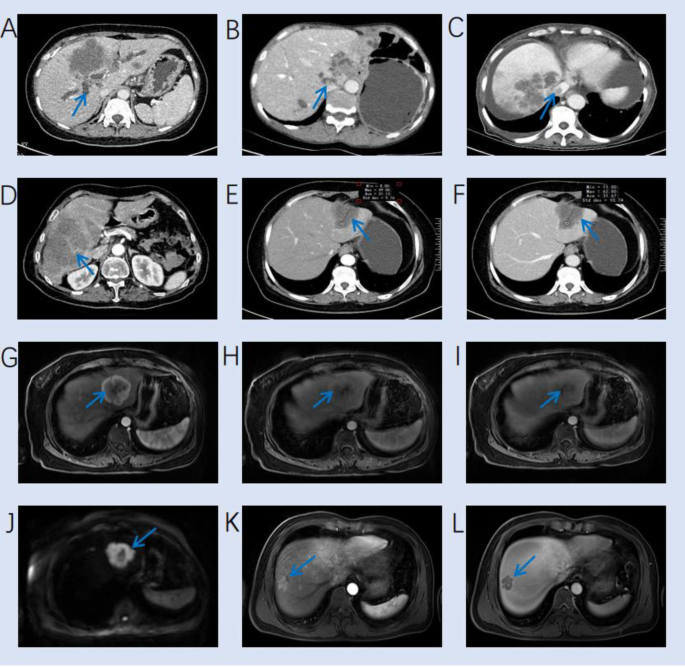
Typical characteristics on MRI and CT images. (A) A venous phase CT image shows a hypodense mass and intrahepatic cholangiectasis (arrow) in the liver. (B) A venous phase CT image shows a hypodense mass in left lobe and intrahepatic duct stone (arrow). (C) A venous phase CT image shows multiple lesions and hepatic vein invasion (arrow). (D) A venous phase CT image shows a hypodense mass with intratumor vessel (arrow). (E-F) An iCCA patient shows stable enhancement on arterial and venous CT images. (G-I) An iCCA patient shows rim-like arterial phase hyperenhancement on arterial phase image, with progressive enhancement on arterial, venous and delayed MRI images. (J) A HCC patient shows target appearance on the high-b-value (b = 800) DWI image. (K-L) A HCC patient shows wash-in and wash-out on arterial and venous MRI images, with a pseudocapsule on venous phase MRI image.
Tumor segmentation and DL feature extraction
Nine sequences were selected for this research, encompassing the non-contrast phase (NP), arterial phase (AP), and venous phase (VP) of CT, as well as T1-weighted imaging (T1WI), T2WI, DWI, optimal hepatic artery late phase (AP), VP, and 3-min delayed phase (DP) of MRI. Contrast-enhanced CT and MRI images were imported into the ITK-SNAP software (Version 3.8.0), respectively. Following visual inspection, two radiologists with over 5 years of experience delineated region of interest (ROI) on the largest slice of the tumor. To ensure standardization, the bicubic spline interpolation algorithm was employed to resample the original images to a voxel size of 1 × 1 × 1 mm3[23](/articles/s41598-025-92263-7#ref-CR23 "Peng, H. et al. Prognostic value of deep learning PET/CT-Based radiomics: potential role for future individual induction chemotherapy in advanced nasopharyngeal carcinoma. Clin. Cancer Res. 25, 4271–4279. https://doi.org/10.1158/1078-0432.Ccr-18-3065
             (2019)."). Unstable features with intra- and interclass correlation coefficients (ICCs) below 0.75 were filtered[24](/articles/s41598-025-92263-7#ref-CR24 "Zhang, A. Q. et al. Computed tomography-based deep-learning prediction of lymph node metastasis risk in locally advanced gastric cancer. Front. Oncol. 12, 969707.
              https://doi.org/10.3389/fonc.2022.969707

             (2022).").
DL radiomics score development
We employed a residual convolutional neural network (Resnet-50) model trained by migration learning to extract DL features and utilized principal component analysis (PCA) to reduce feature dimension. PCA transforms the raw data into a queue of linearly independent representations of each dimension through linear transformation. The 10-fold cross-validation and least absolute shrinkage and selection operator (LASSO) was adopted to refine DL features and get final CT DL radiomics score (DLRSCT) and MRI DL radiomics score (DLRSMRI), respectively.
Development of radiological model and DL radiomics-radiological model
We used the univariate and multivariate analysis to screen impactful CT and MRI radiological characteristics to diagnose iCCA within PLC, respectively. All significant characteristics (P < 0.05) identified through univariate analysis were considered for stepwise multivariate analysis. Then, the CT radiological model (RCT) and MRI radiological model (RMRI) were constructed by the selected radiological characteristics using multivariate logistic regression in the training cohort, respectively. The prominent radiological characteristics and the DL radiomics score were combined to construct the CT deep learning radiomics-radiological model (DLRRCT) and the MRI deep learning radiomics-radiological model (DLRRMRI).
Inter- and intra-modality comparisons
Inter-modality and intra-modality comparisons were performed to assess and contrast the predictive capabilities of CT and MRI. In inter-modality comparisons, we compared the area under the receiver operating characteristic curve (AUC) between RCT and RMRI, DLRSCT and DLRSMRI, along with DLRRCT and DLRRMRI. Intra-modality comparisons were conducted to contrast DL features and radiological characteristics derived from CT and MRI, respectively, and to investigate whether the integration of radiological characteristics and DL features is more meaningful for diagnosing iCCA within each imaging modality. The AUC of DLRS, R and DLRR model was compared in CT and MRI, respectively.
Development and evaluation of CT-MRI fused model
We developed a CT-MRI fused model that combined DLRRCT and DLRRMRI models by multivariate logistic regression. AUC, accuracy (ACC), sensitivity (SENS), specificity (SPEC), negative predictive value (NPV) and positive predictive value (PPV) were used to assess and compare the capacity of the fused model and other models. Moreover, we adopted the Shapley Additive exPlanations (SHAP) interpretation tool to provide an intuitive explanation of model.
Statistical analysis
For univariate analysis, either the Mann-Whitney U test or independent t-test was employed to numeric variables. Discrepancies in categorical data were analyzed using Fisher’s exact test or Chi-square test, designating P < 0.05 as statistically significant. Regression coefficients, derived from training cohort, were deployed in test cohort. We compared AUCs of diverse models via the Delong test. Calibration curves were employed to visually illustrate the consistency between the actual and predicted probability of these models. For evaluating net clinical benefits, decision curve analysis (DCA) was undertaken. The packages used in this study were displayed in Supplementary.
Results
Clinical information
In this study, all 178 patients had available histopathological results. The histopathological examination revealed 39 cases of iCCA and 139 cases of non-iCCA (128 HCC and 11 cHCC-iCCA). The included cases were split into the training and test cohorts (124 in the training cohort and 54 in the test cohort). The allocation of patient characteristics across these two cohorts manifested no notable differences. (Table S2 and S3). The baseline information of the cohorts was summarized in Table 1. Significant difference in age, sex, carbohydrate antigen 199 (CA-199), γ-glutamyl transpeptidase (GGT), history of HBV infection, and alkaline phosphatase (ALP) were noted between the training cohort (all P < 0.05).
Table 1 Patient characteristics of two cohorts.
DL feature selection and performance of DLRSCT and DLRSMRI
After PCA and LASSO, the best valuable DL features were respectively selected from CT and MRI images. The DLRSCT and DLRSMRI was respectively constructed with the multivariate logistic regression to diagnosing iCCA within PLC. In the training cohort, the DLRSCT achieved an AUC of 0.941, with sensitivity of 0.905, specificity of 0.825, and accuracy of 0.839. In the test cohort, these metrics were 0.867, 0.867, 0.667, and 0.722, respectively. For DLRSMRI, the AUC was 0.946 in the training cohort, with sensitivity of 0.857, specificity of 0.835, and accuracy of 0.839. In the test cohort, these metrics were 0.875, 0.733, 0.769, and 0.759, respectively.
Independent variables in the radiological and DLRR models
The inter-reader agreement attained between two readers regarding the radiological characteristics is considered satisfactory. The univariate and multivariate analysis of CT and MRI radiological characteristics of iCCA and non-iCCA categories in the training cohort were summarized in Tables 2 and 3, respectively.
Table 2 Univariate and multivariable analysis of CT radiological characteristics for diagnosing iCCA in the training cohort.
Table 3 Univariate and multivariable analysis of MRI radiological characteristics for diagnosing iCCA in the training cohort.
Following the univariate and multivariate analysis, two radiological characteristics included intrahepatic cholangiectasis (odds ratio [OR], 4.246; 95% confidence interval [CI], 1.059–19.092; P < 0.05) and wash-in and wash-out (OR, 0.127; 95% CI, 0.013–0.921; P < 0.05) displayed statistically significant differences were selected as independent predictors for diagnosing iCCA within PLC to develop RCT model. Cirrhosis (OR, 0.071; 95% CI, 0.006–0.481; P < 0.05), rim-like arterial phase hyperenhancement (OR, 6.243; 95% CI, 1.038–46.488; P < 0.05), wash-in and wash-out (OR, 0.051; 95% CI, 0.003–0.616; P < 0.05) were selected as independent predictors for diagnosing iCCA within PLC to develop RMRI model.
The optimal CT radiological characteristics were combined with the DLRSCT to build DLRRCT by multivariate logistic regression. Using the same method, the DLRRMRI model were developed.
Results of the inter- and intra-modality comparisons
Table 4; Fig. 4A and B presented the results of different models in inter- and intra-modality comparisons. The intra-modality comparisons results showed that DLRRCT was superior to DLRSCT and RCT model in the training cohort (AUC = 0.965, 0.941, 0.875, respectively) and test cohort (AUC = 0.880, 0.867, 0.840, respectively) (Supplementary Fig. S1). As for MRI imaging, DLRRMRI was superior to DLRSMRI and RMRI model in the training cohort (AUC = 0.975, 0.946, 0.935, respectively) and test cohort (AUC = 0.923, 0.875, 0.859, respectively) (Supplementary Fig. S1).
In terms of inter-modality comparisons results in test cohort, the DLRSMRI outperformed DLRSCT (AUC: 0.875 vs. 0.867, P = 0.922). RMRI model exhibited superior performance compared to the RCT model (AUC: 0.859 vs. 0.840, P = 0.808). Similarly, the DLRRMRI model also outperformed DLRRCT model (AUC: 0.923 vs. 0.880, P = 0.521). Notably, the sensitivity of the DLRRMRI model is 0.867, which is higher than that of the DLRRCT model at 0.600. However, no significant differences were found in these models (P > 0.05).
Table 4 Performance of different models in diagnosing iCCA.
Construction and performance of the fused model
We constructed a CT-MRI cross-modal fused model that combined DLRRCT and DLRRMRI models. The fused model displayed an AUC of 0.994, sensitivity of 0.952, specificity of 0.971, and accuracy of 0. 968. In the test cohort, it exhibited sensitivity of 0.800 and specificity of 0.872 with an AUC of 0.937, indicating an accuracy of 0.852. Compared with other models, the fused model was the optimal model, but we found no significant difference between it and other models in Delong test (P > 0.05). Calibration curves representing the probability of iCCA showcased a significant alignment between model forecasts and actual findings, suggesting excellent calibration performance (Fig. 4C). The decision curves represented the constructive clinical applicability of the fused model (Fig. 4D).
Fig. 4
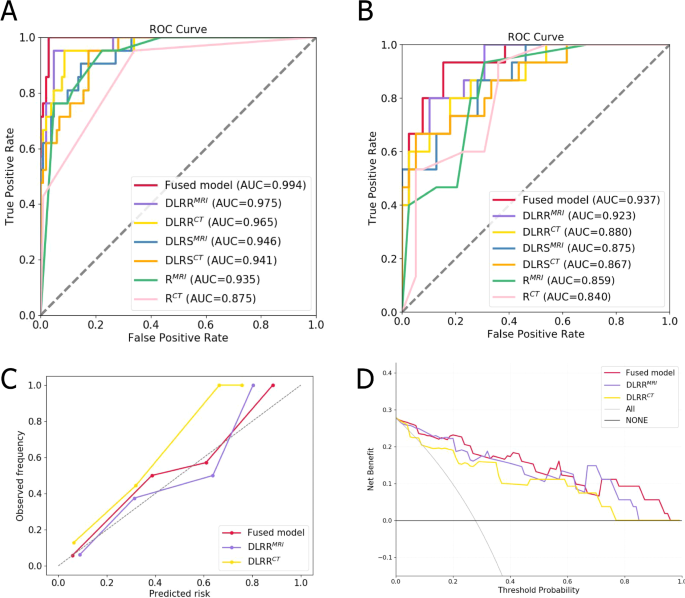
ROC curves of different models in training (A) and test (B) cohorts. (C) Calibration curves of different models in test cohort. The gray dotted line represents an ideal prediction. (D) Decision curve analysis for different models in test cohort. The x-axis is the threshold probability and the y-axis is the net income.
We used SHAP to interpret the contribution of selected features in diagnosing iCCA. Fig. 5A displays the SHAP summary plot for the seven most important features in the fused model. In each feature important line, the attributions of all patients to the results are plotted with different colored dots, where red and blue dots indicate high and low risk values, respectively. Fig. 5B ranks these features by their mean absolute SHAP values, where the x-axis represents feature importance in the predictive model.
Fig. 5
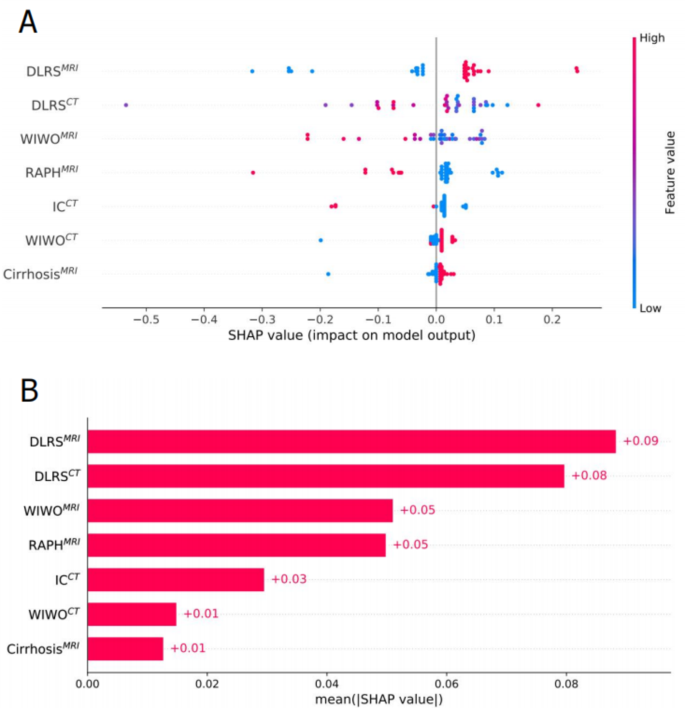
SHAP interprets the model. (A) Attributes of characteristics in SHAP. Each line represents a feature, and the abscissa is the SHAP value. Red dots represent higher eigenvalues and blue dots represent lower eigenvalues. (B) Feature importance ranking as indicated by SHAP. The matrix diagram describes the importance of each covariate in the development of the final prediction model. WIHO MRI wash-in and wash-out in MRI; RAPH MRI rim-like arterial phase hyperenhancement in MRI; IC CT intrahepatic cholangiectasis in CT; WIWO CT wash-in and wash-out in CT.
Discussion
The current study involved an evaluative analysis of CT- and MRI-based DL features for diagnosing iCCA within PLC. PLC patients who received both CT and MRI scans before histopathological examination were included in our study. We constructed and evaluated six distinct models: DLRSCT, RCT, DLRRCT from CT imaging, and DLRSMRI, RMRI, DLRRMRI from MRI imaging. Additionally, a cross-modal fused model was introduced and yielded the highest AUC value.
In clinical settings, CT and MRI have emerged as indispensable tools for the evaluation of PLC. Possessing greater spatial resolution, CT is superior in identifying vascular involvement and evaluating resectability[25](/articles/s41598-025-92263-7#ref-CR25 "Asayama, Y. et al. Delayed-phase dynamic CT enhancement as a prognostic factor for mass-forming intrahepatic cholangiocarcinoma. Radiology 238, 150–155. https://doi.org/10.1148/radiol.2381041765
             (2006)."). Compared to CT, MRI is more advantageous in detecting liver fibrosis and small lesions due to its inherently soft tissue resolution[26](/articles/s41598-025-92263-7#ref-CR26 "Guglielmo, F. F. et al. Liver fibrosis, fat, and Iron evaluation with MRI and fibrosis and fat evaluation with US: A practical guide for radiologists. Radiographics 43, e220181.
              https://doi.org/10.1148/rg.220181

             (2023)."). A comprehensive review of prior researches unveiled a high rate of misdiagnosing iCCA as either HCC or cHCC-iCCA[27](/articles/s41598-025-92263-7#ref-CR27 "Chiow, S. M., Khoo, H. W., Low, J. K., Tan, C. H. & Low, H. M. Imaging mimickers of cholangiocarcinoma: a pictorial review. Abdom. Radiol. (NY). 47, 981–997.
              https://doi.org/10.1007/s00261-021-03399-9

             (2022)."). On CT and MRI, iCCA typically manifests as a hypodense mass with progressive enhancement[28](/articles/s41598-025-92263-7#ref-CR28 "Kubo, S. et al. Liver Cancer study group of Japan clinical practice guidelines for intrahepatic cholangiocarcinoma. Liver Cancer. 11, 290–314.
              https://doi.org/10.1159/000522403

             (2022)."). Approximately 20% of cases exhibit encapsulation retraction, which is attributed to the combined effects of chronic biliary obstruction and adjacent hepatic parenchymal atrophy, both stemming from the abundant fibrous components within the tumor[29](/articles/s41598-025-92263-7#ref-CR29 "Panick, C. E. P., Ward, R. D., Coppa, C. & Liu, P. S. Hepatic capsular Retraction: an updated MR imaging review. Eur. J. Radiol. 113, 15–23.
              https://doi.org/10.1016/j.ejrad.2019.01.037

             (2019)."). On T2WI, ICCs exhibit heterogeneously hyperintense and may also display central hypointensity corresponding to fibrotic regions[30](/articles/s41598-025-92263-7#ref-CR30 "Manfredi, R., Barbaro, B., Masselli, G., Vecchioli, A. & Marano, P. Magnetic resonance imaging of cholangiocarcinoma. Semin Liver Dis. 24, 155–164.
              https://doi.org/10.1055/s-2004-828892

             (2004)."). A previous study showed that the target appearance on DWI can also be used to characterize iCCA, with sensitivity of 0.80[31](/articles/s41598-025-92263-7#ref-CR31 "You, M. W. & Yun, S. J. Differentiating between hepatocellular carcinoma and intrahepatic cholangiocarcinoma using contrast-enhanced MRI features: a systematic review and meta-analysis. Clin. Radiol. 74, 406e409. 406.e418 (2019).").
In our study, we performed multivariate analysis and retained CT variables including intrahepatic cholangiectasis, along with wash-in and wash-out to develop RCT model. For MRI, wash-in and wash-out, cirrhosis and rim-like arterial phase hyperenhancement were incorporated into RMRI model. During RMRI model development, we also probed the potential of target appearance on DWI and T2 signal for iCCA identification, yet neither showed statistical significance in the multivariate analysis. Notably, the final variables in the RCT and RMRImodels were discrepant, potentially attributed to MRI’s superior sensitivity in detecting cirrhosis[32](/articles/s41598-025-92263-7#ref-CR32 "Noureddin, M. et al. MRI-based (MAST) score accurately identifies patients with NASH and significant fibrosis. J. Hepatol. 76, 781–787. https://doi.org/10.1016/j.jhep.2021.11.012
             (2022)."). Some literature has shown that lesions initially presenting with a typical HCC enhancement pattern (wash-in and wash-out) were ultimately diagnosed as iCCA upon histopathology examination[33](/articles/s41598-025-92263-7#ref-CR33 "Lee, D. D. et al. Liver transplantation for intrahepatic cholangiocarcinoma. Liver Transpl. 24, 634–644.
              https://doi.org/10.1002/lt.25052

             (2018)."),[34](/articles/s41598-025-92263-7#ref-CR34 "Sapisochin, G. et al. Liver transplantation for very early intrahepatic cholangiocarcinoma: international retrospective study supporting a prospective assessment. Hepatology 64, 1178–1188.
              https://doi.org/10.1002/hep.28744

             (2016)."). In our study, this characteristic has been identified as an independent predictor for identifying iCCA in both RCT and RMRI. We attributed it to the small sample size of iCCA. Anyway, the results indicated a slightly higher AUC for the RMRI model compared to the RCT model.
DL has emerged as a rising approach for quantitative feature extraction and extensively employed in the clinical management of disease. Several studies have shown that classifying liver lesions based on multi-phase CT or MRI DL models is feasible[35](#ref-CR35 "Le Berre, C. et al. Application of artificial intelligence to gastroenterology and hepatology. Gastroenterology 158, 76–94e72. https://doi.org/10.1053/j.gastro.2019.08.058
             (2020)."),[36](#ref-CR36 "Hamm, C. A. et al. Deep learning for liver tumor diagnosis part I: development of a convolutional neural network classifier for multi-phasic MRI. Eur. Radiol. 29, 3338–3347.
              https://doi.org/10.1007/s00330-019-06205-9

             (2019)."),[37](/articles/s41598-025-92263-7#ref-CR37 "Shi, W. et al. Deep learning assisted differentiation of hepatocellular carcinoma from focal liver lesions: choice of four-phase and three-phase CT imaging protocol. Abdom. Radiol. (NY). 45, 2688–2697.
              https://doi.org/10.1007/s00261-020-02485-8

             (2020)."). As evidenced by the findings from Hamm et al.[36](/articles/s41598-025-92263-7#ref-CR36 "Hamm, C. A. et al. Deep learning for liver tumor diagnosis part I: development of a convolutional neural network classifier for multi-phasic MRI. Eur. Radiol. 29, 3338–3347.
              https://doi.org/10.1007/s00330-019-06205-9

             (2019)."), which constructed a DL model tailored for categorizing six prevalent liver lesions within MRI images, reporting an accuracy rate of 0.919\. If classified into three expansive categories of benign lesions, HCC, and malignant non-HCC lesions, the accuracy can reach the highest 0.943\. By using different phases CT imaging, DL has effectively discerned HCC from other focal liver lesions[37](/articles/s41598-025-92263-7#ref-CR37 "Shi, W. et al. Deep learning assisted differentiation of hepatocellular carcinoma from focal liver lesions: choice of four-phase and three-phase CT imaging protocol. Abdom. Radiol. (NY). 45, 2688–2697.
              https://doi.org/10.1007/s00261-020-02485-8

             (2020)."). These researches encompassed typical benign lesions, for instance, cysts and focal nodular hyperplasia. Within medical settings, differentiating between benign lesions and malignancies isn’t excessively challenging. However, categorizing within malignancies regularly represents a profound difficulty. A previous study documented that DL models achieved high AUCs of 0.986, 0.881, and 0.920 for the diagnosis of HCC, iCCA and metastasis, respectively, on an external test set[38](/articles/s41598-025-92263-7#ref-CR38 "Gao, R. et al. Deep learning for differential diagnosis of malignant hepatic tumors based on multi-phase contrast-enhanced CT and clinical data. J. Hematol. Oncol. 14, 154.
              https://doi.org/10.1186/s13045-021-01167-2

             (2021)."). In this paper, we concentrated on the classification within PLC and consider iCCA as identification target. Because iCCA and other subtypes of PLC have different treatment methods, especially in terms of local and systemic treatment practice[39](/articles/s41598-025-92263-7#ref-CR39 "Moris, D. et al. Advances in the treatment of intrahepatic cholangiocarcinoma: an overview of the current and future therapeutic landscape for clinicians. CA Cancer J. Clin. 73, 198–222.
              https://doi.org/10.3322/caac.21759

             (2023)."). DL radiomics analysis was employed to identify iCCA and demonstrated remarkable performance, with AUCs of 0.946 and 0.941 for DLRSMRI and DLRSCT in training cohort and 0.875 and 0.867 in test cohort, respectively. This outcome manifests the feasibility of DL models for identifying iCCA.
In the inter-imaging modality comparison, the performance of MRI-based DLRS, R, and DLRR had marginally surpassed that of CT-based counterparts. Notably, the specificity of the DLRRMRI model is 0.951, which is higher than that of the DLRRCTmodel at 0.913 in training cohort. Higher specificity can reduce the incidence of false positive results, thereby decreasing the rate of misdiagnosis. We speculate that the superior performance of MRI in soft tissue contrast and multi-parametric imaging enables it to reveal anatomical details and lesion characteristics more clearly, which may be a key factor in generating high-quality training data. Conversely, CT data is more susceptible to interference from noise and artifacts, which may cause the model to capture features unrelated to the lesion, thereby reducing the specificity of the model. Our research results indicated that regardless of the imaging method, DLRS always outperformed R model, which is consistent with previous research findings[40](/articles/s41598-025-92263-7#ref-CR40 "Jiang, Y. W., Xu, X. J., Wang, R. & Chen, C. M. Radiomics analysis based on lumbar spine CT to detect osteoporosis. Eur. Radiol. 32, 8019–8026. https://doi.org/10.1007/s00330-022-08805-4
             (2022)."),[41](/articles/s41598-025-92263-7#ref-CR41 "Peng, L. et al. MRI-radiomics-clinical-based nomogram for prenatal prediction of the placenta accreta spectrum disorders. Eur. Radiol. 32, 7532–7543.
              https://doi.org/10.1007/s00330-022-08821-4

             (2022)."). Furthermore, the DLRR model outperformed the DLRS in both imaging modalities, underscoring the value of integrating DL features and radiological characteristics. However, no statistically significant differences were identified among the six models. Consequently, our findings indicated that CT and MRI may possess comparable predictive capabilities in the identification of iCCA. Liu et al.[42](/articles/s41598-025-92263-7#ref-CR42 "Liu, X. et al. Can machine learning radiomics provide pre-operative differentiation of combined hepatocellular cholangiocarcinoma from hepatocellular carcinoma and cholangiocarcinoma to inform optimal treatment planning? Eur. Radiol. 31, 244–255.
              https://doi.org/10.1007/s00330-020-07119-7

             (2021).") used radiomics analysis on CT and MRI imaging to classify PLC into HCC and non-HCC groups, arterial phase MRI model showed a higher AUC (0.81) than it in arterial phase CT model (0.52). Different from Liu, we not only performed comparison of CT and MRI DL radiomics analysis, but also performed combination of CT and MRI. We built a CT-MRI fused model, which was the optimal model with the AUC of 0.994 and 0.937 in training and test cohorts, respectively. Therefore, this model showed promising potential for improving patient management and facilitating treatment decision-making. But this process may also increase the economic burden on patients.
This study had some limitations. Firstly, all retrospective CT and MRI imaging data come from a unified center and need to be validated in more centers. Secondly, due to the relative rarity of iCCA, there were few cases in this study, so we will search for more samples for future research. In future investigations, we will systematically collect prognostic data from iCCA patients to investigate the potential correlation between deep learning features and clinical outcomes. Thirdly, our study only includes PLC and does not include other liver lesions. Identifying more types of lesions is more challenging.
Conclusions
In summary, we developed and compared the diagnostic value of CT- and MRI-based DL models in identifying iCCA. Nevertheless, DL analysis did not display a significant difference between MRI and CT. The cross-modal fused model incorporating both CT and MRI could effectively identify iCCA, making it a non-invasive and convenient tool for physicians.
Data availability
Due to patient privacy concerns, the hospital dataset generated and analyzed during this study is not publicly available, but can be obtained from the corresponding author upon reasonable request.
References
- Sung, H. et al. Global Cancer statistics 2020: GLOBOCAN estimates of incidence and mortality worldwide for 36 cancers in 185 countries. CA Cancer J. Clin. 71, 209–249. https://doi.org/10.3322/caac.21660 (2021).
Article CAS PubMed MATH Google Scholar - Sarcognato, S. et al. Cholangiocarcinoma Pathologica 113, 158–169, doi:https://doi.org/10.32074/1591-951x-252 (2021).
Article PubMed Google Scholar - Ilyas, S. I. & Gores, G. J. Pathogenesis, diagnosis, and management of cholangiocarcinoma. Gastroenterology 145, 1215–1229. https://doi.org/10.1053/j.gastro.2013.10.013 (2013).
Article CAS PubMed MATH Google Scholar - Zhang, X. F. et al. Early versus late recurrence of intrahepatic cholangiocarcinoma after resection with curative intent. Br. J. Surg. 105, 848–856. https://doi.org/10.1002/bjs.10676 (2018).
Article PubMed MATH Google Scholar - Tsilimigras, D. I. et al. Recurrent intrahepatic cholangiocarcinoma: A 10-Point score to predict Post-Recurrence survival and guide treatment of recurrence. Ann. Surg. Oncol. 31, 4427–4435. https://doi.org/10.1245/s10434-024-15210-2 (2024).
Article PubMed MATH Google Scholar - Lin, C. W. et al. Clinical features and outcomes of combined hepatocellular carcinoma and cholangiocarcinoma versus hepatocellular carcinoma versus cholangiocarcinoma after surgical resection: a propensity score matching analysis. BMC Gastroenterol. 21, 20. https://doi.org/10.1186/s12876-020-01586-4 (2021).
Article PubMed PubMed Central Google Scholar - Lim, T. S. & Kim, J. K. Is liver biopsy still useful in the era of non-invasive tests? Clin. Mol. Hepatol. 26, 302–304. https://doi.org/10.3350/cmh.2020.0081 (2020).
Article PubMed PubMed Central MATH Google Scholar - Ding, G. Y. et al. Mining the interpretable prognostic features from pathological image of intrahepatic cholangiocarcinoma using multi-modal deep learning. BMC Med. 22, 282. https://doi.org/10.1186/s12916-024-03482-0 (2024).
Article CAS PubMed PubMed Central MATH Google Scholar - Song, Y. et al. Artificial intelligence CT radiomics to predict early recurrence of intrahepatic cholangiocarcinoma: a multicenter study. Hepatol. Int. 17, 1016–1027. https://doi.org/10.1007/s12072-023-10487-z (2023).
Article PubMed MATH Google Scholar - Yang, C. M. & Shu, J. Cholangiocarcinoma evaluation via imaging and artificial intelligence. Oncology 99, 72–83. https://doi.org/10.1159/000507449 (2021).
Article CAS PubMed MATH Google Scholar - Saleh, M. et al. Intrahepatic cholangiocarcinoma: pathogenesis, current staging, and radiological findings. Abdom. Radiol. (NY). 45, 3662–3680. https://doi.org/10.1007/s00261-020-02559-7 (2020).
Article PubMed MATH Google Scholar - Kim, Y. Y. et al. Clinical staging of Mass-Forming intrahepatic cholangiocarcinoma: computed tomography versus magnetic resonance imaging. Hepatol. Commun. 5, 2009–2018. https://doi.org/10.1002/hep4.1774 (2021).
Article PubMed PubMed Central MATH Google Scholar - Jhaveri, K. S. & Hosseini-Nik, H. MRI of cholangiocarcinoma. J. Magn. Reson. Imaging. 42, 1165–1179. https://doi.org/10.1002/jmri.24810 (2015).
Article PubMed MATH Google Scholar - Wang, S., Wang, X., Yin, X., Lv, X. & Cai, J. Differentiating HCC from ICC and prediction of ICC grade based on MRI deep-radiomics: using lesions and their extended regions. Phys. Med. 120, 103322. https://doi.org/10.1016/j.ejmp.2024.103322 (2024).
Article PubMed Google Scholar - Ejaz, A., Cloyd, J. M. & Pawlik, T. M. Advances in the diagnosis and treatment of patients with intrahepatic cholangiocarcinoma. Ann. Surg. Oncol. 27, 552–560. https://doi.org/10.1245/s10434-019-07873-z (2020).
Article PubMed Google Scholar - Gao, W. et al. A multiparametric fusion deep learning model based on DCE-MRI for preoperative prediction of microvascular invasion in intrahepatic cholangiocarcinoma. J. Magn. Reson. Imaging. 56, 1029–1039. https://doi.org/10.1002/jmri.28126 (2022).
Article PubMed MATH Google Scholar - Weber, S. M. et al. Intrahepatic cholangiocarcinoma: expert consensus statement. HPB (Oxford). 17, 669–680. https://doi.org/10.1111/hpb.12441 (2015).
Article PubMed Google Scholar - Wakiya, T. et al. CT-based deep learning enables early postoperative recurrence prediction for intrahepatic cholangiocarcinoma. Sci. Rep. 12, 8428. https://doi.org/10.1038/s41598-022-12604-8 (2022).
Article ADS CAS PubMed PubMed Central MATH Google Scholar - Xu, Y. et al. Association between MRI radiomics and intratumoral tertiary lymphoid structures in intrahepatic cholangiocarcinoma and its prognostic significance. J. Magn. Reson. Imaging. 60, 715–728. https://doi.org/10.1002/jmri.29128 (2024).
Article PubMed MATH Google Scholar - Yang, X. et al. Quantitative assessment of hypovascular component in arterial phase to help the discrimination of combined hepatocellular-Cholangiocarcinoma and hepatocellular carcinoma. J. Hepatocell Carcinoma. 10, 113–122. https://doi.org/10.2147/jhc.S390820 (2023).
Article PubMed PubMed Central MATH Google Scholar - Cannella, R. et al. Targetoid appearance on T2-weighted imaging and signs of tumor vascular involvement: diagnostic value for differentiating HCC from other primary liver carcinomas. Eur. Radiol. 31, 6868–6878. https://doi.org/10.1007/s00330-021-07743-x (2021).
Article PubMed MATH Google Scholar - Park, H. J., Kim, Y. K., Park, M. J. & Lee, W. J. Small intrahepatic mass-forming cholangiocarcinoma: target sign on diffusion-weighted imaging for differentiation from hepatocellular carcinoma. Abdom. Imaging. 38, 793–801. https://doi.org/10.1007/s00261-012-9943-x (2013).
Article PubMed MATH Google Scholar - Peng, H. et al. Prognostic value of deep learning PET/CT-Based radiomics: potential role for future individual induction chemotherapy in advanced nasopharyngeal carcinoma. Clin. Cancer Res. 25, 4271–4279. https://doi.org/10.1158/1078-0432.Ccr-18-3065 (2019).
Article CAS PubMed MATH Google Scholar - Zhang, A. Q. et al. Computed tomography-based deep-learning prediction of lymph node metastasis risk in locally advanced gastric cancer. Front. Oncol. 12, 969707. https://doi.org/10.3389/fonc.2022.969707 (2022).
Article MathSciNet PubMed PubMed Central MATH Google Scholar - Asayama, Y. et al. Delayed-phase dynamic CT enhancement as a prognostic factor for mass-forming intrahepatic cholangiocarcinoma. Radiology 238, 150–155. https://doi.org/10.1148/radiol.2381041765 (2006).
Article PubMed MATH Google Scholar - Guglielmo, F. F. et al. Liver fibrosis, fat, and Iron evaluation with MRI and fibrosis and fat evaluation with US: A practical guide for radiologists. Radiographics 43, e220181. https://doi.org/10.1148/rg.220181 (2023).
Article PubMed Google Scholar - Chiow, S. M., Khoo, H. W., Low, J. K., Tan, C. H. & Low, H. M. Imaging mimickers of cholangiocarcinoma: a pictorial review. Abdom. Radiol. (NY). 47, 981–997. https://doi.org/10.1007/s00261-021-03399-9 (2022).
Article PubMed MATH Google Scholar - Kubo, S. et al. Liver Cancer study group of Japan clinical practice guidelines for intrahepatic cholangiocarcinoma. Liver Cancer. 11, 290–314. https://doi.org/10.1159/000522403 (2022).
Article CAS PubMed PubMed Central MATH Google Scholar - Panick, C. E. P., Ward, R. D., Coppa, C. & Liu, P. S. Hepatic capsular Retraction: an updated MR imaging review. Eur. J. Radiol. 113, 15–23. https://doi.org/10.1016/j.ejrad.2019.01.037 (2019).
Article PubMed Google Scholar - Manfredi, R., Barbaro, B., Masselli, G., Vecchioli, A. & Marano, P. Magnetic resonance imaging of cholangiocarcinoma. Semin Liver Dis. 24, 155–164. https://doi.org/10.1055/s-2004-828892 (2004).
Article PubMed Google Scholar - You, M. W. & Yun, S. J. Differentiating between hepatocellular carcinoma and intrahepatic cholangiocarcinoma using contrast-enhanced MRI features: a systematic review and meta-analysis. Clin. Radiol. 74, 406e409. 406.e418 (2019).
Article Google Scholar - Noureddin, M. et al. MRI-based (MAST) score accurately identifies patients with NASH and significant fibrosis. J. Hepatol. 76, 781–787. https://doi.org/10.1016/j.jhep.2021.11.012 (2022).
Article PubMed MATH Google Scholar - Lee, D. D. et al. Liver transplantation for intrahepatic cholangiocarcinoma. Liver Transpl. 24, 634–644. https://doi.org/10.1002/lt.25052 (2018).
Article ADS PubMed MATH Google Scholar - Sapisochin, G. et al. Liver transplantation for very early intrahepatic cholangiocarcinoma: international retrospective study supporting a prospective assessment. Hepatology 64, 1178–1188. https://doi.org/10.1002/hep.28744 (2016).
Article CAS PubMed MATH Google Scholar - Le Berre, C. et al. Application of artificial intelligence to gastroenterology and hepatology. Gastroenterology 158, 76–94e72. https://doi.org/10.1053/j.gastro.2019.08.058 (2020).
Article PubMed MATH Google Scholar - Hamm, C. A. et al. Deep learning for liver tumor diagnosis part I: development of a convolutional neural network classifier for multi-phasic MRI. Eur. Radiol. 29, 3338–3347. https://doi.org/10.1007/s00330-019-06205-9 (2019).
Article PubMed PubMed Central MATH Google Scholar - Shi, W. et al. Deep learning assisted differentiation of hepatocellular carcinoma from focal liver lesions: choice of four-phase and three-phase CT imaging protocol. Abdom. Radiol. (NY). 45, 2688–2697. https://doi.org/10.1007/s00261-020-02485-8 (2020).
Article PubMed MATH Google Scholar - Gao, R. et al. Deep learning for differential diagnosis of malignant hepatic tumors based on multi-phase contrast-enhanced CT and clinical data. J. Hematol. Oncol. 14, 154. https://doi.org/10.1186/s13045-021-01167-2 (2021).
Article PubMed PubMed Central MATH Google Scholar - Moris, D. et al. Advances in the treatment of intrahepatic cholangiocarcinoma: an overview of the current and future therapeutic landscape for clinicians. CA Cancer J. Clin. 73, 198–222. https://doi.org/10.3322/caac.21759 (2023).
Article PubMed MATH Google Scholar - Jiang, Y. W., Xu, X. J., Wang, R. & Chen, C. M. Radiomics analysis based on lumbar spine CT to detect osteoporosis. Eur. Radiol. 32, 8019–8026. https://doi.org/10.1007/s00330-022-08805-4 (2022).
Article PubMed PubMed Central Google Scholar - Peng, L. et al. MRI-radiomics-clinical-based nomogram for prenatal prediction of the placenta accreta spectrum disorders. Eur. Radiol. 32, 7532–7543. https://doi.org/10.1007/s00330-022-08821-4 (2022).
Article PubMed MATH Google Scholar - Liu, X. et al. Can machine learning radiomics provide pre-operative differentiation of combined hepatocellular cholangiocarcinoma from hepatocellular carcinoma and cholangiocarcinoma to inform optimal treatment planning? Eur. Radiol. 31, 244–255. https://doi.org/10.1007/s00330-020-07119-7 (2021).
Article CAS PubMed Google Scholar
Funding
This work was supported by the Key Research Projects of Higher Education Institutions in Henan Province (No. 25A520031), the Key Project of Science and Technology Research of Henan Province (No. 222102210112), the National Natural and Science Fund of China (No. 82472069). The authors have indicated no financial conflicts of interest.
Author information
Authors and Affiliations
- Department of Medical Information, The First Affiliated Hospital of Zhengzhou University, Zhengzhou, 450052, China
Ming Cheng - Department of Radiology, The First Affiliated Hospital of Zhengzhou University, Zhengzhou, 450052, China
Hanyue Zhang, Yimin Guo, Peijie Lyu, Pan Liang & Jianbo Gao - Henan Key Laboratory of Image Diagnosis and Treatment for Digestive System Tumor, The First Affiliated Hospital of Zhengzhou University, Zhengzhou, 450052, China
Hanyue Zhang, Yimin Guo, Peijie Lyu, Pan Liang & Jianbo Gao - Department of MRI, The First Affiliated Hospital of Zhengzhou University, Zhengzhou, 450052, China
Jing Yan - Department of Hepatobiliary and Pancreatic Surgery, The First Affiliated Hospital of Zhengzhou University, Zhengzhou, 450052, Henan, China
Yin Liu - Department of Infectious Diseases, The First Affiliated Hospital of Zhengzhou University, Zhengzhou, 450052, China
Zhigang Ren
Authors
- Ming Cheng
- Hanyue Zhang
- Yimin Guo
- Peijie Lyu
- Jing Yan
- Yin Liu
- Pan Liang
- Zhigang Ren
- Jianbo Gao
Contributions
All authors contributed to the study conception and design. Material preparation and data collection were performed by Ming Cheng, Hanyue Zhang, Yimin Guo, Peijie Lyu, Jing Yan, Yin Liu, Pan Liang, Zhigang Ren, Jianbo Gao. Data analysis was performed by Ming Cheng, Hanyue Zhang and Yimin Guo. The first draft of the manuscript was written by Ming Cheng and Hanyue Zhang, and all authors commented on previous versions of the manuscript. All authors read and approved the final manuscript.
Corresponding author
Correspondence toMing Cheng.
Ethics declarations
Competing interests
The authors declare no competing interests.
Ethics approval
This study was approved by the Medical Ethics Committee of the First Affiliated Hospital of Zhengzhou University and the Medical Ethics Committee of the First Affiliated Hospital of Zhengzhou University waived the requirement of informed consent due to its retrospective design (2022-KY-0752-001). All procedures performed in this study comply with the Declaration of Helsinki (revised in 2013).
Additional information
Publisher’s note
Springer Nature remains neutral with regard to jurisdictional claims in published maps and institutional affiliations.
Electronic supplementary material
Rights and permissions
Open Access This article is licensed under a Creative Commons Attribution-NonCommercial-NoDerivatives 4.0 International License, which permits any non-commercial use, sharing, distribution and reproduction in any medium or format, as long as you give appropriate credit to the original author(s) and the source, provide a link to the Creative Commons licence, and indicate if you modified the licensed material. You do not have permission under this licence to share adapted material derived from this article or parts of it. The images or other third party material in this article are included in the article’s Creative Commons licence, unless indicated otherwise in a credit line to the material. If material is not included in the article’s Creative Commons licence and your intended use is not permitted by statutory regulation or exceeds the permitted use, you will need to obtain permission directly from the copyright holder. To view a copy of this licence, visit http://creativecommons.org/licenses/by-nc-nd/4.0/.
About this article
Cite this article
Cheng, M., Zhang, H., Guo, Y. et al. Comparison of MRI and CT based deep learning radiomics analyses and their combination for diagnosing intrahepatic cholangiocarcinoma.Sci Rep 15, 9629 (2025). https://doi.org/10.1038/s41598-025-92263-7
- Received: 31 December 2024
- Accepted: 26 February 2025
- Published: 20 March 2025
- Version of record: 20 March 2025
- DOI: https://doi.org/10.1038/s41598-025-92263-7