Association between vitamin A, E, and folate levels and risk of non-alcoholic fatty liver disease in adults with diabetes mellitus (original) (raw)
Introduction
Non-alcoholic fatty liver disease (NAFLD), which is one of the major causes of chronic liver disease, is characterized by excessive fat accumulation in hepatic cells owing to factors other than alcohol consumption. The global prevalence of NAFLD was estimated at 25% in 2015 and is projected to increase alongside the increasing incidence of obesity and metabolic syndrome1. In South Korea, the overall prevalence of NAFLD is reported as 32.9%, showing a threefold increase over the past 20 years2. Rapidly growing prevalence of NAFLD and its negative impact on mortality are imposing a substantial health burden3.
Given the detrimental effects of NAFLD on the quality of life of individuals as well as on public health, identifying high-risk individuals is important for disease prevention and management. One of the major risk factors of NAFLD is type 2 diabetes, and both disease states are closely related, sharing similar pathophysiological processes including insulin resistance and inflammation4. One study has shown that patients with NAFLD have 3.92 times higher risk of developing type 2 diabetes5. Similarly, patients with type 2 diabetes face an increased risk for NAFLD compared to the general population. In South Korea, NAFLD affects up to 63–73% of individuals with type 2 diabetes, which is more than double the rate observed in the general population6,7. Accordingly, the current clinical practice guidelines recommend the evaluation of NAFLD in all patients with type 2 diabetes8.
Although growing evidence supports the clinical significance of NAFLD in patients with type 2 diabetes, there are no approved pharmacologic treatments specifically for NAFLD at present. Therefore, current management for NAFLD is mainly focused on lifestyle modification, consisting of weight loss, exercise, and dietary adjustments9. Concerning dietary factors, several studies have investigated the role of micronutrients in NAFLD management and their association with health outcomes. Previous studies have reported a decrease in serum vitamin A and E levels in patients with NAFLD10,11, and association between reductions in serum vitamin A or folate levels and the histologic severity of NAFLD12,13. However, few studies have examined the NAFLD risk in relation to serum vitamin levels specifically within patients with diabetes.
Therefore, we conducted a population-based cross-sectional study to examine the association between the risk of NAFLD and serum vitamin A (retinol), vitamin E (α-tocopherol), and folate levels in Korean adults with diabetes mellitus.
Results
Baseline characteristics of the study participants
From the KNHANES 7th database, 2,687 of participants with diabetes mellitus aged ≥ 19 years were identified. Among them, we excluded those who were pregnant (n = 2) and those with an excessive daily intake of vitamin A or folate (n = 15). Patients with a history of hepatitis B virus (HBV) or hepatitis C virus (HCV) infection, liver cirrhosis, or heavy alcohol consumption (n = 66) were further excluded. In total, 589 Korean adults with diabetes were included in the final study population, who were then grouped according to NAFLD status and serum vitamin levels of vitamin A, E, and folate (Fig. 1).
Fig. 1
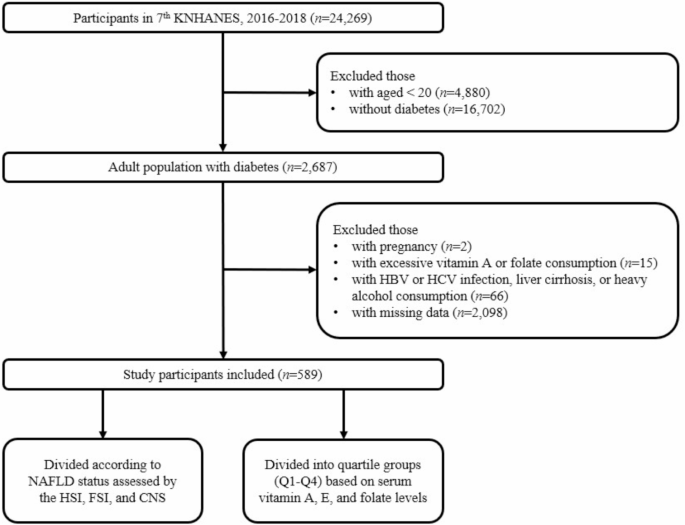
Flow diagram of study participant selection and grouping. A total of 24,269 participants from the 7th KNHANES (2016–2018) were screened, and 589 participants were included after applying exclusion criteria. The study population was then divided according to NAFLD status and serum vitamin levels of vitamin A, E, and folate. Abbreviations: KNHANES, Korean National Health and Nutrition Examination Survey; HBV, hepatitis B virus; HCV, hepatitis C virus; NAFLD, non-alcoholic fatty liver disease; HSI, hepatic steatosis index; FSI, Framingham steatosis index; CNS, comprehensive NALFD score.
Of the total 589 participants, 326 (55%), 445 (76%), and 527 (89%) were defined as NAFLD based on HSI, FSI, and CNS, respectively. The baseline characteristics of the study participants according to the presence of NAFLD are presented in Table 1.
Table 1 Baseline characteristics of the study participants according to the NAFLD status assessed using the HSI, FSI, and CNS.
The mean age in the NAFLD group was lower than that in the non-NAFLD group; however, a significant difference existed only between the groups defined by HSI (56 vs. 62 years, p < 0.001). Among the different age groups, those aged 50–59 years showed the highest number of patients with NAFLD, with significant differences only among the HSI-defined NAFLD group.
Patients with NAFLD were more likely to have a higher number of individuals with hypertension and higher FBG, HbA1C, or liver transferase levels than those without NAFLD. Weight-related parameters, including BMI, WC, and the number of those with obesity, were significantly higher in the NAFLD group than in the non-NAFLD group in all the three prediction models.
Serum vitamin levels according to the NAFLD status assessed using the HSI, FSI and CNS
The mean values of the serum vitamin A, E, and folate levels according to the NAFLD status assessed using the three models in the total population are shown in Table 2. Stratification was based on two baseline factors: obesity and the elderly (defined as aged 65 years or older). The analysis of the obese population using the CNS model was not performed since all the obese individuals had CNS scores of 40 or above and were classified as the NAFLD group.
Table 2 Serum vitamin levels according to NAFLD status assessed using the HSI, FSI, and CNS.
There were no significant differences in the serum vitamin A levels between the NAFLD and non-NAFLD groups when assessed using the HSI and FSI. However, when NAFLD was assessed using the CNS in the total population, vitamin A levels were significantly higher in the NAFLD group than in the non-NAFLD group. The trend of higher serum vitamin A levels in the CNS-defined NAFLD group remained significant, except in the elderly group.
In the total population, the mean serum vitamin E level was significantly higher in the NAFLD group than in the non-NAFLD group in the FSI and CNS models. The results were consistent regardless of obesity or age. When NAFLD was defined based on the HSI, the vitamin E level was significantly higher in the NAFLD group than in the non-NAFLD group in the non-obese and non-elderly population.
There were no significant differences in the serum folate levels according to the NAFLD status, not only in the total population, but also in the stratified analysis. The mean serum folate level was significantly lower in the FSI-based NAFLD group than in the non-NAFLD group; however, this was only observed in the obese group (7.05 vs. 8.94 ng/mL, p = 0.037).
Association between the serum vitamins levels and NAFLD assessed by the HSI, FSI, and CNS
Serum vitamin A, E, and folate levels were classified into quartile groups (Q1: the lowest quartile, Q4: the highest quartile) to examine the association between the serum vitamin levels and NAFLD assessed using three models (HSI, FSI, and CNS). AORs and 95% CIs were calculated using multivariate logistic regression analysis (Table 3). The mean values of the serum vitamin levels according to each quartile are also presented in Table 3.
Table 3 Association between the serum vitamin A, vitamin E, and folate levels and NAFLD.
After adjusting for possible confounders of vitamin status, higher serum vitamin A levels were significantly associated with an increased risk of NAFLD when assessed using the CNS. The AORs of NAFLD increased as the quartiles of the vitamin A levels increased (p for trend < 0.001). The NAFLD risk in the highest quartile of vitamin A (Q4) was 4.92 times higher compared to that in the lowest quartile (Q1) (AOR = 4.92, 95% CI 1.83–13.24).
Similar to vitamin A, a significant association between higher serum vitamin E levels and increased risk of NAFLD was observed in the FSI and CNS models. The risk of FSI-defined NAFLD was 5.54 times higher in Q4 than in Q1 (AOR = 5.54, 95% CI 2.43–12.62), and 3.10 times higher risk of CNS-defined NAFLD was observed in Q3 than in Q1 (AOR = 3.10, 95% CI 1.01–9.48).
In contrast, the serum folate level was inversely associated with the risk of NAFLD in all the three prediction models; however, the results were not statistically significant. The risk of NAFLD decreased as the quartiles of folate level increased; however, the _p_-value for the trend was not significant.
Discussion
In the current study, we investigated the association between serum vitamin levels and NAFLD in Korean adults with diabetes mellitus, using data from the 7th KNHANES. Our main result revealed that serum vitamin E levels were higher in individuals with NAFLD compared to those without the condition. This trend was consistent, irrespective of obesity or age. Additionally, the risk of NAFLD was positively associated with elevated levels of serum vitamins A and E, even after adjusting for potential confounding factors. However, there was no notable association between serum folate levels and the risk of NAFLD.
Vitamin A is a lipophilic vitamin that exhibits both antioxidant and anti-inflammatory activities. Previous studies have explored the possible association between serum levels of vitamin A and NAFLD. For instance, Coelho et al. observed significantly lower serum retinol levels in patients with NAFLD who have advanced hepatic fibrosis than in those without advanced hepatic fibrosis14. In addition, it has been reported that the serum retinoic acid concentration gradually decreases as the hepatic steatosis worsens15.
In contrast to these findings, our study found that serum vitamin A levels were significantly higher in the NAFLD group than in the non-NAFLD group, based on the CNS. We believe that the baseline serum vitamin A level in the study population resulted in the discrepancies among the studies. In our study, most study participants had vitamin A levels within the reference range, with only 4.1% having vitamin A deficiency. Moreover, the mean concentration of serum retinol in our study was approximately two-fold higher compared to that of the study reporting a conflicting association (0.59 vs. 0.32 mg/L)14. Similar results were reported in a recent prospective study`, where higher serum vitamin A levels were associated with the progression of NAFLD16. This study found 4.5% of the total participants had vitamin A deficiency (defined as serum retinol < 0.3 mg/L), and their mean serum vitamin A concentration was comparable to ours (0.46 mg/L). Therefore, higher levels of serum vitamin A in our study participants, indicating better nutritional status than in other studies, might explain the different trends in the association between vitamin A and NAFLD.
Moreover, the association between the serum vitamin A levels and NAFLD is affected by NAFLD progression. Vitamin A is primarily stored in hepatic stellate cells (HSCs), which play an important role in regulating the homeostasis of vitamin A. When HSCs are activated in the fibrogenic process induced by liver injury, they can release stored vitamin A into circulation17. This process may lead to a transient elevation in serum vitamin A levels during the early stages of liver injury18,19. Considering this complex metabolism of vitamin A, more studies are needed to validate the elusive association between serum retinol levels and NAFLD.
Vitamin E has been studied for its antifibrotic and anti-inflammatory effects in NAFLD treatment20. Accordingly, the latest guidelines recommend vitamin E as a treatment option for NAFLD8. However, its proven benefits have been primarily observed in non-diabetic non-alcoholic steatohepatitis (NASH). For example, Tsou et al. found an inverse association between serum vitamin E levels and NAFLD-related mortality in non-diabetic participants. The authors also demonstrated that patients with diabetes had higher serum vitamin E levels than those without diabetes21.
In the current study, we found that patients with diabetes mellitus and NAFLD had higher levels of serum vitamin E than those without NAFLD. Increased vitamin E levels were also identified as an independent risk factor for NAFLD in patients with diabetes22. Increased plasma α-tocopherol levels observed in NAFLD may be attributable to baseline comorbidities and lipid panels. It is known that serum α-tocopherol levels are positively correlated with serum cholesterol and triglyceride concentrations23. The participants included in our study comprised approximately 40% of patients with dyslipidemia, and higher circulating lipid concentrations could slow down the breakdown of α-tocopherol, leading to elevated plasma α-tocopherol levels21. Our findings suggest that vitamin E interventions for NAFLD treatment should take baseline vitamin E levels into account, particularly in patients with type 2 diabetes or obesity. who are likely to have elevated serum vitamin E levels.
Folate, one of the important B vitamins, functions in both one-carbon metabolism and lipid metabolism in the liver24. Several studies have examined whether serum folate levels are associated with NAFLD. Mahamid et al. found that low levels of folate are significantly associated with higher fibrosis grade in patients with biopsy-proven NASH13. Another study reported an association between reduced plasma folate levels and higher serum lipids and HSI; however, the result was significant only in participants with a BMI > 25 kg/m2 25.
The findings from our study align with previous studies. While no significant difference in serum folate levels was observed across the total population, obese participants with FSI-defined NAFLD had lower mean serum folate levels than their non-NAFLD counterpart. The inverse relationship between serum folate levels and NAFLD can be explained by the hepatic lipid accumulation induced by folate deficiency26. Low folate levels may cause alteration of one-carbon metabolism and enhance the expression of genes related to lipid synthesis, eventually promoting fat accumulation in the liver27. In fact, low serum folate has been identified as an independent risk factor for NAFLD in the Chinese population28. Thus, nutritional interventions that focus on folate may be effective in managing the risk of NAFLD, especially in individuals with both obesity and diabetes mellitus.
The strengths of the present study are as follows. First, this study utilized a nationwide large-scale dataset acquired from the KNHANES. KNHANES is a population-based surveillance system that assesses the health and nutritional status of Koreans. Thus, our findings may be representative of the Korean population, with good generalizability. Second, we found a relationship between the serum vitamin levels and NAFLD in patients with diabetes, who are at greater risk of developing NAFLD compared to the non-diabetic population. Considering the limited studies on the diabetic population, this study is meaningful since we presented evidence related to vitamin levels in terms of NAFLD risk management for patients with diabetes mellitus. Lastly, we conducted stratified analysis based on whether the participants were obese or elderly, which showed consistent results for vitamins A and E. Additional analysis within the obese and elderly population has added meaning to our findings in terms of clinical implications for special populations.
Despite these strengths, our study has several limitations. First, NAFLD was defined based on clinical data only, without diagnostic information from imaging tests or biopsies, which were not available in the data we used. This may have affected the accuracy of diagnosis and reproducibility of the results. To address this, we applied three different NAFLD prediction models to obtain robust results, including well-validated screening tools in the Korean population. Second, while nutritional intake is a key determinant of blood vitamin levels, intake data were only available for vitamin A among vitamin A, E, and folate within the KNHANES database. Recognizing this limitation, we included a range of relevant covariates available in the database, including information on dietary supplement use. Third, most of our study population had serum vitamin levels within the reference range, with few participants showing deficiencies in vitamin A, vitamin E, and folate. Therefore, our findings should be interpreted with caution, as we investigated the effects of relatively higher or lower serum vitamin levels rather than deficiency-related effects. This may limit the clinical implications of this study in supporting supplementation or limitation of certain vitamins. Finally, the cross-sectional study design limits our ability to establish causality, and prospective studies with larger populations are warranted to confirm causal relationships.
Conclusions
In conclusion, our study demonstrated that serum vitamin E levels were higher in patients with NAFLD than in those without NAFLD among a Korean diabetic population. Furthermore, both elevated serum vitamin A and E levels were positively associated with an increased risk of NAFLD, while serum folate levels showed no significant association with NAFLD. These findings suggest that higher levels of specific micronutrients, particularly vitamins A and E, may play a role in the development or progression of NAFLD in individuals with diabetes. Given the complex metabolic interactions of these vitamins, especially in relation to lipid metabolism and liver function, our results underscore the need for personalized nutritional strategies in managing NAFLD risk among diabetic patients.
Materials and methods
Data information
We conducted a cross-sectional study using data from the Korean National Health and Nutrition Examination Survey (KNHANES) 2016–2018. KNHANES is a nationwide epidemiological study conducted by the Korea Disease Control and Prevention Agency (KDCA) and provides various health-related information, such as laboratory test results and physical examination results29.
The study protocol was approved by the Institutional Review Board of Sookmyung Women’s University (IRB number: SMWU-2107-HR-063), and the requirement for informed consent was waived since the data were anonymized.
Study population
From a total of 24,269 participants in the KNHANES 7th database, we included Korean adults with diabetes mellitus. Participants were defined as having diabetes if they met one of the following criteria: (a) HbA1c ≥ 6.5% (48 mmol/mol) or fasting blood glucose (FBG) ≥ 126 mg/dL, (b) those with a diagnosis of diabetes by a physician, or (c) those who took antidiabetic drugs on the day of examination. Exclusion criteria included pregnant women, those with excessive daily intake of vitamin A or folate (> 3,000 µg of retinol activity equivalents [RAE] or > 1,000 µg of dietary folate equivalents [DFE], respectively), and those with a previous history of hepatitis B or C, liver cirrhosis, or alcohol use disorder. A history of each liver-related underlying disease was defined as a ‘yes’ response on the questionnaire regarding past medical diagnoses, and a history of alcohol use disorder was defined as a ‘yes’ response on the questionnaire asking whether the individual had ever consulted for alcohol-related issues. We also excluded individuals with missing data.
Diagnostic models for NAFLD
NAFLD was assessed based on the following validated prediction models: the hepatic steatosis index (HSI), Framingham steatosis index (FSI), and comprehensive NAFLD score (CNS). These are simple and non-invasive indices used for screening NAFLD. NAFLD was defined based on the following cut-off values for each score: HSI > 36, FSI ≥ 23, or CNS ≥ 40 30,31,32.
Formulae for each diagnostic model are shown below:
- HSI = 8 × alanine aminotransferase (ALT)/aspartate aminotransferase (AST) ratio + BMI (+ 2 if type 2 diabetes; +2 if female).
- FSI = ex/ (1 + ex), where x = − 7.981 + 0.011 × age (years) − 0.146 × sex (female = 1, male = 0) + 0.173 × BMI (kg/m2) + 0.0077 × triglycerides (TG) (mg/dL) + 0.593 × hypertension (yes = 1, no = 0) + 0.789 × diabetes (yes = 1, no = 0) + 1.1 × ALT/AST ratio ≥ 1.33 (yes = 1, no = 0).
- CNS = 1/ (1 + e-x) × 100, where x =.
- for men, x = 0.016 × age (years) + 0.182 × BMI (kg/m2) + 0.089 × waist circumference (WC) (cm) + 0.391 × alcohol (yes = 1, no = 0) + 0.124 × exercise (yes = 0, no = 1) + 0.018 × FBG (mg/dL) + 0.773 × loge (TG [mg/dL]) − 0.014 × high-density lipoprotein cholesterol (HDL-C) (mg/dL) + 0.145 × uric acid (mg/dL) − 0.674 × loge (AST [IU/L]) + 1.632 × loge (ALT [IU/L]) − 21.695.
- for women, x = 0.320 × BMI (kg/m2) + 0.044 × WC (cm) + 0.533 × diabetes (yes = 1, no = 0) + 0.016 × FBG (mg/dL) + 0.951 × loge (TG [mg/dL]) − 0.015 × HDL-C (mg/dL) + 0.199 × uric acid (mg/dL) − 0.645 × loge (AST [IU/L]) + 1.302 × loge (ALT [IU/L]) + 0.255× menopause (yes = 1, no = 0) − 19.741.
Measurement of the serum vitamin levels
Serum vitamin A (retinol) and vitamin E (α-tocopherol) levels were measured with Agilent1200 (Agilent Technologies Inc., USA) using high-performance liquid chromatography-flame ionization detector Serum folate levels were measured using ARCHITECT i4000Sr (Abbott Laboratories, USA) with chemiluminescent microparticle immunoassay. The cut-off values to define vitamin deficiency were set as follows: serum vitamin A < 0.2 mg/L, serum vitamin E < 5 mg/L, and serum folate < 4 ng/mL33,34,35.
Definitions of the variables of interest
Obesity was defined using BMI and WC. Those with a BMI ≥ 30 kg/m2 or those with abdominal obesity (WC ≥ 90 cm in males, WC ≥ 85 cm in females) with BMI ≥ 25 kg/m2 were classified into the obese group36.
Definitions of the variables included in the NAFLD prediction were as follows: patients with hypertension were defined as those who met one of the following criteria: (a) systolic blood pressure (SBP) ≥ 140 mmHg or diastolic blood pressure (DBP) ≥ 90 mmHg, (b) history of diagnosis of hypertension by a physician, or (c) patients who took antihypertensive drugs on the day of the examination37. Alcohol consumption status was categorized into three groups: (a) non-drinkers, those who did not consume alcohol for the past year; (b) heavy drinkers, defined as men who drink ≥ 7 standard unit drinks or women who drink ≥ 5 standard unit drinks ≥ 2 times per week; and others were classified as (c) current drinkers. Regular exercise status was determined as yes if the participant met either one of the following: (a) resistance exercise ≥ 1 time weekly, or (b) ≥ 150 min of moderate-intensity physical activities, or ≥ 75 min of high-intensity physical activities or mixed activities (1 min of high-intensity activity is equivalent to 2 min of moderate-intensity activity).
The covariates included in the analysis were as follows: the presence of dyslipidemia was considered in those with a physician’s diagnosis. Smoking status was divided into three groups: (a) non-smokers, those who had never smoked; (b) past smokers, those who had smoked < 100 cigarettes in their lifetime or those who had smoked ≥ 100 cigarettes in the past but not now; and others were classified into (c) current smokers. Dietary data were surveyed using the 24-hour recall method. Vitamin A intake was measured using retinol equivalents (RE): RE (µg) = retinol (µg) + β-carotenes/6 (µg), according to the Dietary Reference Intakes for Koreans criteria38. Supplement use was determined as yes if the participant had taken dietary supplements for more than two weeks over the past year.
Statistical analysis
To evaluate the differences in the baseline characteristics between the NAFLD and non-NAFLD groups, we used independent Student’s t-tests for continuous variables and chi-square tests for categorical variables. Data are presented as mean ± standard error or number (weighted percentage). Comparison of the serum vitamin levels between the NAFLD and non-NAFLD groups was performed using t-tests. In addition, stratified analysis was performed based on two baseline factors, obesity and elderly, to investigate the consistency of the results across the subgroups.
Participants were classified into quartiles of serum vitamin A, E, or folate levels, with Q1 being the lowest and Q4 being the highest quartile of each serum vitamin level (Q1–Q4). Multivariate logistic regression was performed to investigate the association between the risk of NAFLD and serum vitamin levels. The adjusted odds ratios (AORs) of NAFLD and 95% confidence intervals (CIs) were calculated with the lowest quartile set as a reference. The regression model was adjusted for smoking status, HbA1c, total cholesterol, dyslipidemia, total energy intake, and supplement use. The dietary intake of vitamin A or folate was added as a covariate in the analysis of each vitamin.
All the statistical analyses were performed using SPSS ver. 25.0 (IBM Corp., Armonk, NY, USA), and results were considered statistically significant at p < 0.05.
Data availability
This study utilized secondary data from the Korean National Health and Nutrition Examination Survey (KNHANES) database. The data is publicly available and can be accessed through the official KNHANES website. As the research involved only the analysis of existing data, there was no direct interaction with human subjects.
References
- Younossi, Z. et al. Global perspectives on nonalcoholic fatty liver disease and nonalcoholic steatohepatitis. Hepatology 69, 2672–2682 (2019).
PubMed MATH Google Scholar - Pihoker, C. et al. Prevalence, characteristics and clinical diagnosis of maturity onset diabetes of the young due to mutations in HNF1A, HNF4A, and glucokinase: Results from the SEARCH for diabetes in youth. J. Clin. Endocrinol. Metabolism. 98, 4055–4062 (2013).
CAS MATH Google Scholar - Younossi, Z. & Henry, L. Contribution of alcoholic and nonalcoholic fatty liver disease to the burden of liver-related morbidity and mortality. Gastroenterology 150, 1778–1785 (2016).
PubMed MATH Google Scholar - Targher, G., Corey, K. E., Byrne, C. D. & Roden, M. The complex link between NAFLD and type 2 diabetes mellitus—mechanisms and treatments. Nat. Rev. Gastroenterol. Hepatol. 18, 599–612 (2021).
Google Scholar - Kim, C. H., Park, J. Y., Lee, K. U., Kim, J. H. & Kim, H. K. Fatty liver is an independent risk factor for the development of type 2 diabetes in Korean adults. Diabet. Med. 25, 476–481 (2008).
CAS PubMed MATH Google Scholar - Younossi, Z. M. et al. The global epidemiology of NAFLD and NASH in patients with type 2 diabetes: A systematic review and meta-analysis. J. Hepatol. 71, 793–801 (2019).
PubMed MATH Google Scholar - Lee, B. W. et al. Non-Alcoholic Fatty Liver Disease in Patients with Type 2 Diabetes Mellitus: A Position Statement of the Fatty Liver (Research Group of the Korean Diabetes Association, 2020).
- Hur, K. Y. et al. 2021 Clinical practice guidelines for diabetes mellitus in Korea. Diabetes Metabol. J. 45, 461–481 (2021).
MATH Google Scholar - Chalasani, N. et al. The diagnosis and management of nonalcoholic fatty liver disease: Practice guidance from the American association for the study of liver diseases. Hepatology 67, 328–357 (2018).
PubMed MATH Google Scholar - Pickett-Blakely, O., Young, K. & Carr, R. M. Micronutrients in nonalcoholic fatty liver disease pathogenesis. Cell. Mol. Gastroenterol. Hepatol. 6, 451–462 (2018).
PubMed PubMed Central MATH Google Scholar - Erhardt, A. et al. Plasma levels of vitamin E and carotenoids are decreased in patients with nonalcoholic steatohepatitis (NASH). Eur. J. Med. Res. 16, 76–78 (2011).
CAS PubMed PubMed Central MATH Google Scholar - Wang, L., Ding, C., Zeng, F. & Zhu, H. Low levels of serum β-carotene and β-carotene/retinol ratio are associated with histological severity in nonalcoholic fatty liver disease patients. Ann. Nutr. Metabolism. 74, 156–164 (2019).
CAS Google Scholar - Mahamid, M. et al. Folate and B12 levels correlate with histological severity in NASH patients. Nutrients 10, 440 (2018).
PubMed PubMed Central Google Scholar - Coelho, J. M. et al. Association between serum and dietary antioxidant micronutrients and advanced liver fibrosis in non-alcoholic fatty liver disease: An observational study. PeerJ 8, e9838 (2020).
PubMed PubMed Central Google Scholar - Liu, Y. et al. Association of serum retinoic acid with hepatic steatosis and liver injury in nonalcoholic fatty liver disease. Am. J. Clin. Nutr. 102, 130–137 (2015).
ADS CAS PubMed MATH Google Scholar - Xiao, M. et al. Higher serum vitamin A is associated with a worsened progression of non-alcoholic fatty liver disease in adults: A prospective study. Food Funct. 13, 970–977 (2022).
CAS PubMed MATH Google Scholar - Tanumihardjo, S. A. Assessing vitamin A status: Past, present and future. J. Nutr. 134, 290S–293S (2004).
CAS PubMed Google Scholar - Senoo, H., Mezaki, Y. & Fujiwara, M. The stellate cell system (vitamin A-storing cell system). Anat. Sci. Int. 92, 387–455 (2017).
CAS PubMed MATH Google Scholar - Saeed, A., Dullaart, R. P., Schreuder, T. C., Blokzijl, H. & Faber, K. N. Disturbed vitamin A metabolism in non-alcoholic fatty liver disease (NAFLD). Nutrients 10, 29 (2017).
PubMed PubMed Central Google Scholar - Perumpail, B. J. et al. The role of vitamin E in the treatment of NAFLD. Diseases 6, 86 (2018).
CAS PubMed PubMed Central MATH Google Scholar - Tsou, P. & Wu, C. J. Serum vitamin E levels of adults with nonalcoholic fatty liver disease: An inverse relationship with all-cause mortality in non-diabetic but not in pre-diabetic or diabetic subjects. J. Clin. Med. 8, 1057 (2019).
CAS PubMed PubMed Central Google Scholar - White, E. et al. Correlates of serum α-and γ-tocopherol in the women’s health initiative. Ann. Epidemiol. 11, 136–144 (2001).
CAS PubMed MATH Google Scholar - Traber, M. G. et al. α-Tocopherol disappearance rates from plasma depend on lipid concentrations: Studies using deuterium-labeled collard greens in younger and older adults. Am. J. Clin. Nutr. 101, 752–759 (2015).
CAS PubMed PubMed Central MATH Google Scholar - Lyon, P., Strippoli, V., Fang, B. & Cimmino, L. B vitamins and one-carbon metabolism: Implications in human health and disease. Nutrients 12, 2867 (2020).
CAS PubMed PubMed Central MATH Google Scholar - Młodzik-Czyżewska, M. A., Szwengiel, A., Malinowska, A. M. & Chmurzynska, A. Comparison of associations between one-carbon metabolism, lipid metabolism, and fatty liver markers in normal-weight and overweight people aged 20–40 years. Annals Nutr. Metabolism. 77, 221–230 (2021).
Google Scholar - Sid, V., Siow, Y. L. & O, K. Role of folate in nonalcoholic fatty liver disease. Can. J. Physiol. Pharmacol. 95, 1141–1148 (2017).
CAS PubMed MATH Google Scholar - Raza, S., Tewari, A., Rajak, S. & Sinha, R. A. Vitamins and non-alcoholic fatty liver disease: A molecular insight. Liver Res. 5, 62–71 (2021).
CAS PubMed PubMed Central Google Scholar - Xia, M. F. et al. Serum folic acid levels are associated with the presence and severity of liver steatosis in Chinese adults. Clin. Nutr. 37, 1752–1758 (2018).
CAS PubMed MATH Google Scholar - Kweon, S. et al. Data resource profile: The Korea National health and nutrition examination survey (KNHANES). Int. J. Epidemiol. 43, 69–77 (2014).
PubMed PubMed Central Google Scholar - Lee, J. H. et al. Hepatic steatosis index: A simple screening tool reflecting nonalcoholic fatty liver disease. Dig. Liver Disease. 42, 503–508 (2010).
CAS MATH Google Scholar - Long, M. T. et al. Development and validation of the Framingham steatosis index to identify persons with hepatic steatosis. Clin. Gastroenterol. Hepatol. 14, 1172–1180 (2016). e1172.
PubMed PubMed Central MATH Google Scholar - Lee, Y. et al. Non–laboratory-based self-assessment screening score for non-alcoholic fatty liver disease: Development, validation and comparison with other scores. PloS One. 9, e107584 (2014).
ADS PubMed PubMed Central Google Scholar - De Pee, S. & Dary, O. Biochemical indicators of vitamin A deficiency: Serum retinol and serum retinol binding protein. J. Nutr. 132, 2895S–2901S (2002).
PubMed Google Scholar - Cuerq, C. et al. Establishment of reference values of α-tocopherol in plasma, red blood cells and adipose tissue in healthy children to improve the management of chylomicron retention disease, a rare genetic hypocholesterolemia. Orphanet J. Rare Dis. 11, 1–10 (2016).
Google Scholar - World Health Organization. Serum and Red Blood Cell Folate Concentrations for Assessing Folate Status in Populations (World Health Organization, 2015).
- Kim, B. Y. et al. Korean Society for the study of obesity guidelines for the management of obesity in Korea. J. Obesi. Metabol. Syndrome 30, 81 (2020).
- Lee, H. Y. et al. Korean Society of Hypertension Guidelines for the management of hypertension: part II-diagnosis and treatment of hypertension. Clin. Hypertens. 25, 1–24 (2018).
- Korean Nutrition Society. (The Korean Nutrition Society Seoul (2010).
Acknowledgements
This work was supported by the National Research Foundation of Korea (NRF) grant funded by the Korean government (MSIT) [Grant Number NRF-2021R1F1A1052976].
Author information
Authors and Affiliations
- College of Pharmacy, Sookmyung Women’s University, Cheongpa-ro 47-gil 100, Yongsan-gu, Seoul, 04310, Republic of Korea
Choungwon Jung, Soyoung Park & Hyunah Kim - Drug Information Research Institute, Sookmyung Women’s University, Seoul, Republic of Korea
Hyunah Kim
Authors
- Choungwon Jung
- Soyoung Park
- Hyunah Kim
Contributions
Conceptualization: CWJ, SYP, HK. Investigation: CWJ, SYP, HK. Methodology: CWJ, SYP, HK. Supervision: HK. Writing – original draft: CWJ, SYP. Writing – review & editing: HK.
Corresponding author
Correspondence toHyunah Kim.
Ethics declarations
Competing interests
The authors declare no competing interests.
Additional information
Publisher’s note
Springer Nature remains neutral with regard to jurisdictional claims in published maps and institutional affiliations.
Rights and permissions
Open Access This article is licensed under a Creative Commons Attribution-NonCommercial-NoDerivatives 4.0 International License, which permits any non-commercial use, sharing, distribution and reproduction in any medium or format, as long as you give appropriate credit to the original author(s) and the source, provide a link to the Creative Commons licence, and indicate if you modified the licensed material. You do not have permission under this licence to share adapted material derived from this article or parts of it. The images or other third party material in this article are included in the article’s Creative Commons licence, unless indicated otherwise in a credit line to the material. If material is not included in the article’s Creative Commons licence and your intended use is not permitted by statutory regulation or exceeds the permitted use, you will need to obtain permission directly from the copyright holder. To view a copy of this licence, visit http://creativecommons.org/licenses/by-nc-nd/4.0/.
About this article
Cite this article
Jung, C., Park, S. & Kim, H. Association between vitamin A, E, and folate levels and risk of non-alcoholic fatty liver disease in adults with diabetes mellitus.Sci Rep 15, 11844 (2025). https://doi.org/10.1038/s41598-025-96500-x
- Received: 26 October 2024
- Accepted: 28 March 2025
- Published: 07 April 2025
- Version of record: 07 April 2025
- DOI: https://doi.org/10.1038/s41598-025-96500-x