A dataset of forest biomass structure for Eurasia (original) (raw)
Background & Summary
Biomass is an important indicator of terrestrial vegetation and as such, is recognised as an Essential Climate Variable1 and an Essential Biodiversity Variable2. The link between biodiversity, tree species distribution and biomass3 as well as the biodiversity-productivity relationship4 are well recognised. Moreover, biomass is mentioned in six out of the seventeen UN Sustainable Development Goals5. Remote sensing is one of the most common approaches to estimate forest biomass and its dynamics over large areas. This includes measurements of canopy cover, vegetation status from different indexes, canopy height and forest structure6,7. However, there are no remote methods that can measure biomass density and the biomass structure by component, which can only be obtained from ground measurements. This is why field measurements are so crucial, i.e., they are the most accurate ways to learn about biomass structure, and they are needed to calibrate remote sensing instruments, model the carbon cycle, and assess forest productivity, among other uses.
Yet the sharing of biomass measurements has traditionally been highly problematic. Most researchers prefer to keep the raw data confidential and publish only the aggregated results or a limited number of the measured parameters. There are some reasons that can explain this situation. First of all, the destructive sampling method (DSM) for making biomass measurements on sample plots is a very labour-intensive process so the considerable investment needed over time does not incentivise researchers to share the data. Secondly, in some cases, agreements are made between researchers and the owners of the plots, which have tended towards closed use of the data by individual research projects. Finally, many experiments and measurements were undertaken in a pre-internet era and may not have not been published in English. Therefore, preserved in paper format in different countries around the world, these measurements have not been readily accessible to the scientific community.
To help remedy this situation, we have collected the most comprehensive dataset of in situ forest biomass measurements in Eurasia estimated by the DSM. The dataset has been compiled from a combination of experiments undertaken by the authors and from scientific publications. Every record contains an accompanying reference. The dataset consists of 10,351 sample plots and 9,613 sample trees (Fig. 1) from ca 1,200 experiments undertaken over the period 1930–2014. Note that these two tables are not completely linked but there is some overlap, i.e., 6,280 trees are associated with 791 plots. All other plots have no trees associated with them or vice versa.
Figure 1: Location of sample trees and plots (Coordinate System: Asia north Albers equal area conic, central meridian 95° E).

The alternative text for this image may have been generated using AI.
The plot level dataset contains forest biomass structure per hectare, including live trees (stem, bark, branches, foliage, roots), understory (above- and below ground), green forest floor (above- and below ground) and coarse woody debris (snags, logs, dead branches of living trees and dead roots). Due to the compilation of quantities from diverse studies, some fractions (e.g., stem wood, foliage) are better represented than others (e.g., roots, green forest floor), which means that we reported only fractions where actual measurements were performed. In addition to biomass, we have recorded a number of other forest stand parameters where available, including tree species composition, average age, tree height, growing stock volume, etc. The tree level dataset consists of a description of the sample trees, their size and their biomass fractions (see Method section for more details).
The data presented here have been partly published before8–14, but never in a comprehensive, open access, electronic format that includes the full set of parameters. We have combined existing forest biomass datasets, removing duplicated records and merging complementary parameters to create a single fused product.
The dataset is complementary to existing datasets (e.g., refs 4,15) with almost no or little overlap observed. The dataset can be used for the development of models of biomass structure, allometric equations, biomass expansion factors (BEF), change detection of biomass structure, investigations into biodiversity and species distribution and the biodiversity-productivity relationship, and the assessment of the carbon pool and its dynamics, among others.
Methods
All the data presented here were collected by the DSM. The background prerequisite of the method is to follow the major requirements of a statistically sound sampling procedure. Sample plots should be representative of the selected forest unit and include 200–300 trees. Within sample plots, the diameter at breast height (DBH, which is usually at 1.3 m or 4.5 feet) is measured for each tree. The measurements of tree height are provided for 12–15 trees by species, selected proportionally to the number of trees by diameter class in order to develop height-diameter regression relationships. These and other reported results of the measurements allow for the estimation of basic biometric (mensuration) characteristics of stands such as tree species composition, age, average diameter and height, growing stock volume, etc. For the assessment of live biomass, a number of trees are selected, cut and measured, which is outlined in more detail as follows:
- The sample trees selected for destructive measurements (typically 5–15 per sample plot) should represent all tree species and the full variety of tree diameters at the sample plot.
- Trees are cut and measured for as accurate an estimation as possible of taper, age, volume, increment and other biometric characteristics.
- The wood and bark are sampled 5–10 times at different heights for every sample tree (usually as cross-sections of 2 to 3 cm in width).
- The crown of the sample trees is sampled to represent all the parts from the bottom to the top including the full range of branch sizes for further analysis (separating foliage and drying) as well as weighing, in both the fresh and oven dry states.
- Leaf area index was calculated through the size-to-mass ratio of the sample of foliage, upscaled to 1 ha with foliage biomass.
- In order to measure root biomass, soil sampling is employed to represent different distances from the stem and different depths10. The samples are washed with water in order to extract the roots, which are separated by whether they are dead/alive, tree/grass and by size. However, most of the field studies omit below ground investigations due to the very high labour-consuming nature of this work.
- The understory is accounted for in sub-plots usually of 2×2 m, regularly distributed over the plot. In the case of an unequal distribution of understory, mapping of the canopy windows is then recommended with a separate understory accounting in these windows and under the canopy. The numbers by plant species and height are recorded. The average representatives of each species and height class are harvested for further separation by biomass fraction, drying and weighing.
- The green forest floor is described and sampled for subsequent analysis at 1×1 m sub-plots.
- Coarse woody debris is accounted for by type (logs and snags), size (length and diameter), and the stage of decomposition, and is sampled accordingly.
The sampled patterns are delivered to laboratories, oven dried and weighed. The results are recorded in units of mass of dry matter. The methods mentioned above are described in detail in a number of publications, e.g., refs 10,16,17.
The data collected through the DSM can be found in Biomass_plot_DB.xlsx (plot data, Data Citation 1) and Biomass_tree_DB.xlsx (tree data, Data Citation 2).
Data Records
A list containing the fields and summary statistics is presented for the sample plot (Table 1) and tree (Table 2) datasets.
Table 1 Sample plot dataset: a list of the fields and descriptive statistics.
Table 2 Sample tree dataset: a list of the fields and descriptive statistics.
Sample plot data can be found in Biomass_plot_DB.xls (Data Citation 1).
Sample tree data can be found in Biomass_tree_DB.xls (Data Citation 2).
The linkage between the two tables is shown in Fig. 2.
Figure 2: Linkage between the plot and tree datasets.

The alternative text for this image may have been generated using AI.
Technical Validation
The dataset represents a range of countries (Table 3), biomes (Table 4) and tree species (Table 5). The most representative countries are Russia, Ukraine, China, and Kazakhstan (Table 3).
Table 3 Distribution of records by countries.
Table 4 Distribution of dataset records by biomes.
Table 5 Distribution of the number of records by tree genus.
Most of the observations fall in the Boreal and Temperate biomes (Table 4).
Pine forests have been sampled the most with 44% of the records (Table 5) followed by spruce (12%), birch (10%), larch (6%), poplar (5%) and oak (5%).
The DSM remains the most labour-costly and precise method of assessing forest biomass. The accuracy of the method and, consequently, the reliability of the presented biomass data depend on the number of sample trees. The error of the method has been estimated and documented in several studies10,18–20, in which sub-samples of the data were made from a comprehensive dataset, e.g., the entire harvest of all trees at the sample plot to investigate how the accuracy changed with sample size. The results show that the accuracy varies depending on the type of biomass parameter considered, i.e., the most reliable variable is the estimation of stem biomass (92–94%) while the least reliable are the crown (80–90%) and belowground (70–80%) biomass estimates.
We have provided a validation of the data by checking their consistency with expected ranges for these parameters. The distribution of forest biomass by major biomes is provided in Fig. 3, which shows reasonable variation with climatic condition.
Figure 3: Above ground biomass by biome.
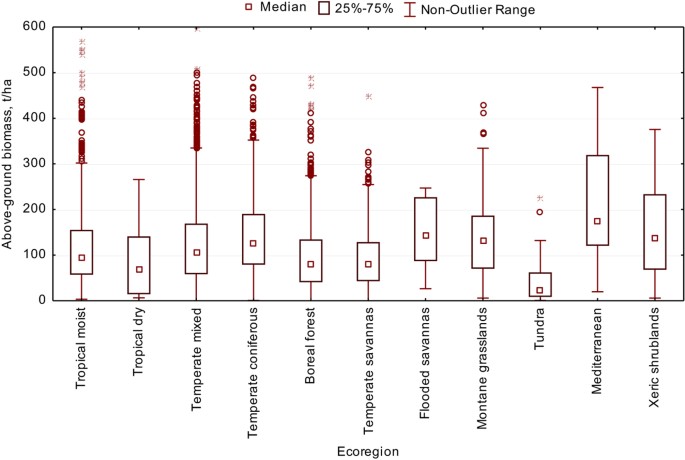
The alternative text for this image may have been generated using AI.
Relative indicators (especially BEF) are usually the most useful for validation. For example, wood density varies substantially with tree species (Fig. 4) and site index (Fig. 5), but stays within the expected range reported in a number of ecological publications (i.e., ref. 15).
Figure 4: Ratio of stem biomass to its volume for different tree genera.
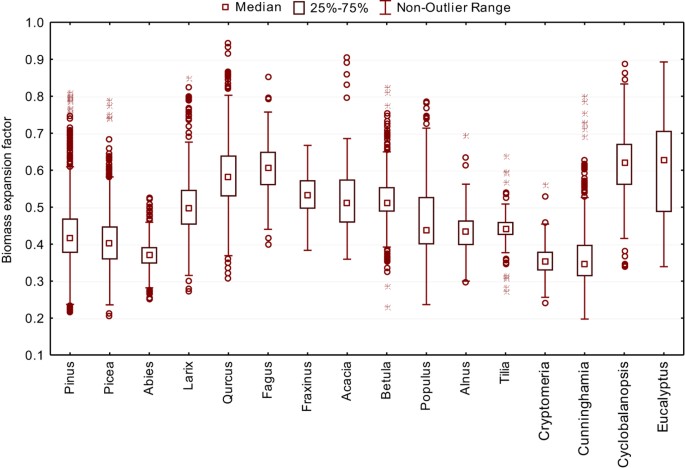
The alternative text for this image may have been generated using AI.
Figure 5: Ratio of stem biomass to its volume for different site indexes of pine stands.
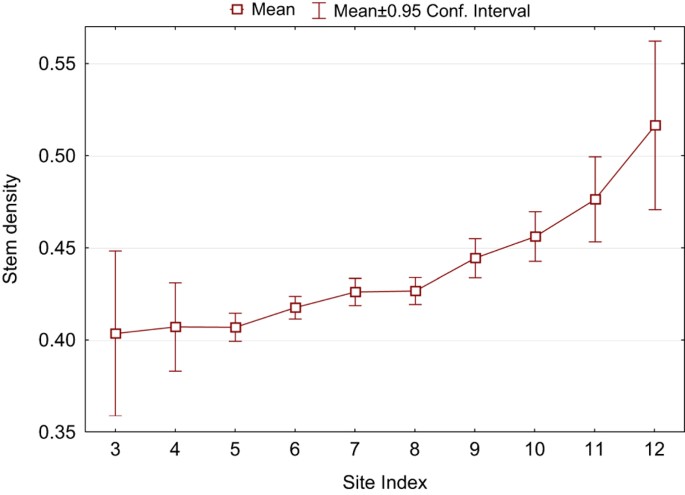
The alternative text for this image may have been generated using AI.
Site index 3 refers to an average stand height of 38.2–41.8 m at the age of 100 years old, while a site index of 12 refers to 4.8–8.4 m at the same age.
Figure 6 illustrates that the share of the crown biomass depends very much on the stand age, which is the expected relationship (e.g., refs 10,21).
Figure 6: The ratios of (a) branches and (a) foliage biomass to stem volume, which depend on forest age.
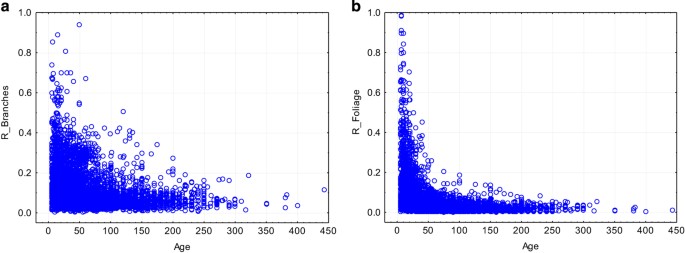
The alternative text for this image may have been generated using AI.
The distribution of the belowground live biomass is shown in Fig. 7. A larger below ground biomass share is typically observed in low biomass forests and/or tough site conditions.
Figure 7: Ratio of belowground to aboveground biomass, which depends on the (a) aboveground biomass value or (b) the site index.
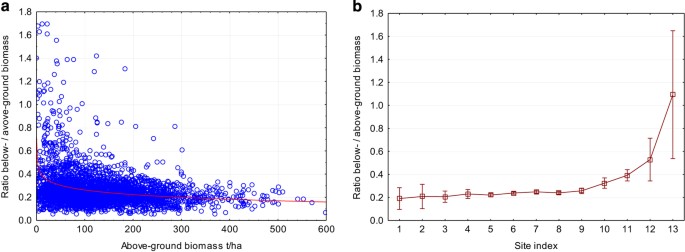
The alternative text for this image may have been generated using AI.
Some common relationships in the sample tree parameters are presented in Fig. 8. The outliers can be explained by the individual characteristics of the tree species and the climate gradient.
Figure 8: Sample trees: (a) the diameter/height dependence and (b) the biomass fractions against the stem volume.
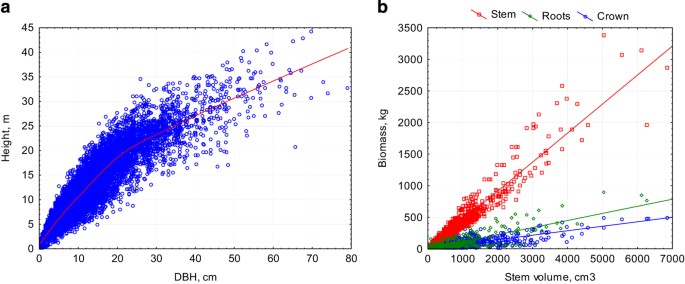
The alternative text for this image may have been generated using AI.
With respect to geographic and parametric representations, the data cover the forests of the major forest-forming species of Eurasia in a satisfactory way. The outliers (i.e., values outside the limits of an average of ±3 s.d.’s) are negligible but where present, they can usually be explained by age, site or climatic conditions, as well as by tree species. Overall the data demonstrate satisfactory consistency with reported ranges of national and zonal aggregations and regulations (e.g., yield tables22).
Usage Notes
The data are stored in Excel xlsx format. Sheets ‘Plot_db’ and ‘Tree_db’ contain the data records. The sheet ‘Species’ lists the tree species code, and the English and Latin names. The sheet ‘References’ contains a reference for every individual data record. The sheet ‘Field description’ describes the dataset fields and the data units.
The dataset can be used for a number of applications, but are not limited to the following examples. An early version of the dataset was used to develop models of biomass structure22,23, where the components of biomass (stem, branches, foliage, roots) were shown to be a function of age, site index, relative stocking and growing stock volume. Similar data collections for different regions have been utilised to derive BEF (e.g., ref. 24) and allometric equations (e.g., ref. 25). When the dataset contains long term measurements, there is then the possibility to track structural changes in the biomass (e.g., ref. 26).These types of data are also crucial for the assessment of the carbon pool and its dynamics (e.g., ref. 27). These data are also useful in biodiversity studies, e.g., to investigate relationships between biodiversity and species distribution (e.g., ref. 3), and the biodiversity-productivity relationship (e.g., ref. 4). Note that the data presented here are not suitable for the direct calibration/validation of products derived from remote sensing, because sample trees may have been cut down and the precision of the geographic coordinates, in many cases, does not allow for precise enough geolocation.
Additional Information
How to cite this article: Schepaschenko, D. et al. A dataset of forest biomass structure for Eurasia. Sci. Data. 4:170070 doi: 10.1038/sdata.2017.70 (2017).
Publisher’s note: Springer Nature remains neutral with regard to jurisdictional claims in published maps and institutional affiliations.
References
References
- Bojinski, S. et al. The Concept of Essential Climate Variables in Support of Climate Research, Applications, and Policy. Bull. Am. Meteorol. Soc. 95, 1431–1443 (2014).
Article ADS Google Scholar - Pereira, H. M. et al. Essential Biodiversity Variables. Science 339, 277–278 (2013).
Article CAS ADS Google Scholar - Hubbell, S. P. Light-Gap Disturbances, Recruitment Limitation, and Tree Diversity in a Neotropical Forest. Science 283, 554–557 (1999).
Article CAS ADS Google Scholar - Liang, J. et al. Positive biodiversity-productivity relationship predominant in global forests. Science 354, 196 (2016).
Article CAS Google Scholar - Müller, A. et al. The Role of Biomass in the Sustainable Development Goals: A Reality Check and Governance Implications 36 (IASS, 2015).
Google Scholar - Baccini, A. & Asner, G. P. Improving pantropical forest carbon maps with airborne LiDAR sampling. Carbon Manag. 4, 591–600 (2013).
Article CAS Google Scholar - Asner, G. P. et al. High-resolution mapping of forest carbon stocks in the Colombian Amazon. Biogeosciences 9, 2683–2696 (2012).
Article CAS ADS Google Scholar - Luo, Y., Zhang, X., Wang, X. & Lu, F. Biomass and its allocation of Chinese forest ecosystems. Ecology 95, 2026–2026 (2014).
Article Google Scholar - Usoltsev, V. A. Forest biomass and primary production database for Eurasia (Ural State Forest Engineering University, 2013).
Google Scholar - Usoltsev, V. A. Biological productivity of north Eurasian forests: methods, database and its applications (Ural Branch of Russian Academy of Science, 2007).
Google Scholar - Shvidenko, A., Schepaschenko, D., McCallum, I. & Nilsson, S. Russian Forests and Forestry. http://www.iiasa.ac.at/Research/FOR/forest_cdrom (2007).
- Schepaschenko, D., Shvidenko, A. & Lakyda, P. Database on live biomass structure of Russian forest. IVUZ Lesn. Zhurnal 4, 80–86 (2005).
Google Scholar - Lakyda, P. I., Vasylyshyn, R. D. & Blyschyk, V. I. Coniferous forest of Ukraine: experimental data on live biomass (FOP Gavrishenko, 2016).
Google Scholar - Usoltsev, V. Single-tree biomass data for remote sensing and ground measuring of Eurasian forests. CD-version in English and Russian (Ural State Forest Engineering University, 2016).
Google Scholar - Falster, D. S. et al. BAAD: a Biomass And Allometry Database for woody plants. Ecology 96, 1445–1445 (2015).
Article Google Scholar - Snowdon, P. et al. Protocol for sampling tree and stand biomass. Technical report 31 (Australian Greenhouse Office, 2002).
Google Scholar - Picard, N., Saint-André, L. & Henry, M. Manual for building tree volume and biomass allometric equations: from field measurement to prediction 215 (Food and Agricultural Organization of the United Nations, Rome, and Centre de Coopération Internationale en Recherche Agronomique pour le Développement, Montpellier, 2012).
Google Scholar - Usoltsev, V. A. Growth and structure of forest live biomass (Nauka, 1988).
Google Scholar - Utkin, A. I., Rozhdestvenskiy, S. G. & Gulbe, Y. I. Investigation of biomass production structure of forest (Nauka, 1988).
Google Scholar - Semechkina, M. G. Live biomass structure of pine forest (Nauka, 1978).
Google Scholar - Shvidenko, A., Schepaschenko, D., Nilsson, S. & Bouloui, Y. Semi-empirical models for assessing biological productivity of Northern Eurasian forests. Ecol. Model. 204, 163–179 (2007).
Article Google Scholar - Shvidenko, A. Z., Schepaschenko, D. G., Nilsson, S. & Buluy, Y. I. Tables and models of growth and productivity of forests of major forest forming species of Northern Eurasia. Standard and reference materials (Federal agency of forest management of Russian Federation, 2008).
Google Scholar - Usoltsev, V. A. Forest biomass of Northern Eurasia: mensuration standards and geography (Ural Branch of RAS, 2002).
Google Scholar - Petersson, H. et al. Individual tree biomass equations or biomass expansion factors for assessment of carbon stock changes in living biomass—A comparative study. For. Ecol. Manag 270, 78–84 (2012).
Article Google Scholar - Chave, J. et al. Improved allometric models to estimate the aboveground biomass of tropical trees. Glob. Change Biol. 20, 3177–3190 (2014).
Article ADS Google Scholar - Lapenis, A., Shvidenko, A., Shepaschenko, D., Nilsson, S. & Aiyyer, A. Acclimation of Russian forests to recent changes in climate. Glob. Change Biol. 11, 2090–2102 (2005).
Article ADS Google Scholar - Pan, Y. et al. A large and persistent carbon sink in the world’s forests. Science 333, 988–993 (2011).
Article CAS ADS Google Scholar - Olson, D. M. et al. Terrestrial Ecoregions of the World: A New Map of Life on Earth. BioScience. 51, 933 (2001).
Article Google Scholar
Data Citations
- Schepaschenko, D. PANGAEA https://doi.pangaea.de/10.1594/PANGAEA.871465 (2017)
- Schepaschenko, D. PANGAEA https://doi.pangaea.de/10.1594/PANGAEA.871491 (2017)
Acknowledgements
This study has been partly supported by the DUE GLOBBIOMASS (contract 4000113100/14/l-NB) and IFBN (contract 4000114425/15/NL/FF/gp) projects funded by ESA.
Author information
Authors and Affiliations
- Ecosystems Services and Management Program, International Institute for Applied Systems Analysis, Laxenburg, A-2361, Austria
Dmitry Schepaschenko, Anatoly Shvidenko, Linda See, Ian McCallum, Steffen Fritz, Florian Kraxner & Michael Obersteiner - Forestry Faculty, Bauman Moscow State Technical University, Mytischi, 141005, Russia
Dmitry Schepaschenko - Institute of Forest Siberian Branch Russian Academy of Sciences, Akademgorodok, Krasnoyarsk, 66036, Russia
Anatoly Shvidenko - Ural Division, Botanical Garden, Russian Academy of Sciences, Yekaterinburg, 620144, Russia
Vladimir Usoltsev - National University of Life and Environmental Sciences of Ukraine, Kyiv, 03041, Ukraine
Petro Lakyda, Roman Vasylyshyn & Ivan Lakyda - Department of Ecology, School of Horticulture and Plant Protection, Yangzhou University, Yangzhou, 225009, China
Yunjian Luo - Ukrainian National Forestry University, Gen. Chuprynka str. 103, Lviv, 79057, Ukraine
Yuriy Myklush
Authors
- Dmitry Schepaschenko
- Anatoly Shvidenko
- Vladimir Usoltsev
- Petro Lakyda
- Yunjian Luo
- Roman Vasylyshyn
- Ivan Lakyda
- Yuriy Myklush
- Linda See
- Ian McCallum
- Steffen Fritz
- Florian Kraxner
- Michael Obersteiner
Contributions
D.S. and A.S. wrote the first draft of the manuscript with input from all the co-authors. All authors contributed to the data compilation, with major endowments by V.U. (entire Eurasia), P.L. (Ukraine) and Y.L. (China). Own field data provided by V.U. (Kazakhstan, Ural, and Siberia); P.L., R.V., I.L. (Ukraine); Y.L. (China); D.S. (Sakha Republic).
Corresponding author
Correspondence toDmitry Schepaschenko.
Ethics declarations
Competing interests
The authors declare no competing financial interests.
ISA-Tab metadata
Rights and permissions
This article is licensed under a Creative Commons Attribution 4.0 International License, which permits use, sharing, adaptation, distribution and reproduction in any medium or format, as long as you give appropriate credit to the original author(s) and the source, provide a link to the Creative Commons license, and indicate if changes were made. The images or other third party material in this article are included in the article's Creative Commons license, unless indicated otherwise in a credit line to the material. If material is not included in the article's Creative Commons license and your intended use is not permitted by statutory regulation or exceeds the permitted use, you will need to obtain permission directly from the copyright holder. To view a copy of this license, visit http://creativecommons.org/licenses/by/4.0/ The Creative Commons Public Domain Dedication waiver http://creativecommons.org/publicdomain/zero/1.0/ applies to the metadata files made available in this article.
About this article
Cite this article
Schepaschenko, D., Shvidenko, A., Usoltsev, V. et al. A dataset of forest biomass structure for Eurasia.Sci Data 4, 170070 (2017). https://doi.org/10.1038/sdata.2017.70
- Received: 06 February 2017
- Accepted: 10 April 2017
- Published: 16 May 2017
- DOI: https://doi.org/10.1038/sdata.2017.70