Stage specificity of novel growth factor expression during development of proliferative vitreoretinopathy (original) (raw)
Introduction
Proliferative vitreoretinopathy (PVR) is the leading complication of retinal detachment surgery. PVR is identified by a growth of a fibrous membrane either on the subretinal or epiretinal surface of the eye, which causes the retina to detach from the posterior pole of the eye. Much has been detailed as to the effects of PVR, but little has been confirmed about the pathogenesis of PVR.
The growth of PVR membranes can been categorized into a four-stage process.1 The first stage (Grade A) is identified by the presence of a vitreous haze, and vitreous pigment clumps. The second stage (Grade B) includes wrinkling of the inner retinal surface, rolled edges of retinal breaks, retinal stiffness, and vascular tortousity. The third stage (Grade C) includes full-thickness retinal folds of 1–3 quadrants. The last stage (Grade D) consists of a complete retinal detachment with fixed retinal folds in 4 quadrants. This stage is further sub-classified into wide, narrow, or closed funnel configurations.
Past studies have shown that PVR membranes are composed of various cell types including retinal pigment epithelial cells (RPE),2, 3, 4 fibroblast cells,5 glial cells,6, 7 and macrophages.7, 8 RPE and glial cells comprise the major cell types of the membrane. It is presumed that since RPE and glial cells are the most prominent cell types, they contribute significantly to the development of the PVR membrane, potentially by producing growth factors that not only regulate their own growth, but the growth of other cell types around them.
Connective tissue growth factor (CTGF),6 hepatocyte growth factor (HGF),6 and platelet-derived growth factor (PGDF)9 have been identified within PVR membranes along with other growth factors, and are believed to be influential components of the developing PVR membrane.7, 10, 11 In the case of platelet-derived growth factor, all three substrate forms (PDGF-AA, PDGF-BB, PDGF-AB)12, 8 have been identified, with PDGF-AA recently believed to play critical role in PVR development.13 The receptors for these growth factors, as well as the mRNA sequences which code for them, have been located in RPE9, 14, 15, 16 and glial cells9, 17 using immunohistochemistry and in situ hybridization. However, the relative frequency of RPE and glial cell types, and to what degree each produce these growth factors, at each stage of PVR has not yet been determined. The purpose of this study is to analyse PVR membranes at each stage of PVR, to determine the relative prevalence of RPE and glial cell types, and the relative expression of growth factors by these two cell types during PVR development.
Materials and methods
Tissue preparation
A total of 37 PVR membranes, at various stages of PVR (11 at early stage, presence of a vitreous haze, and vitreous pigment clumps; including wrinkling of the inner retinal surface, rolled edges of retinal breaks, retinal stiffness, and vascular tortousity; 14 at middle stage, full-thickness retinal folds of 1–3 quadrants; 12 at late stage, consists of a complete retinal detachment with fixed retinal folds in four quadrants) were obtained from patients undergoing vitreoretinal surgery for PVR. All membranes were from individuals who presented with rhegmatogenous retinal detachments and subsequently developed proliferative vitreo-retinopathy requiring reoperations. Both subretinal and preretinal membranes were evaluated. The University of British Columbia (UBC) Clinical Research Ethics Board (CREB) approved the study protocol. The UBC CREB policies comply with the Tri Council Policy and the Good Clinical Practice Guidelines, which have their origins in the ethical principles in the Declaration of Helsinki. Written informed consent was obtained from patients.
The membranes were set in an Optimal Cutting Temperature compound (OCT, embedding medium for frozen tissue specimens. Tissue-Tek; Torrance, CA, USA) mold and stored at −80°C. Before sectioning the membranes, each block was thawed to −23°C and then maintained at this temperature throughout sectioning. The membranes were sequentially cut using a Frigocut 2800 N Cryostat (Reichert-Jung; Chicago, IL, USA) into 6 _μ_m sections, and then mounted onto slides. There were approximately four sections per slide. The slides were stored at −20°C until immunohistochemical processing.
Immunohistochemical staining
Both single and double immunohistochemical staining procedures were used to identify the presence of growth factors and specific cell types. The slides were removed from −20°C conditions, and left to dry at room temperature for 20 min. After the allotted time, each section was circled with a Pap pen (Daido Sangyo; Tokyo, Japan) and fixed with room temperature acetone for 5 min. Following this, the slides were washed in a mixture of fresh phosphate-buffered saline (PBS) and 0.1% Triton X-100 for 5 min, then treated with 0.3% hydrogen peroxide (to remove any endogenous peroxidases) for 15 min. The sections were then blocked for non-specific binding in a solution of PBS and 1% bovine serum albumin (BSA), for another 20 min.
Sections were incubated in either a solution containing one antibody, or a solution containing two primary antibodies, for 1 h. In the case of double immunohistochemistry, the first antibody was against one of the growth factors, and the second antibody was targeted towards one of the two cell types. The commercially available antibodies were diluted with PBS at the optimal concentrations (see below). Negative control experiments were designed with either one, or both, primary antibodies omitted and sections incubated in the diluent only. All subsequent steps were identical between control and experimental procedures.
The first group of antibodies included goat anti-human HGF at a concentration of 15 _μ_g/ml, (R&D Systems; Minneapolis, MN, USA), goat anti-human PDGF-AA (R&D Systems; Minneapolis, MN, USA) at a concentration of 15 _μ_g/ml, or rabbit anti-mouse CTGF (Torrey Pines Biolabs; Houston, TX, USA) at 500 _μ_g/ml. The second group of antibodies, used as cell markers, included mouse anti-pan cytokeratin. This is a mixture of monoclonal anti-cytokeratin antibodies. It recognizes human cytokeratins 1, 4, 5, 6, 8, 10, 13, 18, and 19. It is a broad-spectrum reagent, which reacts specifically with a wide variety of normal, reactive and neoplastic epithelial tissues. The antibody mixture reacts with simple, cornifying and noncornifying squamous epithelia and pseudostratified epithelia. It does not react with nonepithelial normal human tissues. (Sigma-Aldrich, St Louis, MO, USA) and mouse antiglial fibrillary acidic protein (Chemicon; Temecula, CA, USA), both at a dilution of 1 : 400. After incubation with primary antibodies, the slides were washed three times over 15 min with fresh PBS. This was followed by incubation of the slides with fluorescent secondary antibodies, which were diluted with PBS, for 30 min. The secondary antibodies were anti-rabbit Alexa-488 (Molecular Probes; Eugene, OR, USA), anti-mouse Alexa-488 (Molecular Probes; Eugene, OR, USA), anti-goat Alexa-633 (Molecular Probes; Eugene, OR, USA), and anti-mouse Alexa-647 (Molecular Probes; Eugene, OR, USA) each at a dilution 1 : 400. After 30 min, the slides were washed three times over 15 min with fresh PBS. To preserve the luminosity of the secondary antibodies, the slides were mounted with SlowFade (Molecular Probes; Eugene, ON), and then covered with No. 1.5 cover slips.
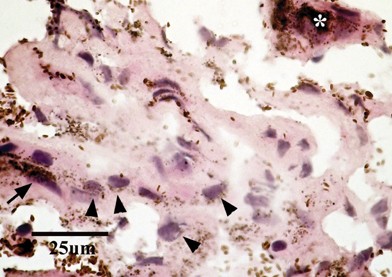
Several sections from each membrane were also stained for hematoxylin and eosin (HE) to allow brightfield visualization of the cellular content, endogenous pigment, and to compare with immunohistochemical staining (Figure 1).
Figure 1
Light micrograph of a cryostat section (6 micra thickness) taken from an early stage PVR membrane obtained during vitrectomy, stained with Hematoxylin–Eosin. Note several round, cell nuclei (purple hematoxylin). Arrowheads point to cell profiles that contain few pigment granules. Other cells are heavily pigmented (arrow). Some areas of tissue contain dense pigment deposits (asterisk), which were not analysed due to autofluorescence. Scale bar, 25 _μ_m.
Analysis
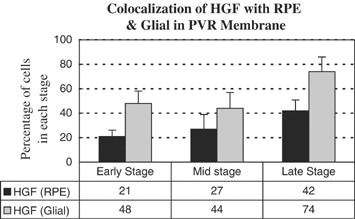
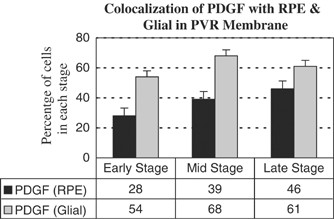
Each section was analysed using a confocal laser-scanning microscope (Zeiss-LSM 510 META). Random fields of the sections were imaged at × 20 magnification. Each random field was centred over the tissue, and avoided the edges of the tissue specimens. The fields were scanned with laser wavelengths of 488 and 647 nm. When exposed to these wavelengths, Alexa 488 emits in the green wavelengths, while Alexa 633 and Alexa 647 emit in the red wavelengths. A given random field having 10 or more labelled cells was classified as ‘+++’ to indicate strong expression. A field having six to 10 labelled cells was classified as ‘++’, and as ‘+’ if it had one to five labelled cells. If the field showed no expression it was classified with ‘0/−’. Table 1 summarizes the data for the relative levels of expression of the five antigens (cytokeratin, GFAP, CTGF, HGF, and PDGF-AA) in early (_N_=11), middle (_N_=14), and late (_N_=12) stage PVR membranes. The data are further graphed in Figures 2 and 3, which summarize the percentage of total membranes within early, middle, or late stage PVR that demonstrated the strongest expression levels of each of the five antigens. Next, an analysis of the number of glial, or RPE, cell types that also colocalize with immunoreactivity for HGF, CTGF, or PDGF-AA was undertaken using material obtained from the double immunohistochemical methods. Figures 6, 7 and 8 summarize the percentage of RPE, or glial, cells that also express one of the growth factors in early, middle and late stage PVR. The data in all graphs represent the mean±SE obtained from two independent experiments. In each experiment, three sections were analysed per membrane.
Table 1 Expression of cellular markers of RPE, glial cells, and growth factors in PVR
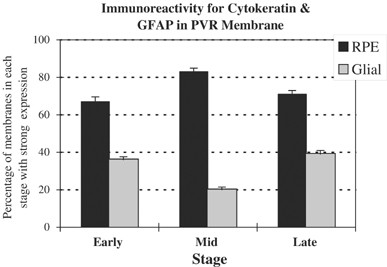
Figure 2
Graph depicting the mean percentage of strongly immunoreactive PVR membranes for pan cytokeratin (RPE) and GFAP (glial) in early, mid and late stage PVR. Mean percentage of membranes strongly immunoreactive for cytokeratin is greater than for GFAP in all stages of PVR. Error bars in the graph represent the mean±SE obtained from two independent experiments.
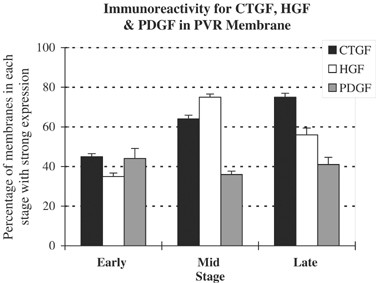
Figure 3
Mean percentage of PVR membranes that demonstrate strong expression of CTGF, HGF, or PDGF-AA in early, middle and late stage PVR. Each growth factor demonstrates a different pattern of expression in PVR development. HGF immunoreactivity (white bars) peaks in mid stage PVR, CTGF immunoreactivity (black bars) increases steadily from early to late stages, while PDGF-AA immunoreactivity (grey bars) is consistent throughout PVR development. Error bars in the graph represent the mean±SE obtained from two independent experiments.
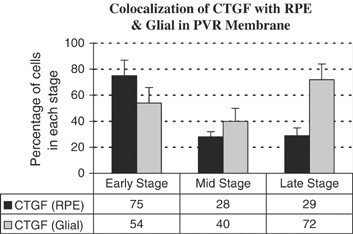
Figure 6
Graph depicting the mean percentage of double labeled cells in early, middle or late stage PVR. The colocalization of CTGF with RPE, or glia, cells demonstrates that CTGF expression by RPE cells decreases, while CTGF expression by glial cells, increases from early to late stage PVR. Graphs depict the mean (±SE) number of RPE, or glial, cells that coexpress CTGF as a function of stage of PVR, obtained from two independent experiments.
Figure 7
Graph depicting the mean percentage of double labeled cells in early, middle or late stage PVR. The colocalization of HGF with RPE, or glial, cells demonstrates that HGF expression by RPE and glial cells increase from early to late stage PVR. Glial cells that express HGF are more abundant than HGF expressing RPE cells at all stages of PVR development. Graphs depict the mean (±SE) number of RPE, or glial, cells that coexpress HGF as a function of stage of PVR, obtained from two independent experiments.
Figure 8
Graph depicting the mean percentage of double labeled cells in early, middle or late stage PVR. The colocalization of PDGF-AA with RPE, or glial, cells demonstrates that PDGF-AA expression by RPE cells increases from early to late stage PVR, while glial cells that express PDGF-AA increases from early to late stage PVR. The relative number of glial cells that coexpress PDGF-AA is greater than RPE cells that coexpress PDGF-AA at all stages of PVR. Graphs depict the mean (±SE) number of RPE, or glial, cells that coexpress PDGF-AA as a function of stage of PVR, obtained from two independent experiments.
Immunolabelling of cell type was complicated by the fact that many cells contained deposits of endogenous pigment (melanin) that autofluoresced under confocal scanning laser conditions, causing false positive staining. Fluorescent images were compared to transmitted light images and false fluorescent cellular labelling (due to the colocalization with endogenous pigment) was then excluded from the analysis. If a random field demonstrated strong autofluorescence, it was eliminated from the analysis. Approximately 10% of the sections were eliminated due to autofluroescence caused by endogeneous pigment (Figure 1).
For ease of analysis, PVR was graded on a 3-step scale (early, mid, and late stages) by modifying the 1983 Retinal Society classification.1 From this latter classification, grade A (minimal PVR: vitreous haze, vitreous pigment clumps) and grade B (moderate PVR: wrinkling of the inner retinal surface, rolled edge(s) of retinal break(s), retinal stiffness, vascular tortuosity) were reclassified as ‘early stage’. Grade C (marked PVR: full thickness retinal folds; 1–3 quadrants) was reclassified as ‘mid-stage’. Grade D (massive PVR: fixed retinal folds in four quadrants) was reclassified as ‘late stage’. The graphs were created using the early, mid and late stage categories (Figures 2, 3, 6, 7 and 8).
Results
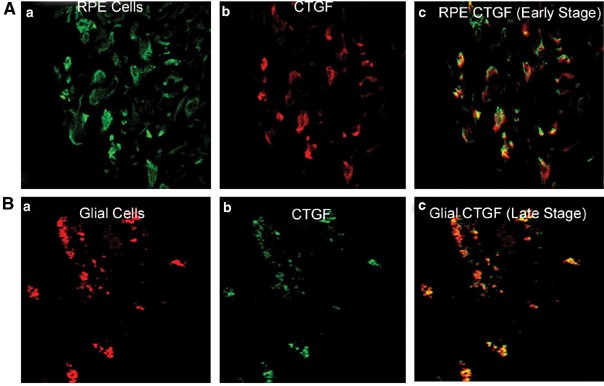
Immunohistochemical analysis revealed the cellular and growth factor profiles of PVR membranes. Earlier studies determined that RPE and glial cells were the major cellular components of PVR membranes.2, 3, 4 This study focuses primarily on elucidating the relative frequency of these cell types, at each stage, during the development of PVR. Results reveal that the majority of all membranes (67–83%) processed for immunohistochemistry show strong expression for pan cytokeratin, a marker of RPE. Fewer than 20% of the membranes demonstrate moderate staining, while 10% demonstrate mild or no immunostaining for pan cytokeratin. Strong expression of pan cytokeratin is present at all stages of PVR development (Table 1 and Figure 2). High-power confocal images show that the immunostaining for pan cytokeratin is primarily in the cytoplasmic compartment of cells within the PVR membranes (Figure 4A).
Figure 4
Confocal images of cytokeratin, GFAP and CTGF immunoreactivity in PVR membranes at × 40 magnification. (A) Double immunostaining of CTGF and cytokeratin (RPE) in early stage PVR. The green immunofluorescence indicates RPE cells (a), red indicates CTGF (b) and yellow indicates colocalization of both CTGF and cytokeratin immunoreactivity in the overlapped image (c). Note that the majority of cellular profiles are double labeled as indicated by the yellow immunofluorescence in the early stage membrane shown in (c). (B) Double immunostaining of CTGF and GFAP (glia) in a late stage PVR membrane. Green immunofluorescence indicates GFAP (a), red indicates CTGF (b) and yellow indicates colocalization of both CTGF and GFAP immunoreactivity in the overlapped image (c). Glial cell expression for CTGF was strongest in late stage PVR as seen in (c). Images captured at 40 × .
Glial cells, another cellular component of PVR, were identified by GFAP immunohistochemistry. The overall percentage of membranes demonstrating strong expression of GFAP ranged from 20 to 39%, substantially less than the 67 to 83% obtained for pan cytokeratin. Approximately 10% of all membranes demonstrate negative immunostaining for GFAP. The remaining membranes demonstrate mild (30%) or moderate (30%) immunostaining. Overall, glial cells were present in all stages of PVR, yet at considerably lower levels than the RPE cells (Table 1 and Figure 3). Confocal images reveal that GFAP immunoreactivity is present in the cytoplasmic compartment of cells within the PVR membranes (Figure 4B).
Growth factor expression
The immunohistochemical expression of several growth factors was studied as a function of PVR stage. CTGF expression is strong in 45–75% of the membranes, while an average of 33% of the membranes demonstrate moderate, and 5% demonstrate mild labelling (Table 1). Strong expression of CTGF is found in fewer membranes from early stage PVR (45%) than late stage PVR (75%), with the mid stage showing an intermediate value (Figure 6). Confocal images reveal cytoplasmic labelling of CTGF in cells within PVR membranes (Figure 4A).
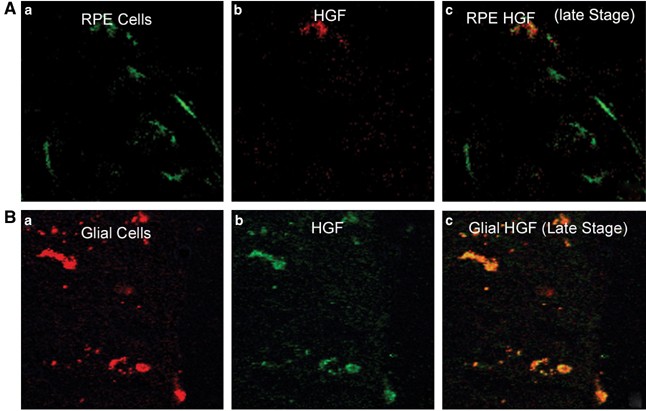
Strong expression of HGF is seen in 35 to 75% of the membranes. Moderate labelling is seen in an average of 20%, while mild labelling is seen in an average of 10% of the PVR membranes (Table 1). Strong expression of HGF is present in more membranes from mid-stage (75%) to late stage (56%) than in early (35%) stage PVR (Figure 7). Confocal images reveal cytoplasmic labelling of HGF in cells within PVR membranes (Figure 5).
Figure 5
Confocal images of HGF, cytokeratin and GFAP immunoreactivity staining in a late stage PVR membrane. (A) Colocalization of HGF and cytokeratin immunoreactivity in a PVR membrane. Green immunofluorescence indicates cytokeratin immunoreactivity (a), red indicates HGF immunoreactivity (b), and yellow indicates colocalization of both HGF and cytokeratin immunoreactivity in the overlapped image (c). (B) Colocalization of HGF and GFAP immunoreactivity in a PVR membrane. Green immunofluorescence indicates GFAP immunoreactivity (a), red indicates HGF immunoreactivity (b) and yellow indicates colocalization of both HGF and GFAP immunoreactivity in the overlapped image (c). Glial cells were more immunoreactive for HGF, than RPE cells, at all stages of PVR. Images captured at × 40.
Strong expression of PDGF-AA is seen in 36 to 44% of the membranes. Moderate labelling is seen in an average of 34%, while mild labelling is seen in an average of 22% of the membranes. PDGF-AA immunoreactivity is uniformly present throughout all stages of PVR (Figure 8). Confocal images reveal cytoplasmic labelling of PDGF-AA in cells within PVR membranes (image not shown).
Double immunohistochemical staining
Both RPE and glial cells express CTGF, HGF, and PDGF-AA, as was previously documented.9, 14, 15, 16, 17 RPE cells are strongly immunoreactive for CTGF in early stage PVR. Approximately 75% of the cells that express pan cytokeratin also demonstrate CTGF immunostaining at this stage (Figure 6). There is a dramatic decrease (from 75% to 29%) in the percentages of RPE cells that are also immunoreactive for CTGF from early to late stage PVR. Glial cells also demonstrate strong immunoreactivity for CTGF, but there is a reverse trend towards more colocalization of GFAP and CTGF in late stage PVR (72%) compared to mid (40%) and early (54%) stage PVR membranes.
While more RPE cells express CTGF, immunostaining for the HGF growth factor reveal that more glial, rather than RPE, are immunoreactive for HGF at all stages of PVR (Figure 7). Late stage PVR demonstrates more double labelling for HGF with both glial and RPE cell types than the other stages of PVR.
The growth factor, PDGF-AA, colocalizes with RPE and glial cells, with greater percentages of double staining evident with the glial cell type. Overall percentages of RPE and glial cells that also express PDGF-AA are greater in mid and late stage compared to early stage PVR (Figure 8). This finding is not consistent with the results from single staining experiments, and suggests other cell types, not studied here, may express PDGF-AA in early stage PVR.
Discussion
The present study was designed to identify the stage specificity of growth factor expression during the development of PVR. To our knowledge, this is the first study to describe the stage specificity of CTGF, HGF, and PDGF-AA in PVR. Previous studies have shown that RPE cells, glial cells, CTGF, HGF, and PDGF-AA are all key components of PVR membranes, and that both cell types are able to express these growth factors,2, 3, 4, 5, 6, 9, 13, 14, 15 but whether stage specificity exists was never addressed. This study shows that the overall proportions of these growth factors, and the degree to which RPE and glial cells express them, varies during the development of PVR. The results are valuable in light of future treatment strategies for the prevention of proliferation, migration, or differentiation of cells, which may prevent the formation, differentiation and contraction of PVR membranes.
This study used fluorescence confocal microscopy for analysis of immunolabelling. One of the limitations of the study is the ability to detect true immunostaining in the presence of endogenous pigment granules, as these often autofluoresce. We were able to distinguish autofluorescence from real immunolabelling by comparing the fluorescent images with transmitted light images. As pigment was clearly visible under transmitted light (Figure 1), any fluorescent cell profiles (Figures 4 and 5) were also checked under transmitted light to determine whether the positive staining may have been due to autofluorescent pigment within the cell. Typically, if the pigment load is relatively light (arrowheads, Figure 1), areas of the cell's cytoplasmic compartment are pigment free, and thus positive immunolabelling could be identified. When the pigment load in a cell is heavy, obscuring the entire cytoplasmic compartment (arrow, Figure 1), it would be more difficult to distinguish the difference between autofluorescence and real immunolabelling, and thus the cell count would have been discarded from the analysis. It is possible that these heavily pigmented cells may have also contained positive immunoreactivity, but because we could not rule out a false positive, they were not counted. Thus, the data in this study represents a conservative estimate of the real values.
While CTGF, HGF, and PDGF-AA immunoreactivity are expressed during all stages of PVR, they each demonstrate variation in their expression patterns. CTGF expression increases from early to late stage PVR (Figure 3), and is principally colocalized with RPE cells in early stage, and glial cells in late stage PVR (Figure 6). CTGF is a cysteine-rich protein that stimulates a broad repertoire of cellular responses including proliferation, chemotaxis, adhesion, migration, and extracellular matrix production.18, 19, 20 CTGF is likely to be important in RPE-mediated fibrosis because it is known that RPE cells produce CTGF during activation, and show enhanced migration, proliferation, adhesion, and production of collagen or 1_α_-smooth muscle actin, in response to CTGF.6 Figure 6 demonstrates that CTGF and RPE cells are principally colocalized in early stage PVR, suggesting that CTGF's role is to enhance the proliferation of RPE cells. Figure 2 shows that RPE cells peak in mid stage PVR, a finding that is consistent with this hypothesis. CTGF's target cells include fibroblasts, epithelial cells, endothelial cells, smooth muscle cells, and neuronal cells.21 The strong expression of CTGF in mid and late stage PVR may be related to the fact that CTGF indirectly regulates the dedifferentiation of RPE cells into fibroblast cells, as well as the synthesis of collagen.16 Recent reports have provided strong evidence of a role for CTGF in PVR, especially as a mediator of retinal fibrosis and transforming growth factor-_β_2 action.6 Of the three factors studied here, CTGF may prove to be the most influential in the PVR process. The fact that CTGF immunoreactivity demonstrated strongest levels in late stage PVR suggest that CTGF may be dramatically upregulated in glial cells, a key component of late stage PVR membranes, and/or expressed by other cell types including the myofibroblast cell, not studied here, but known to be prominent in late stage PVR.22
HGF is a pleiotropic growth factor that has mitogenic, morphogenic, and motogenic activities when cultured with epithelial cells and glial cells.5, 6, 14, 15, 23, 24, 25 It has been reported that HGF, a glycoprotein that mediates epithelial-mesenchymal interactions in many tissues,26, 27, 28 has autocrine-paracrine activity in RPE15 and is a major regulator of RPE barrier function.29 It was recently reported that glial cells in epiretinal membranes express both HGF and its receptor, c-Met.24 The results from this study reveal that the coexpression of HGF and glial is far more frequent than with RPE cells at all stages of PVR. Furthermore, the overall HGF expression peaks during mid stage PVR when glia numbers appear relatively low (Figure 2). In light of these findings, it seems likely that HGF is expressed by other yet unidentified cell types, in addition to glial and RPE, particularly at mid stage PVR. Additional studies are needed to reveal the identity of HGF producing cells in PVR.
Platelet-derived growth factor (PDGF) has also been implicated in the development of proliferative retinal diseases.5, 13, 30, 31, 32, 33 Results shown in Figure 3 indicate that, overall, PDGF-AA is relatively stable in its expression patterns throughout PVR development. However, the data obtained from the double labelled experiments show an increase in percentages of both RPE and glial cell colocalization with PDGF-AA immunoreactivity at mid and late stage PVR. It is possible that other cellular components, beside RPE and glial, are key contributors to PDGF-AA levels in the early stage PVR. A candidate cell type that may express PDGF in early stage PVR is the macrophage,34, 35 already known to express PDGF from in vitro studies.
In conclusion, a pattern of growth factor expression exists during the development of PVR. All three growth factors studied here are present in early stage PVR. CTGF and HGF continue to increase during mid and late stages of this disease process, while PDGF-AA appears to be uniformly expressed throughout PVR. These data suggest that a prophylactic, post-surgical intravitreal injection of a cocktail of antibodies targeted against CTGF, HGF, and PDGF may help reduce the recurrence of PVR. A treatment strategy that targets these growth factors, or their receptors, may be more beneficial in inhibiting PVR development, than nonspecific antiproliferative agents, such as heparin,36 daunorubicin,37 5-fluorouracil (5-FU),38 colchicine,39 taxol,40 radiation41 or a ribozyme technology targeted to proliferating cell nuclear antigen (PCNA).42
