An Adaptive Fisher’s Combination Method for Joint Analysis of Multiple Phenotypes in Association Studies (original) (raw)
Consider a sample of n unrelated individuals. Each individual has K phenotypes. Denote Y k = (y_1_k, …, y nk)T as the k th phenotype of n individuals. Denote X = (_x_1, …, x n)T as the genotypic score of n individuals at a genetic variant of interest, where x i ∈ {0, 1, 2} is the number of minor alleles that the i th individual carries at the genetic variant. We propose a new method to test the null hypothesis _H_0: none of the K phenotypes are associated with the genetic variant.
We test the association between each phenotypic vector Y k (k = 1, 2, …, K) and the genotypic score X using a standard GWAS software (e.g. PLINK, Gen/ProbABEL, MaCH, SNPTEST and FaST-LMM)30,31,32,33,34,35,36. Let _p_1, _p_2, …, p K denote the p-values obtained by the standard univariate GWAS. Based on these p-values, we propose an Adaptive Fisher’s Combination (AFC) method to test the association between multiple phenotypes and the genetic variant. Let p(k) denote the k th smallest p-value,  and
and  denote the p-value of T k. The statistic of AFC to test the association between the K phenotypes and the genetic variant is given by
  . We use the following permutation procedure to evaluate the p-values of T k and T all.
1. In each permutation, we randomly shuffle the genotypes and recalculate p(1), …, p(K) and _T_1, …, T K. Suppose that we perform B. times of permutations. Let  (b = 0, 1, …, B) denote the value of T k based on the b th. permuted data, where b = 0 represents the original data.
2. We transfer  to
to  by
by

3. Let  . Then, the p-vae of T all is given by

As shown in Appendix, the null distributions of _p_1, _p_2, …, p K and thus of T all do not depend on the genetic variant being tested. Thus, the permutation procedure described above to generate an empirical null distribution of T all needs to be done only once for a GWAS.
The R code of AFC is available at Shuanglin Zhang’s homepage http://www.math.mtu.edu/~shuzhang/software.html.
Comparison of Methods
We compare the performance of our method with those of TATES12, Tippett’s method27, Fisher’s Combination test (FC)28, Multivariate Analysis of Variance (MANOVA)29, joint model of Multiple Phenotypes (MultiPhen)8 and Sum Score method (SUMSCORE)12. Here we briefly introduce each of those methods using the notations in the method section.
TATES
Combine the K phenotype-specific p-values obtained in standard univariate GWAS to acquire one overall p-value,  , where m e denotes the effective number of independent p-values of all K phenotypes and m e(k) denotes the effective number of p-values among the top k p-values.
MANOVA
Consider a multivariate multiple linear regression model: Y = Xβ T + ε, where Y denotes the n × K matrix of phenotypes, β_T_ = (β1, …, β_K_) is a vector of coefficients corresponding to the K phenotypes and ε. is the n × K matrix of random errors with each row of ε to be i.i.d. MVN (0, Σ), where Σ is the covariance matrix of ε. To test _H_0 : β = 0, the likelihood ratio test is equivalent to the Wilk’s Lambda test statistic of MANOVA37, that is,  . Here Λ denote the ratio of the likelihood function under _H_0 to the likelihood function under _H_1, l(β, Σ) is the log-likelihood function,
  and
and  , where
  is the maximum likelihood estimator (MLE) of β and |·| denotes the determinant of a matrix. Then the test statistic has an asymptotic
  distribution38.
MultiPhen
By performing ordinaregression, MultiPhen develops a reversed analysis for joint analysis of multiple phenotypes by considering a genetic variant of interest X = (_x_1, …, x n)T as a response variable and the correlated phenotypes Y k = (y_1_k, …, y nk)T as predictors.
SUMSCORE
Let  denote the score test statistic to test the association between the k th phenotype and the genetic variant. The test statistic of SUMSCORE is given by
  . The p-value of T SUMSCORE is estimated using a permutation procedure.
Tippett
The test statistic of Tippett is given by  . The p-value of T Tippett is estimated using a permutation procedure.
FC
The Fisher’s combination test statistic is defined as  . Yang et al.28 adopted three different approaches to calculate the p-value for correlated phenotypes. In this article, we calculate the p-value using a permutation procedure.
AFC, FC and Tippett are closely related. Intuitively, when only one phenotype or very few phenotypes are associated with the variant, Tippett is more powerful than FC because in this case FC contains a lot of noises. When all phenotypes or a large proportion of the phenotypes are associated with the variant, FC is more powerful than Tippett because in this case Tippett only uses the minimum p-value and loses information. AFC can be adaptive to the number of phenotypes associated with the variant.
Simulation
We generate genotype data at a genetic variant according to a minor allele frequency (MAF) under Hardy-Weinberg equilibrium. Phenotypes are generated similarly to that of van der Sluis et al.12. The phenotypic correlation structures mimic that of UK10K39, that is, the phenotypes are divided into several groups (factors) and the within-group correlation is larger than the between-group correlation. Denote Y k = (y_1_k, …, y nk)T as the k th phenotype of n individuals and X = (_x_1, …, x n)T as the genotypic score of the n individuals at the genetic variant.
Scenario 1
considering one factor model with genetic variant effect on the factor. We first generate a common factor, f = βX, where f is the n by 1 common factor and β is the effect size. Then we simulate K phenotypes by

where a is a factor loading, ε_k_ = (ε1_k_, …, ε_nk_)T ~ MVN(0, I n) and I n is the identity matrix.
Scenario 2
considering 4 factor model with the genetic variant effect on the fourth factor, each factor has (K)/4 (K is a multiple of 4) phenotypes. We generate 4 correlated factors using (_f_1, f_2, f_3, f_4)T ~ MVN(0, Σ), where Σ = (1−ρ_fa)I + ρ_fa A, A is a matrix with elements of 1, I is the identity matrix and ρ_fa is the correlation between any two factors. Then, we transform the fourth factor _f_4 to  by
by  and simulate K phenotypes using

where a is a factor loading, ε_j_ = (ε1_j_, …, ε_nj_)T ~ MVN(0, I n) for j = 1, …, 4 and β is the effect size.
Scenario 3
considering two factor model with the genetic variant effect on the second factor, each factor has (K)/(2) (K is a multiple of 2) phenotypes. We generate two correlated factors using (f_1, f_2)T ~ MVN(0, Σ), where Σ = (1−ρ_fa)I + ρ_fa A, A is a matrix with elements of 1, I is the identity matrix and ρ_fa_ is the correlation between any two factors. Then, we transform the second factor _f_2 to  by
by  and simulate K phenotypes using

where a is a factor loading, ε_j_ = (ε1_j_, …, ε_nj_)T ~ MVN(0, I n) for j = 1, 2 and β is the effect size.
Scenario 4
considering 4 factor model with genetic variant effect specific to the K th phenotype, each factor has (K)/4 (K is a multiple of 4) phenotypes. By using the original factors _f_1, _f_2, _f_3, _f_4 in scenario 2, we simulate K phenotypes using

where a is a factor loading, ε_j_ = (ε1_j_, …, ε_nj_)T ~ MVN(0, I n) for j = 1, …, 4 and β is the effect size.
Scenario 5
considering one factor model with the genetic variant effect specific to the K th phenotype. We simulate K phenotypes by

where f_~MVN(0, I n), a is a factor loading, ε_k = (ε1_k_, …, ε_nk_)T ~ MVN(0, I n) and β is the effect size.
Scenario 6
considering a network model, where the K phenotypes are correlated and the correlation structure is not due to one or multiple underlying common factors. We generate K phenotypes independent of genotypes for each individual by using  , where Σ = (1 − ρ_phe_)I + ρ_phe_ A, A is a matrix with elements of 1, I is the identity matrix and ρ_phe_ is the correlation between any two phenotypes. After generating
 , let
, let  where ε_k_ = (ε1_k_, …, ε_nk_)T ~ MVN(0, I n).
In scenarios 2–5, the within-factor correlation is _a_2 and between-factor correlaiton is a_2ρ_fa. To evaluate type I error of the proposed method, we generate phenotypic values independent of genotypes by assigning β = 0. To evaluate power, we generate phenotypic values according to the six scenarios described above.
Simulation results
We use two sets of simulations to evaluate the type I error rates of the proposed method. The first set of simulations is normal simulation studies and includes 10,000 replicated samples for each sample size under each scenario. The p-values are estimated using 10,000 permutations. For 10,000 replicated samples, the 95% confidence intervals (CIs) for type I error rates at the nominal levels 0.01 and 0.001 are (0.008, 0.012) and (0.0004, 0.0016), respectively. The estimated type I error rates of the proposed test (AFC) are summarized in Table 1. From Table 1, we can see that most of the estimated type I error rates are within the 95% CIs and those type I error rates not within the 95% CIs are very close to the bound of the corresponding 95% CI, which indicates that the proposed method is valid.
Table 1 The estimated type I error rates of the proposed method for MAF equals 0.3.
The second set of simulations mimics GWAS. To be comparable with the real data analysis, we generate 6,000 unrelated individuals with 8 phenotypes at 106 variant sites under each scenario. The phenotypes are independent of genotypes. The MAF at each variant is a random number between 0.05 and 0.5. The null distributions of _T_1, …, T K and T all are generated by 106 permutations using the genotypes at the first variant. We consider genotypes at 106 variants as 106 replicated samples. For 106 replicated samples, the 95% confidence intervals (CIs) for the type I error rates at the nominal levels 10−3, 10−4 and 10−5 are (0.94×10⁻³, 1.06×10⁻³), (0.80 × 10⁻⁴, 1.20 × 10⁻⁴) and (0.38 × 10⁻⁵, 1.62 × 10⁻⁵), respectively. The estimated type I error rates of the proposed test (AFC) are summarized in Table 2. From Table 2, we can see that all of the estimated type I error rates are within the 95% CIs, which indicates that the proposed method is valid.
Table 2 The estimated type I error rates of the proposed method that mimic GWAS.
For power comparisons, we consider (1) power as a function of the effect size under all six scenarios and (2) power as a function of factorial correlation (ρ_fa_) under scenarios 2–4 and power as a function of phenotypic correlation (ρ_phe_) under scenario 6 because scenarios 1 and 5 are one factor model and thus have no ρ_fa_ and ρ_phe_ involved. For Figs 1 and 2, the p-values of AFC, FC, Tippett and SUMSCORE are estimated using 10,000 permutations and the p-values of TATES, MultiPhen and MANOVA are estimated using asymptotic distributions. The powers of all tests are evaluated using 1,000 replicated samples at 0.1% significance level. For Fig. 3, the p-values of AFC, FC, Tippett and SUMSCORE are estimated using 107 permutations. The powers of all tests are evaluated using 1,000 replicated samples at 10−6 significance level.
Figure 1
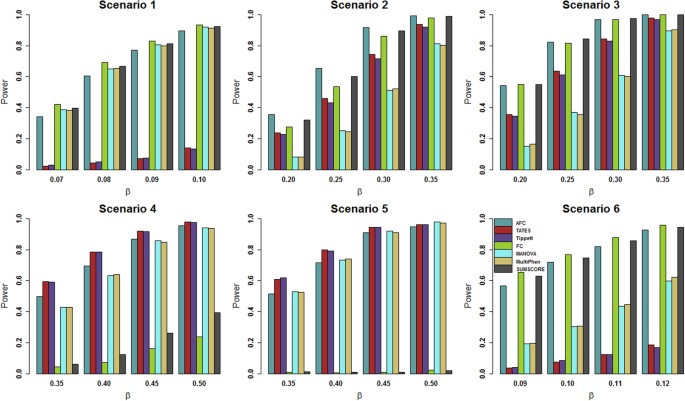
Power comparisons of the 7 tests for power as a function of effect size (β) under the 6 scenarios.
The total number of phenotypes is 20. The sample size is 1,000. MAF is 0.3. The factor loadings are 0.75. In scenarios 2, 3 and 4, the factorial correlation (ρ_fa_) is 0.1. In scenario 6, the phenotypic correlation (ρ_phe_) is 0.1. The powers are evaluated at 0.1% significance level.
Figure 2
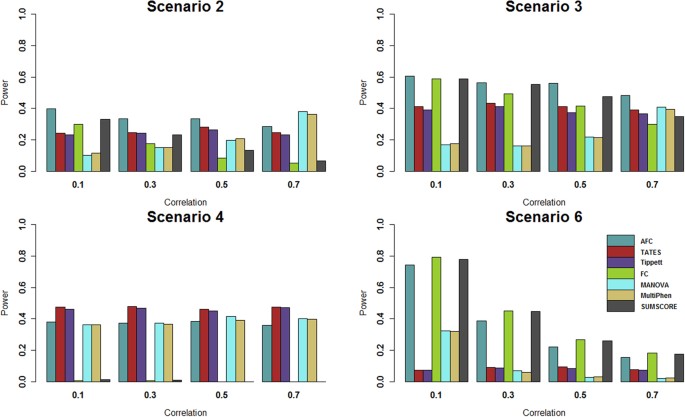
Power comparisons of the 7 tests for power as a function of factorial correlation (ρ_fa_) under scenarios 2 to 4 and as a function of phenotypic correlation (ρ_phe_) under scenario 6.
The total number of phenotypes is 20. The sample size is 1,000. MAF is 0.3. The factor loadings are 0.75. In scenarios 2 and 3, the effect size (β) is 0.2. In scenario 4, the effect size (β) is 0.3. In scenario 6, the effect size (β) is 0.1. The powers are evaluated at 0.1% significance level.
Figure 3
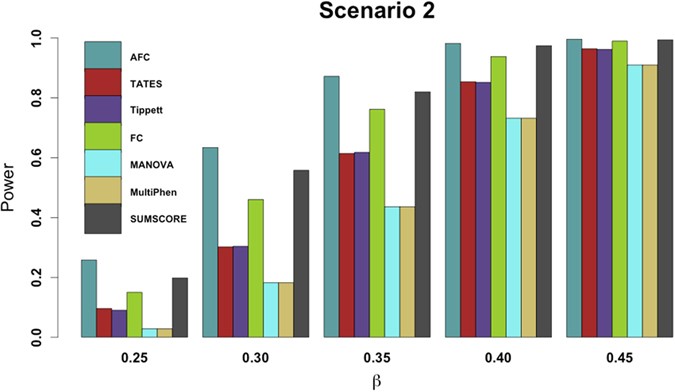
Power comparisons of the 7 tests for power as a function of effect size (β) under scenario 2.
The total number of phenotypes is 20. The sample size is 1,000. MAF is 0.3. The factor loadings are 0.75. The factorial correlation (ρ_fa_) is 0.1. The powers are evaluated at 10-6 significance level while p-values of AFC, FC, Tippet and SUMSCORE are evaluated by 107 permutations.
Figure 1 gives the power comparisons of the 7 tests (AFC, TATES, Tippett, FC, MANOVA, MultiPhen and SUMSCORE) for the power as a function of the effect size based on the six scenarios for 20 phenotypes. This figure shows that (1) AFC is either the most powerful test (genotypes directly impact on a portion of the phenotypes: scenarios 2–3) or comparable to the most powerful test (genotypes directly impact on all phenotypes or a single phenotype: scenarios 1, 4, 5 and 6); (2) TATES and Tippett have similar power and are much less powerful than other methods when genotypes directly impact on all phenotypes (scenarios 1 and 6); (3) MANOVA and MultiPhen have similar power and are much less powerful than other methods when genotypes directly impact on a portion of the phenotypes (scenarios 2–3); and (4) SUMSCORE and FC have similar power and are much less powerful than other methods when genotypes directly impact on a single phenotype (scenarios 4–5).
Power comparisons of the 7 tests for the power as a function of the factorial correlation (ρ_fa_) under scenarios 2–4 and as a function of the phenotypic correlation (ρ_phe_) under scenario 6 are given by Fig. 2. This figure shows that under scenario 4, the powers of all tests do not change with the factorial correlation because only one phenotype is associated with the variant and thus the factorial correlation does not change the information of association between the variant and phenotypes. Under scenarios 2, 3 and 6, (1) the powers of SUMSCORE and FC decrease with the increasing of the factorial or phenotypic correlation because SUMSCORE and FC involve all phenotypes and thus information contained by all phenotypes will decrease with the increasing of the factorial or phenotypic correlation; (2) the powers of TATES and Tippett do not change with the increasing of the factorial or phenotypic correlation because TATES and Tippett essentially only depend on the phenotype that has the strongest association with the variant; (3) under scenario 6, the power of AFC decreases with the increasing of the phenotypic correlation; under scenarios 2–3, the power of AFC does not change much with the factorial correlation; and (4) under scenario 6, the powers of MANOVA and MultiPhen decrease with the increasing of the phenotypic correlation; under scenarios 2–3, the powers of MANOVA and MultiPhen increase with the increasing of the factorial correlation, which is consistent with the results of Ray et al.38. We also give power comparisons of the 7 tests using a significance level of 10−6 with 107 permutations and 1,000 replicates for the power as a function of effect size (β) under scenario 2 (Fig. 3). Figure 3 shows that the patterns of the power comparisons using significance level 10−6 are similar to that using a significance level of 0.1% in Fig. 1 (scenario 2).
In summary, the proposed method has correct type I error rates and is either the most powerful test or comparable with the most powerful tests. No other methods have consistently good performance under the six simulation scenarios.
Application to the COPDGene
Chronic obstructive pulmonary disease (COPD) is one of the most common lung diseases characterized by long term poor airflow and is a major public health problem40. The COPDGene Study41 (http://www.ncbi.nlm.nih.gov/projects/gap/cgi-bin/study.cgi?study_id=phs000179.v1.p1) is a multi-center genetic and epidemiologic investigation to study COPD. This study is sufficiently large and appropriately designed for genome-wide association analysis of COPD. In this study, a total of more than 10,000 subjects have been recruited including non-Hispanic Whites (NHW) and African-Americans (AA). The participants in this study have completed a detailed protocol, including questionnaires, pre- and post-bronchodilator spirometry, high-resolution CT scanning of the chest, exercise capacity (assessed by six-minute walk distance) and blood samples for genotyping. The participants were genotyped using the Illumina OmniExpress platform. The genotype data have gone through standard quality-control procedures for genome-wide association analysis detailed at http://www.copdgene.org/sites/default/files/GWAS_QC_Methodology_20121115.pdf. Variants with MAF <1% were excluded in the data set.
To evaluate the performance of our proposed method on a real data set, we applied all of the 7 methods to the COPDGene of NHW population to carry out GWAS of COPD-related phenotypes. Based on the literature studies of COPD42,43, we selected 7 key quantitative COPD-related phenotypes, including FEV1 (% predicted FEV1), Emphysema (Emph), Emphysema Distribution (EmphDist), Gas Trapping (GasTrap), Airway Wall Area (Pi10), Exacerbation frequency (ExacerFreq), Six-minute walk distance (6MWD) and 4 covariates, including BMI, Age, Pack-Years (PackYear) and Sex. EmphDist is the ratio of emphysema at −950 HU in the upper 1/3 of lung fields compared to the lower 1/3 of lung fields. Followed by Chu et al.42, we did a log transformation on EmphDist in the following analysis. The correlation structure of the 7 COPD-related phenotypes is given in Fig. 4. In the analysis, participants with missing data in any of the 11 variables were excluded. Therefore, a complete set of 5,430 individuals across 630,860 SNPs were used in the following analyses. In the analysis, we first adjusted each of the 7 phenotypes for the 4 covariates using linear models. Then, we performed the analysis based on the adjusted phenotypes.
Figure 4
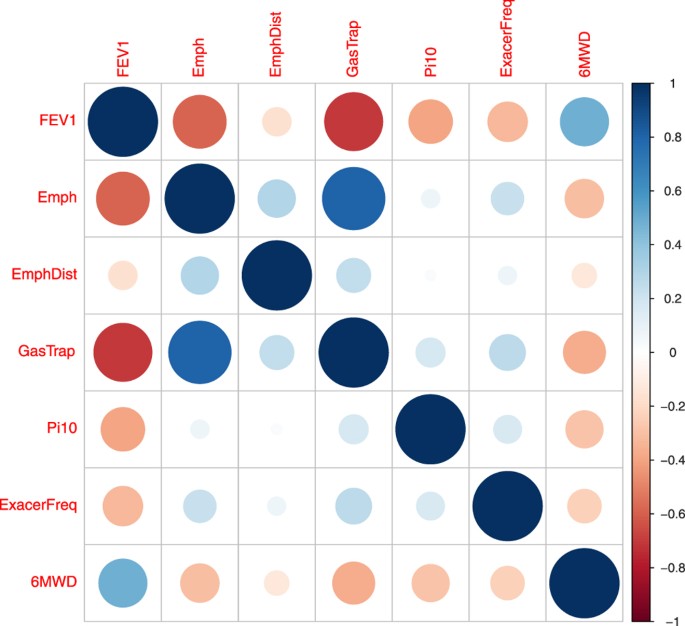
The correlation matrix plot of the 7 COPD-related phenotypes.
To identify SNPs associated with the phenotypes, we adopted the commonly used genome-wide significance level 5 × 10⁻⁸. The results were summarized in Table 3. There were total 14 SNPs in Table 3. All of the 14 SNPs had previously been reported to be in association with COPD by eligible studies44,45,46,47,48,49,50,51,52,53,54,55,56,57. From Table 3, we can see that MultiPhen identified 14 SNPs; MANOVA identified 13 SNPs; AFC identified 12 SNPs, FC and SUMSCORE identified 10 SNPs; and TATES and Tippett identified 9 SNPs. Among the five methods based on combining test statistics from univariate analysis (AFC, TATES, Tippett, FC and SUMSCORE), AFC identified 2 or 3 more genome-wide significant SNPs than the other 4 methods.
Table 3 Significant SNPs and the corresponding p-values in the analysis of COPDGene.