Being intolerant of the intolerant. The exclusion of Western European anti-immigration parties and its consequences for party choice (original) (raw)
Abstract
In various European countries established parties have responded quite differently to the recent rise of anti-immigration parties. In Italy and Austria these parties entered governing coalitions. In France and Belgium the established parties agreed never to collaborate in any way with anti-immigration parties. In this paper we aim to assess whether this strategy of exclusion affects the electoral support for anti-immigration parties. To answer the research questions, we link expert survey data to individual-level survey data and perform analyses across 11 parties and across 4 time points. We find that the effect of exclusion depends on the institutional context, in particular the threshold for entering parliament, and the influence of parliamentary opposition parties on policy-making. According to our estimates the former Flemish Bloc benefited from being excluded and the Northern League in Italy would have benefited if it had been excluded. The Danish Progress Party, on the other hand, would have been hurt if it had been excluded. The other parties in our analyses are hardly affected. To the extent that the exclusion of anti-immigration parties is meant to change electoral outcomes in favour of the established parties, its success is thus quite mixed.
Access this article
Subscribe and save
- Starting from 10 chapters or articles per month
- Access and download chapters and articles from more than 300k books and 2,500 journals
- Cancel anytime View plans
Buy Now
Price excludes VAT (USA)
Tax calculation will be finalised during checkout.
Instant access to the full article PDF.
Figure 1

The alternative text for this image may have been generated using AI.
Notes
- We focus on the national level because politics at that level is bound to have the greatest impact on the electorate. In the eyes of the voter, national elections are the most important elections: ‘first order elections’ (for example, Reif and Schmitt, 1980)
- In addition to inter-party variations, ostracism can differ among different levels of policy-making: the local, regional, national and international level. Parties may collaborate at the local level, and simultaneously refrain from cooperation at the national level. This might contaminate the national-level effects that we examine in this paper, which makes us less likely to find any significant effects. This makes us more confident about the significant effects that we find in this paper.
- Note that we do not consider co-opting policy positions as ‘exclusion’. It is perfectly possible, and even reasonable, for a party to co-opt another party's policy position without cooperating with the other party. Thus, co-opting a party's policy positions does not preclude systematically boycotting it.
- Interestingly, Downs (1957) begins from what Simon (1985) would call a ‘substantive’ view of human rationality, and not from a bounded or ‘procedural’ view. According to Downsian spatial analysis, a voter is expected to vote for the party that would yield the highest utility. In practice, this does not make much of a difference in this paper, however.
- The ostracism of a particular party may affect targeting parties in similar ways. A party that participates in a cordon sanitaire around a particular other party may be internally divided over the issue of whether or not to continue this strategy. This is clearly the case for the Flemish Liberals and Democrats (VLD), a party that has been systematically boycotting the Flemish Interest (VB) over the last decade although several prominent VLD members have argued for a rapprochement to the VB (for example, Maddens and Fiers, 1998). If both the mainstream right and the anti-immigration party are divided, the net electoral effect of the ostracism of the anti-immigration party may be zero. This is a counterargument that Van Donselaar does not deal with.
- It is possible that the exclusion also leads voters to not state their party choice if they voted for an anti-immigration party. This would then lead to an under-representation of anti-immigration party voters in contexts where an anti-immigration party is excluded. Given our findings that the effects of ostracism depend on the political context, we have no reason to assume that this should make us less confident about our results.
- Belgium is a federal state with two completely separate party systems, which means that a Flemish voter cannot vote for a Wallonian party and vice versa. For this reason, we treat the two parts of Belgium as two separate systems (see also for example, De Winter and Swyngedouw, 1996).
- Because of the small sample of the two Belgian sub-systems, these results are not very reliable, but the other sub-samples do not pose such problems.
- The studies consisted of independent cross-sectional surveys fielded in each member country of the EC/EU immediately after each of the EP elections. The European Elections Studies are extensively documented on the European Elections Studies’ web site: http://www.europeanelectionstudies.net/.
- Only the results concerning the nine parties that still existed at the time that the expert survey was conducted (June 2005) could be cross-validated. However, given that no errors were discerned in the codings of other parties, we do not see any reason to question the coding of the other two parties, the Danish FrP and the Dutch CD.
- This variable is sometimes referred to as the ‘probability to vote’ question. It must be emphasized that the variables do not measure probabilities in the statistical sense of that word, as their sum is not – and should not be – constrained to 1 (Van der Eijk, 2002). Tillie (1995) has demonstrated that answers to it are not constrained by the intention to vote for a specific party in the upcoming election. In other words, voters who are certain to vote for a particular party may still give a very high score to the party that is their second preference.
- In the 1999 European study, more than 93 per cent of the respondents gave the highest utility to the party they would vote for in a national election at that time. Similar percentages were obtained in 1989 (Van der Eijk and Franklin, 1996a,1996b, Chapter 20) and for 1994 (Van der Eijk et al, 1999, p. 168).
- Our focus on ideology and the left–right scale ignores that other dimensions may be at play as well when it comes to vote choice. However, we have no way of dealing with this issue, as we do not have data at our disposal that would completely solve this problem.
- Most importantly, the conclusions concerning our four hypotheses do not change when excluding the party size variable. We may seem to have a theoretical argument not to include the party size variable. The size of the party is theoretically expected to be affected by exclusion before the measurement. Taking the size of a party into account would therefore enforce a focus on the short-term effects of exclusion, whereas we expect exclusion to have an impact in the long run rather than in the short term. As a result, we make it very difficult to find any effects of exclusion, which may lead us to commit Type-II errors. However, not taking into account party size may lead us to attribute pragmatic considerations to exclusion. Not surprisingly, the effect of exclusion on the anti-immigration party becomes significantly negative. It is impossible to disentangle whether this is because of the exclusion of these parties, or simply because they are small (for other reasons).
- And perceived ideological closeness is important for the vote for any party, as has been repeatedly shown (for example, van der Eijk and Franklin, 1996b).
- It would be interesting to also include the interaction between these variables. Such an interaction variable would tap the effect that the more moderate its position and the more moderate that of its main rival, the more votes the anti-immigration party will receive. However, this interaction variable is highly correlated with its lower-order effect of the anti-immigration party's ideological position (_r_=0.88, significant for _P_=0.001, one-tailed, _N_=21 509).
- The interaction variables are not included in Table 2, as their descriptive statistics are difficult to interpret.
- With his permission, this appendix relies largely on a paper by Van der Eijk (Van der Eijk, 2002).
- The original regression equation is y i =_b_0+_b_1*x i +e i . In this equation the predicted value ŷ i =_b_0+_b_1*x i . By substituting _b_0+_b_1*x i for ŷ i in the equation, the new regression equation (using the ŷ i as predictors of party utility) becomes: y i =ŷ i +e i . If one were to estimate a new regression using the predicted value as the single predictor of the propensity to support that party, the estimate of the intercept and slope become 0 and 1, respectively, and e i (which forms the basis for the computation of explained variance) is unaltered. When stacking the _y_-hats on top of each other in the stacked matrix, the actual variable added to the stacked matrix is not the predicted value (_y_-hat), but the deviation of the _y_-hats from their mean for each party. This still encapsulates the variance in party preferences caused by the independent variable, but prevents differences among parties in the average level of party preferences from being incorporated in the newly created independent variable. Such differences among parties in average preferences are caused by other factors besides the predictor variable x, and should hence not contribute to the variance in the newly created predictor (_y_-hat). For an elaborate discussion of this procedure, see (Van der Eijk and Franklin, 1996a,1996b, paper 20).
References
- Aiken, L.S. and West, S.G. (1991) Multiple Regression: Testing and Interpreting Interactions. Newbury Park, CA: Sage.
Google Scholar - Alvarez, R.M. and Nagler, J. (1998) Economics, entitlements, and social issues: Voter choice in the 1996 presidential election. American Journal of Political Science 42 (4): 1349–63.
Article Google Scholar - Art, D. (2006) The Politics of the Nazi Past in Germany and Austria. Cambridge: Cambridge University Press.
Google Scholar - Austen-Smith, D. (1983) The spatial theory of electoral competition: Instability, institutions, and information. Environment and Planning C: Government and Policy 1 (4): 439–459.
Article Google Scholar - Backes, U. and Mudde, C. (2000) Germany: Extremism without successful parties. Parliamentary Affairs 53 (3): 457–468.
Article Google Scholar - Benoit, K. and Laver, M. (2006) Party Policy in Modern Democracies. London: Routledge.
Google Scholar - Betz, H.G. (1998) Against Rome: The lega nord. In: H.G. Betz and S. Immerfall (eds.) The New Politics of the Right: Neo-Populist Parties and Movements in Established Democracies. New York: St. Martin's Press.
Google Scholar - Brambor, T., Clark, W. and Golder, M. (2006) Understanding interaction models: Improving empirical analyses. Political Analysis 14: 63–82.
Article Google Scholar - Brennan, G. and Hamlin, A. (1998) Expressive voting and electoral equilibrium. Public Choice 95: 149–175.
Article Google Scholar - Bull, M.J. and Newell, J.L. (1995) Italy changes course? The 1994 elections and the victory of the right. Parliamentary Affairs 48 (1): 72–99.
Google Scholar - Campbell, A., Converse, P.E., Miller, W.E. and Stokes, D.E. (1960) The American Voter. New York: John Wiley & Sons.
Google Scholar - Carter, E. (2005) The Extreme Right in Western Europe: Success or Failure? Manchester, UK: Manchester University Press.
Google Scholar - Damen, S. (1999) Het Cordon Sanitaire Rond Het Vlaams Blok Gewikt en Gewogen. Antwerp, Belgium: Department of Political and Social Science, University of Antwerp.
Google Scholar - Damen, S. (2001) Strategieën tegen extreem-rechts: Het cordon sanitaire onder de loep. Tijdschrift voor Sociologie 22 (1): 89–110.
Google Scholar - De Witte, H. (1997) Een overzicht en evaluatie van strategieen ter bestrijding van extreem-rechtse partijen. In: H.D. Witte (ed.) Bestrijding van Racisme en Rechts-Extremisme Wetenschappelijke Bijdragen Aan het Maatschappelijk Debat. Louvain, Belgium: Acco.
Google Scholar - Delwit, P. and De Waele, J.M. (1998) Les partis politiques et la montée de l’extreme droite en Communauté francaise de Belgique. In: P. Delwit, J.M. De Waele and A. Rea (eds.) L’Extrême droite en France et Belgique. Brussels, Belgium: Éditions Complexe.
Google Scholar - Downs, A. (1957) An Economic Theory of Democracy. New York: Harper and Row.
Google Scholar - Downs, W. (2001) Pariahs in their midst: Belgian and Norwegian parties react to extremist threats. West European Politics 24 (3): 23–42.
Article Google Scholar - Downs, W. (2002) How effective is the cordon sanitaire? Lessons from efforts to contain the far right in Belgium, France, Denmark and Norway. Journal für Konflikt- und Gewaltforschung 4 (1): 32–51.
Google Scholar - Enelow, J.M. and Hinich, M.J. (1984) The Spatial Theory of Voting: An Introduction. Cambridge: Cambridge University Press.
Google Scholar - Ezrow, L. (2008) On the inverse relationship between votes and proximity for niche parties. European Journal of Political Research 47: 206–220.
Article Google Scholar - Fennema, M. (1997) Some conceptual issues and problems in the comparison of anti-immigrant parties in western Europe. Party Politics 3: 473–492.
Article Google Scholar - Franklin, M.N., Mackie, T. and Valen, H. (1992) Electoral Change. Responses to Evolving Social and Attitudinal Structures in Western Countries. Cambridge: Cambridge University Press.
Google Scholar - Givens, T.E. (2005) Voting Radical Right in Western Europe. Cambridge: Cambridge University Press.
Book Google Scholar - Green, D.P. and Shapiro, I. (1994) Pathologies of Rational Choice Theory. A Critique of Applications in Political Science. New Haven, CT/London: Yale University Press.
Google Scholar - Greene, K.V. and Nelson, P.J. (2002) If extremists vote how do they express themselves? An empirical test of an expressive theory of voting. Public Choice 113 (3–4): 425–436.
Article Google Scholar - Hainsworth, P. (2000) The front national: From ascendancy to fragmentation on the French extreme right. In: P. Hainsworth (ed.) The Politics of the Extreme Right. From the Margins to the Mainstream. London: Pinter.
Google Scholar - Husbands, C.T. (1992) The Netherlands: Irritants on the body politic. In: P. Hainsworth (ed.) The Extreme Right in Europe and the USA. London: Pinter.
Google Scholar - Ignazi, P. (2003) Extreme Right Parties in Western Europe. Oxford: Oxford University Press.
Book Google Scholar - Ivarsflaten, E. (2005) The vulnerable populist right parties: No economic realignment fuelling their electoral success. European Journal of Political Research 44 (3): 465–492.
Article Google Scholar - Janssens, P. (2000) Het cordon sanitaire moet waterdicht blijven. Streven 67: 681–686.
Google Scholar - Kestel, L. and Godmer, L. (2004) Institutional inclusion and exclusion of extreme-right parties in Austria, Germany and France. In: R. Eatwell and C. Mudde (eds.) Western Democracies and the New Extreme Right Challenge. London: Routledge.
Google Scholar - Kestilä, E. (2006) Is there demand for radical right populism in the Finnish electorate? Scandinavian Political Studies 29 (3): 169–191.
Article Google Scholar - Kritzinger, S., Klemmensen, R. and Chari, R. (2004) Party leadership and party cohesion: determining factors of ‘government participation’ and incumbency success of right-wing parties? Paper read at ECPR Joint Sessions of Workshops, Uppsala University.
- Kroh, M. (2003) Parties, Politicians, and Policies: Orientations of Vote Choice Across Voters and Contexts. Amsterdam, The Netherlands: University of Amsterdam.
Google Scholar - Lazarsfeld, P.F., Berelson, B. and Gaudet, H. (1948) The People's Choice. New York: Columbia University Press.
Google Scholar - Lubbers, M. (2001) Exclusionistic Electorates: Extreme Right-Wing Voting in Western Europe. Nijmegen, The Netherlands: ICS Dissertations.
Google Scholar - Lubbers, M. and Scheepers, P. (2001) Explaining the trend in extreme right-wing voting: Germany 1989–1998. European Sociological Review 17 (4): 431–449.
Article Google Scholar - Lubbers, M., Gijsberts, M. and Scheepers, P. (2002) Extreme right-wing voting in western Europe. European Journal of Political Research 41 (3): 345–378.
Article Google Scholar - Lucardie, P. (1998) The Netherlands: The extremist center parties. In: H.G. Betz and S. Immerfall (eds.) The New Politics of the Right: Neo-populist Parties and Movements in Established Democracies. New York: St. Martin's Press.
Google Scholar - Macdonald, S.E., Listhaug, O. and Rabinowitz, G. (1991) Issues and party support in multiparty systems. American Political Science Review 85: 1107–31.
Article Google Scholar - Maddens, B. and Fiers, S. (1998) Les partis flamands face au poids du Vlaams Blok. In: P. Delwit, J.M. De Waele and A. Rea (eds.) L’Extrême droite en France et en Belgique. Brussels, Belgium: Éditions Complexe.
Google Scholar - Meguid, B. (2005) Competition between unequals: The role of mainstream party strategy in niche party success. American Political Science Review 99 (3): 435–52.
Article Google Scholar - Minkenberg, M. and Schain, M. (2003) The front national in context: French and European dimensions. In: P. Merkl and L. Weinberg (eds.) Right-Wing Extremism in the Twenty-First Century. Portland, OR: Frank Cass.
Google Scholar - Mudde, C. and van Holsteyn, J. (2000) The Netherlands: Explaining the limited success of the extreme right. In: P. Hainsworth (ed.) The Politics of the Extreme Right: From the Margins to the Mainstream. London/New York: Pinter.
Google Scholar - Nannestad, P. and Paldam, M. (2002) The cost of ruling: A foundation stone for two theories. In: H. Dorussen and M. Taylor (eds.) Economic Voting. London: Routledge.
Google Scholar - Paldam, M. (1986) The distribution of election results and the two explanations of the cost of ruling. European Journal of Political Economy 2: 5–24.
Article Google Scholar - Powell, G.B. and Whitten, G.D. (1993) A cross-national analysis of economic voting: Taking account of the political context. American Journal of Political Science 37 (2): 391–414.
Article Google Scholar - Riedlsperger, M. (1998) The freedom party of Austria: From protest to radical right populism. In: H.G. Betz and S. Immerfall (eds.) The New Politics of the Right: Neo-Populist Parties and Movements in Established Democracies. New York: St. Martin's Press.
Google Scholar - Rose, R. and Mackie, T. (1983) Incumbency in government: Asset or liability? In: H. Daalder and P. Mair (eds.) Western European Party Systems: Continuity and Change. London: Sage.
Google Scholar - Rydgren, J. (2004) Explaining the emergence of radical right-wing populist parties: The case of Denmark. West European Politics 27 (3): 474–503.
Article Google Scholar - Schikhof, M. (1998) Strategieen tegen extreem-rechts en hun gevolgen. In: C. Mudde and J.J.M. van Holsteyn (eds.) Extreem-rechts in Nederland. The Hague, The Netherlands: Sdu Uitgevers.
Google Scholar - Shepsle, K.A. (1991) Models of Multiparty Electoral Competition. London: Routledge.
Google Scholar - Simon, H.A. (1985) The dialogue of psychology with political science. American Political Science Review 79: 293–304.
Article Google Scholar - Stimson, J.A. (1985) Regression in space and time: A statistical essay. American Journal of Political Science 29: 914–947.
Article Google Scholar - Strøm, K. (1990) Minority Government and Majority Rule. New York: Cambridge University Press.
Google Scholar - Sundberg, J. and Wilhelmsson, N. (2004) Moving from government to government: The transformation of the Finnish greens. Paper read at ECPR Joint Sessions of Workshops; 13–18 April 2004, Uppsala.
- Swyngedouw, M., Billiet, J., Carton, A. and Beerten, R. (1998) De (on)redelijke kiezer. Onderzoek naar de politieke opvattingen van Vlamingen. Verkiezingen van 21 mei 1995. Louvain, Belgium: Acco.
Google Scholar - Tillie, J. (1995) Party Utility and Voting Behaviour. Amsterdam, The Netherlands: Het Spinhuis.
Google Scholar - Van der Brug, W. (1997) Where's the Party? Voters’ Perceptions of Party Positions, Department of Political Science. Amsterdam, The Netherlands: University of Amsterdam.
Google Scholar - Van der Brug, W. and Fennema, M. (2003) Protest or mainstream? How the European anti-immigrant parties developed into two separate groups by 1999. European Journal of Political Research 42 (1): 55–76.
Article Google Scholar - Van der Brug, W., Fennema, M. and Tillie, J. (2000) Anti-immigrant parties in Europe: Ideological or protest vote? European Journal of Political Research 37: 77–102.
Google Scholar - Van der Eijk, C. (2002) Design issues in electoral research: Taking care of (core) business. Electoral Studies 21 (2): 189–206.
Article Google Scholar - Van der Eijk, C. and Franklin, M.N. (1996a) Choosing Europe?: The European Electorate and National Politics in the Face of Union. Ann Arbor, MI: The University of Michigan Press.
Book Google Scholar - Van der Eijk, C. and Franklin, M.N. (1996b) Choosing Europe? The European Electorate and National Politics in the Face of Union. Ann Arbor, MI: University of Michigan Press.
Book Google Scholar - Van der Eijk, C. and Kroh, M. (2002) Alchemy or science? Discrete choice models for analyzing voter choice in multi-party contests. Paper read at APSA Annual Conference, Boston, MA.
- Van der Eijk, C., Franklin, M. and Van der Brug, W. (1999) Policy preferences and party choice. In: H. Schmitt and J. Thomassen (eds.) Political Representation and Legitimacy in the European Union. Oxford: Oxford University Press.
Google Scholar - Van der Eijk, C., van der Brug, W., Kroh, M. and Franklin, M. (2006) Rethinking the dependent variable in electoral behavior – On the measurement and analysis of utilities. Electoral Studies.
- Van Donselaar, J. (1995) De staat paraat? De bestrijding van extreem-rechts in West-Europa. The Hague, The Netherlands: Babylon-De Geus.
Google Scholar - Van Praag, P. (2005) De veranderende Nederlandse campagnecultuur. In: K. Brants and P.V. Praag (eds.) Politiek en media in verwarring. De verkiezingscampagnes in het lange jaar 2002. Amsterdam, The Netherlands: Het Spinhuis.
Google Scholar - Van Spanje, J. and van der Brug, W. (2007) The party as pariah: The exclusion of anti-immigration parties and its effect on their ideological positions. West European Politics 30 (5): 1022–1040.
Article Google Scholar - Villalba, B. (1998) L’esquive. La gauche et la droite face au front national. In: P. Delwit, J.M. De Waele and A. Rea (eds.) L’Extrême droite en France et en Belgique. Brussels, Belgium: Éditions Complexe.
Google Scholar - Westholm, A. (1997) Distance versus direction: The illusory defeat of the proximity theory of electoral choice. American Political Science Review 91: 865–883.
Article Google Scholar - Whitten, G.D. and Palmer, H.D. (1996) Heightening comparativists concern for model choice – Voting behavior in Great Britain and the Netherlands. American Journal of Political Science 40: 231–260.
Article Google Scholar
Author information
Authors and Affiliations
- European University Institute, Italy
Joost Van Spanje - ASCoR, University of Amsterdam, The Netherlands
Joost Van Spanje - ASSR, University of Amsterdam, The Netherlands
Wouter Van der Brug
Authors
- Joost Van Spanje
- Wouter Van der Brug
Corresponding author
Correspondence toJoost Van Spanje.
Appendix
Appendix
Method by which analyses were conductedFootnote 18
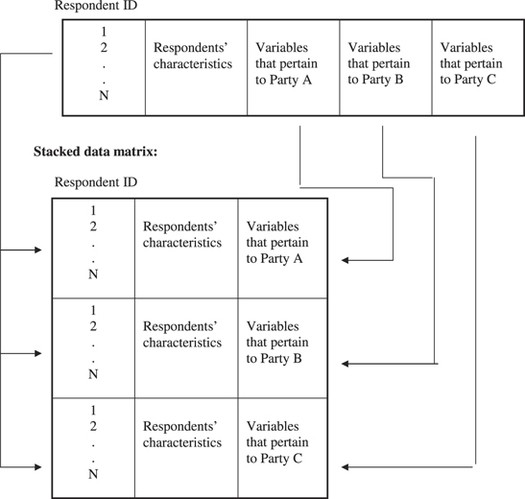
The dependent variable in our analysis stems from a series of questions – one for each party – which asks respondents how likely it is that they will ever vote for this party. Earlier research (Tillie, 1995) has shown that these variables perform in the way that Downs (1957) imagined party utility to perform. The electoral preferences obtained from these questions yield a large number of variables: one for each party. In order to answer our research questions these should all be analysed simultaneously. This can be achieved by a variant on the technique suggested for regression in time and space (Stimson, 1985), which involves a regression analysis on a ‘stacked’ data matrix. This is a matrix derived from a ‘normal’ survey data matrix, in which the records represent every respondent*party combination. Figure A1 illustrates graphically how the original data matrix is transformed into a stacked matrix.
Figure A1
The alternative text for this image may have been generated using AI.
Structure of the data matrix.
The dependent variable in the analyses is the observed propensity to vote for the party that is indicated in the respective respondent*party combination. In this data matrix, the dependent variable thus pertains to each of the parties in turn, and can be considered as a generic measure of party support. In this stacked data matrix, independent variables that pertain to a relation between party and voter have to be specially constructed. A party's position on the left/right scale, for example, will not capture in this design the effect of ideology on propensity to vote, but a distance between the left/right positions of voter and the respective party does.
In the European Elections Studies of 1989−2004, vote propensities were measured for 21 509 individual respondents in the countries that we selected. In the stacked data matrix each respondent is represented by as many ‘cases’ as there are parties for which (s)he indicated a vote propensity. The stacked data matrix has 158 646 entries.
When no party placement scores on specific issues are available, independent variables have to be constructed empirically. This is done by predicting propensities to support a party on the basis of a simple regression analysis for that party in the original data matrix. This is done for each of the parties in turn. These predicted values (_y_-hats) are simply linear transformations of the original independent variables. These are saved and inserted as new predictors of party support in the stacked data matrix.Footnote 19
This procedure was applied for the variables social class, income, religion, EU-approval and issues. For example, to estimate the contribution of social class to the explanation of party choice, we assessed empirically how well respondents’ subjective assessments of their social class predict preferences for each of the parties. So for each of the parties in turn, a regression analysis was conducted with social class as the independent variable (in the form of four dummys) and vote propensities for that party as the dependent variable. The predicted values of each of these regressions (_y_-hats) were saved and inserted in the stacked data matrix as new predictors of vote propensities. The variable, with which the effect of religion is estimated, is constructed in a similar way: it consists of predicted values of separate regressions per party. The independent variables in these separate regressions were five dummys indicating five different religious denominations and church attendance as an additional variable. The same procedure was used to estimate the effect of EU-approval (a linear bivariate regression). In the case of the issues, we used the answers to the question what is the most important problem facing your country? What are the second and third most important problems? On the basis of these answers we constructed a large set of dummy variables, which indicate whether a respondent mentioned a specific problem, or not. These variables were then used as independent variables in the regressions per party.
Since multiple observations in the stacked data matrix refer to the same respondent, these observations are not independent from each other. Moreover, the distribution of the dependent variable is rather skewed, so that the data do not meet some assumptions that OLS regression requires. For this reason we estimated robust standard errors (in STATA), which do not assume a homoskedastic distribution of the error terms. Moreover, multiple observations pertaining to one respondent were defined as dependent (using the option ‘cluster’ in STATA).
Rights and permissions
About this article
Cite this article
Van Spanje, J., Van der Brug, W. Being intolerant of the intolerant. The exclusion of Western European anti-immigration parties and its consequences for party choice.Acta Polit 44, 353–384 (2009). https://doi.org/10.1057/ap.2009.7
- Published: 03 November 2009
- Issue date: 01 December 2009
- DOI: https://doi.org/10.1057/ap.2009.7