WISeREP—An Interactive Supernova Data Repository (original) (raw)
1538-3873/124/917/668
ABSTRACT
We have entered an era of massive data sets in astronomy. In particular, the number of supernova (SN) discoveries and classifications has substantially increased over the years from few tens to thousands per year. It is no longer the case that observations of a few prototypical events encapsulate most spectroscopic information about SNe, motivating the development of modern tools to collect, archive, organize, and distribute spectra in general and SN spectra in particular. For this reason, we have developed the Weizmann Interactive Supernova Data Repository (WISeREP)—an SQL-based database (DB) with an interactive Web-based graphical interface. The system serves as an archive of high-quality SN spectra, including both historical (legacy) data and data that are accumulated by ongoing modern programs. The archive provides information about objects, their spectra, and related metadata. Utilizing interactive plots, we provide a graphical interface to visualize data, perform line identification of the major relevant species, determine object redshifts, classify SNe, and measure expansion velocities. Guest users may view and download spectra or other data that have been placed in the public domain. Registered users may also view and download data that are proprietary to specific programs with which they are associated. The DB currently holds more than 8000 spectra, of which more than 5000 are public; the latter include published spectra from the Palomar Transient Factory (PTF), all of the SUSPECT (Supernova Spectrum) archive, the Caltech-Core-Collapse Program (CCCP), the CfA SN spectra archive, and published spectra from the University of California, Berkeley, SNDB repository. It offers an efficient and convenient way to archive data and share it with colleagues, and we expect that data stored in this way will be easy to access, increasing its visibility, usefulness, and scientific impact. We encourage the SN community worldwide to make use of the data and tools provided by WISeREP and to contribute data to be made globally available and archived for posterity.
Export citation and abstractBibTeXRIS
Since the realization that supernovae are new physical phenomena distinct from novae (Zwicky 1938) and the first introduction of the spectroscopic classification of these objects (Minkowski 1941), the relative rarity of bright, nearby SNe that could be studied in detail precluded rapid accumulation of large spectroscopic data sets. This state of affairs began to change in the last two decades or so with the commencement of large, efficient supernova survey programs. These have increased the number of SN discoveries from tens to thousands per year (e.g., Gal-Yam & Mazzali 2011). CCD-based spectrographs with increased sensitivity now yield digital data that are easy to store and distribute.
The wealth of spectroscopic data available can no longer be easily described in single publications (e.g., as done in the authoritative review of Filippenko [1997]). Several groups have accumulated large amounts of spectroscopic data, some of it made publicly available (notably, at the Harvard CfA; the University of California, Berkeley [UC Berkeley], SN group; and the Asiago SN database), while specific spectroscopic databases were also established by specific projects (e.g., the SuperNova Legacy Survey;1 Guy et al. 2010). In a pioneering effort, the supernova group at Oklahoma University has set up SUSPECT2 (Richardson et al. 2001), which provided a valuable community resource, but, with increasing influx of data, it is difficult to search through and maintain.
With the above in mind, we developed WISeREP (formerly known as the Weizmann Institute of Science Experimental Astrophysics Spectroscopy System [WISEASS])—a new spectroscopic data repository, which is fully searchable, has a graphic interface, is professionally maintained by the Weizmann Institute of Science computing center, and offers new analysis tools, in addition to data archiving and distribution. This searchable database is already a leading repository for publicly available supernova and transient spectra, holding all of the content of the SUSPECT archive, all published CCCP and PTF spectra, the NTT/NOT SDSS-II SN spectra3 (Östman et al. 2011), the complete set of CfA Type Ia SN spectra4 (Blondin et al. 2012) from the CfA SN archive, all published spectra from the Filippenko group at UC Berkeley SNDB5 (SN database; Silverman et al. 2012), and additional material published by the Pan-STARRs (PS1) consortium (Kaiser et al. 2010; Chomiuket al. 2011) and large ESO/NTT supernova program (PI Benetti; Valenti et al. 2011). WISeREP has already began accumulating and distributing spectra of the large Public ESO Spectroscopic Survey for Transient Objects (PESSTO; Valenti et al. 2012) and will hold all future PTF data releases (∼3000 spectra).
The aim of this article is to present the data that may be accessed and retrieved by the WISeREP DB and system and to introduce some of its unique features and capabilities. This article is organized as follows: We begin by reviewing the overall design and content of the DB and World Wide Web interface in § 2, followed by an explanation of the interactive online spectroscopic analysis tools in § 3. Section 4 describes how ownership of data and access permissions is handled. Specific additional utilities and cross-reference options are described in § 5. We briefly mention some future prospects in § 6—existing and foreseen data sources, as well as features and additions that are being considered for future implementation. We conclude in § 7 by showing exemplary sets of common (prototype) SN spectra, as well as peculiar types encountered in recent studies.
The system is based on a MySQL relational DB with a Web interface that is implemented mainly in PHP embedded within a DRUPAL—an open-source content management system—framework.
2.1. Database Tables and Relations
The two major entities (implemented by the corresponding tables) are those of objects (sources/targets) and spectra (with a 1∶N relationship; i.e., several spectra may exist for each object). Clearly, the majority of objects are SNe of the different types; however, there are also other objects for which some spectra exist in the system (e.g., novae and other cataclysmic variables, other variable stars, active galactic nuclei (AGNs), galaxies, and spectrophotometric standard stars). The various object types can be reviewed in the appropriate table or Web page (see § 2.2).
The basic properties of an object are its name (whether a generally recognized one or as attributed according to the naming convention of the relevant survey/program) and coordinates (right ascension and declination). Extensive accompanying data are specified when known: e.g., the IAU name (of a SN, if it exists); redshift and host galaxy name; discovery magnitude, filter, and date; and maximum magnitude, filter, and date. For both an object and a spectrum, an indication exists as to whether the data are publicly available or not. Each object and spectrum are also usually associated with a certain program (a list of the defined programs is given in the programs Web page). In many cases, a program is the name of a survey, but it can also be a specific study or archive from which the data were obtained (or to which the data “belong”). Proprietary data are accessible only to users affiliated with the relevant programs (see § 4).
A spectrum is linked to an object. In addition to the ASCII data file, the archive lists the following information: instrument (uniquely linked to a telescope), observation date and time, exposure time, aperture (slit), spectrum type (object, host, sky, or arcs), observer (s), reducer(s) and reduction date, and, optionally, the corresponding FITS file (usually, the 1D wavelength and flux calibrated). When known, additional information regarding the applied setup will be given (e.g., dichroic, grism, grating, and standard star), as well as references to relevant publications. Like objects, spectra may be linked to a specific program and marked as being publicly available or not.
Tables of the major entities (such as objects and spectra) include additional informative fields—remarks (free text), creation date and last modified (date), created by and modified by (user name)—to enable keeping track of the data creation/modification details.
For both an object and a spectrum it is possible to specify an accompanying list of free-text remarks, as well as a set of related files (additional ASCII files, FITS files, graphical files, or any other file types). This mode of operation supports attaching any additional required pieces of data (e.g., additional calibration products, figures and plots) to both objects and spectra, without limitation on the amount of data that can be stored per entity or its nature. For example, even though the system in its current state is not formally designed to hold photometric data (but see § 6.2), it is possible to store in this way, and associate with an object, photometry-related files. These may include images, light-curve data (tables/plots), photometric calibrations, etc. These related remarks and related files are implemented by the tables Objremarks, Objfiles, Specremarks, and Specfiles, for the objects and spectra, respectively.
Surrounding the main tables of objects and spectra (and their related entities) are auxiliary tables; these hold valuable information and may serve on their own as a useful astronomical data repository. The major ones (which are also accessible from the main menu; see § 2.2) are instruments, with a _N_∶1 relationship to telescopes (both contain the basic information and links to the relevant Web pages), programs, object types, a list of all the coordinates that are continuously appearing in The Astronomer’s Telegram (ATEL; see § 5), and an automatically updated list of the IAU-designated SNe.
An entity-relationship diagram, listing the main tables of the DB and their columns, is available online from the My SQL Query page (§ 2.2).
2.2. Web Interface
Upon logging in online,6 with either a public/anonymous or a provided personal or group account, a main menu appears on the left (Fig. 1 displays a snapshot of the home page.) Statistical information about the content of the DB and some selected links, internal and external (of e.g., major SN archives and surveys), are shown below the main menu.
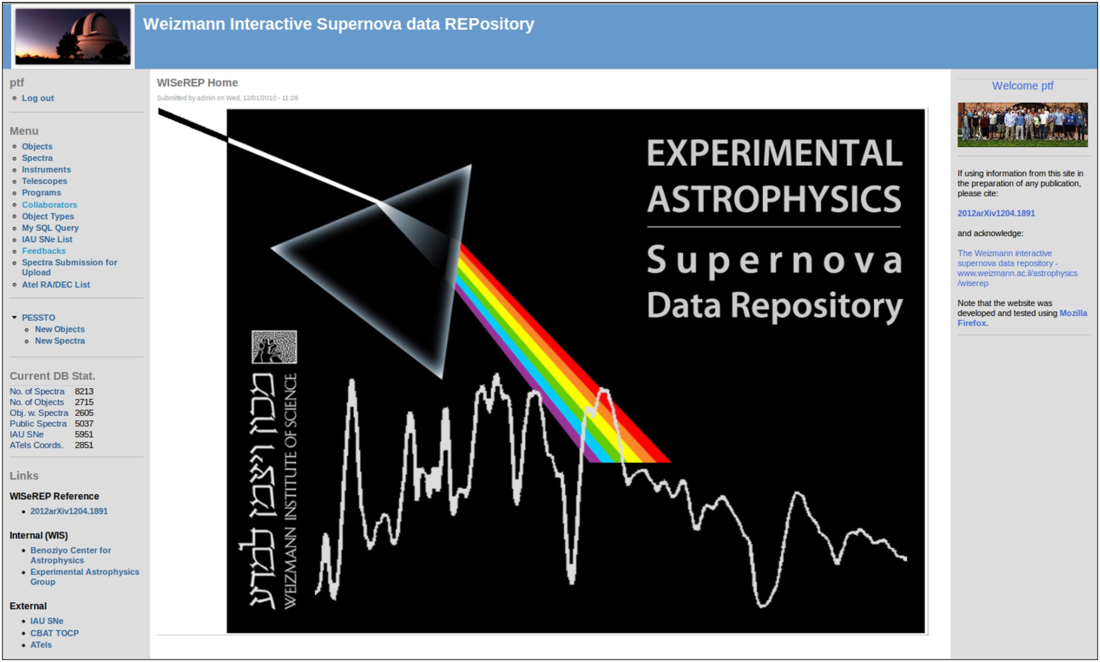
Fig. 1.— Screenshot of the home page after login (of user ptf in this example). Every user account is associated with a certain role, according to which access permissions are set. The main menu is shown on the left. In addition to various auxiliary tables (such as telescopes, instruments, programs, and object types), the main entities are those of objects and spectra (the first two on the menu). The required spectra/data may be reached via either of those two pages. Instructions for submitting spectra for upload to the archive appear on the Spectra Submission for Upload page.
Data can be accessed via the two pages dedicated to objects and spectra. Generally, each Web page consists of a query-field section (including sort-by options); upon submission of the query, the resulting rows are displayed below.
Objects page.—Objects may be retrieved according to the following query fields: object name (either by selecting from a drop-down list of all existing names or by typing free text to include any part of the name), the type of object (via selection from list or free text), and program name. It is also possible to query by coordinates, either right ascension or declination between certain ranges or a cone search around a specific right ascension and declination, and also according to the general informative details of when the object was created or last modified (date ranges) and by whom (free-text user name). Sort-by options include the name, object type, right ascension, and program name. The details of the retrieved objects include the majority of the objects table fields as listed above, with links to a variety of cross-references (both external and internal tools and data repositories) according to the object’s coordinates (see § 5). If spectra, related files, or related remarks exist for the object, these can be shown by clicking the appropriate links in the object’s entry.
Spectra page.—Query fields similar to the above are available here, with the addition of spectrum type (object, host, sky, arcs), instrument/telescope, ranges of dates for observation and reduction dates, observer(s), and reducer(s). It is also possible to query by any part of a publication/contribution specification. Sort-by options include, among others, e.g., object name, type, observation date, observer, and instrument. The details of the retrieved objects include the majority of the spectra table fields as listed above, with links for downloading the spectrum ASCII/FITS files and any existing related files. If the number of retrieved spectra exceeds a certain value (currently set to 50), then only static plots of the spectra are shown; otherwise, interactive plots are displayed, which enable zooming, binning, and identification of major SN/galactic lines (§ 3).
My SQL Query page.—Registered users that are familiar with the DB structure and SQL syntax may construct their own queries. A link for displaying the entity-relationship diagram, which lists the main tables of the DB and their columns, is provided to help compose such queries. See Figure 2 for an example.
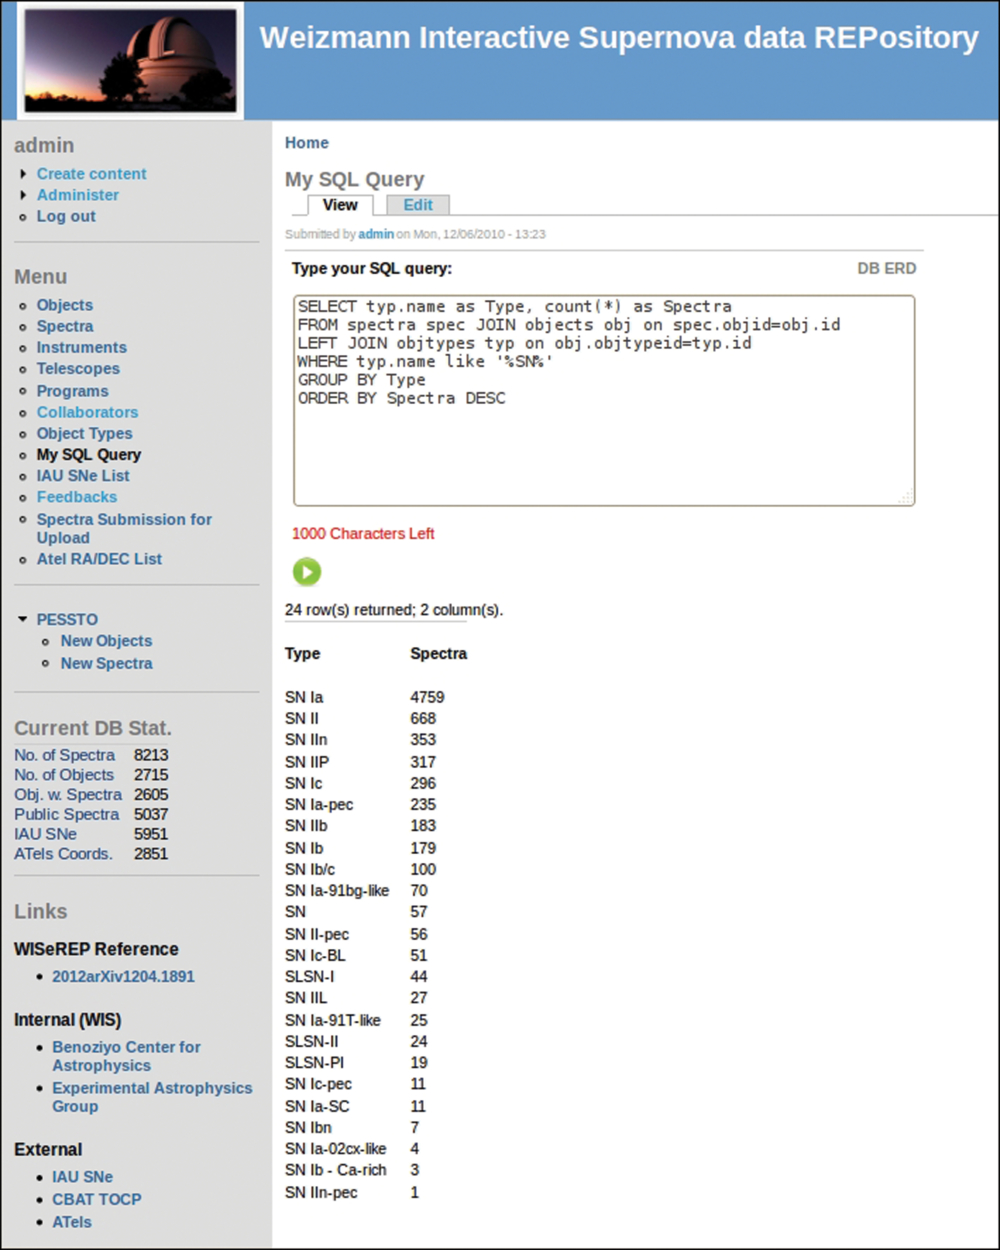
Fig. 2.— Screenshot of the My SQL Query page. Registered users with basic knowledge in writing SQL SELECT statements may compose their own queries. Shown here is an example of a query displaying the number of spectra that currently exist in the database of each SN type. An entity-relationship diagram, listing the tables of the database and their columns, is provided to help compose queries.
Spectra Submission for Upload page.—the current server configuration of the system—Web page and DB—is such that it is possible to insert/update/upload data only from within the Weizmann Institute. Outside users may view and download data (according to their access permissions) but cannot modify it. Therefore, a procedure has to be followed for submitting spectra and data for upload to the system; the instructions are described on this Web page. The procedure basically involves creating a tar ball of the ASCII files (and, optionally, FITS files and additional related files), preparing a list of the accompanying metadata (by filling an existing template), and sending these two items to the archive administrator.
It should be emphasized that it is possible to upload spectra that should not be made available to the public (e.g., unpublished material). Such spectra (and their objects) can be linked to a certain program, and only those accounts that are members of this program (see § 4) may obtain access to the data. Users can thus use WISeREP to archive and share proprietary data and make use of the analysis tools, without committing to immediate public release of their data. At any given stage, objects and/or spectra can be updated as “public” (i.e., available to the public) or “nonpublic,” following the instructions of the data owners.
Additional entries exist in the menu for some auxiliary entities, such as instruments, telescopes, programs, and object types. These are also valuable data repositories (which may serve the occasional astronomer): for instance, for querying and reviewing the information of many instruments/telescopes, which includes direct links to their specific Web sites.
The Atel RA/DEC List page will be described in § 5.
A novel feature of the WISeREP archive is that it provides online analysis tools that can be interactively applied to selected data. Interactive plots, with zooming and overplotting capabilities, can be used to visualize the data and inspect its quality and utility to the user. The plots also provide a graphical interface for interactive line identification, which is useful to determine host redshifts, to investigate supernova elemental composition and classification, and to determine ejecta expansion velocities. Whenever a redshift is known and specified for the object, the plots display both the observed and the rest-frame wavelength scales. A list of major elements (with specific ionization levels) that are commonly identified in SNe of different types is shown next to each plot of a spectrum. When a check box of a chemical element is marked, its lines are overplotted and it is possible to specify and modify both the redshift (by default, the object’s redshift, if specified) and an expansion velocity, which leads to the lines being redshifted or blueshifted, respectively. Hovering with the mouse over a check box displays the lines (wavelengths) of the corresponding element that are currently defined for overplotting. In addition to the predefined set of elements, it is possible to specify custom wavelengths for plotting, and there is also an option to overplot common galaxy lines (which include the Balmer series, N II, O II, O III, Na I, Mg II, S II, and Ca II H and K). This option is useful for determining the redshift, when it is not yet known, using narrow emission/absorption features (of the host galaxy) that may be visible in the spectrum. Atmospheric A and B absorption bands (telluric lines) can also be displayed, which can serve for both identifying artifacts that may remain from telluric line removal or for providing a sanity check on the wavelength solution of a spectrum. Zooming on specific regions is possible using mouse selection, and different spectral binning may be applied for visualization.
Examples of line identifications for two different SNe are shown in Figures 3 and 4. In Figure 3 we display the identification of major emission lines in a nebular spectrum of a candidate pair-instability SN (PISN) from the PTF survey PTF10nmn (Yaron et al. 2012, in preparation); with a redshift of z = 0.123, zero-expansion velocities are applied as appropriate for an emission-line nebular spectrum. In Figure 4 we display examples of line identifications in two spectra, separated by ∼2 weeks, of the recent Type IIb SN in M51-SN 2011dh (PTF11eon; Arcavi et al. 2011). See the figure legends for details.
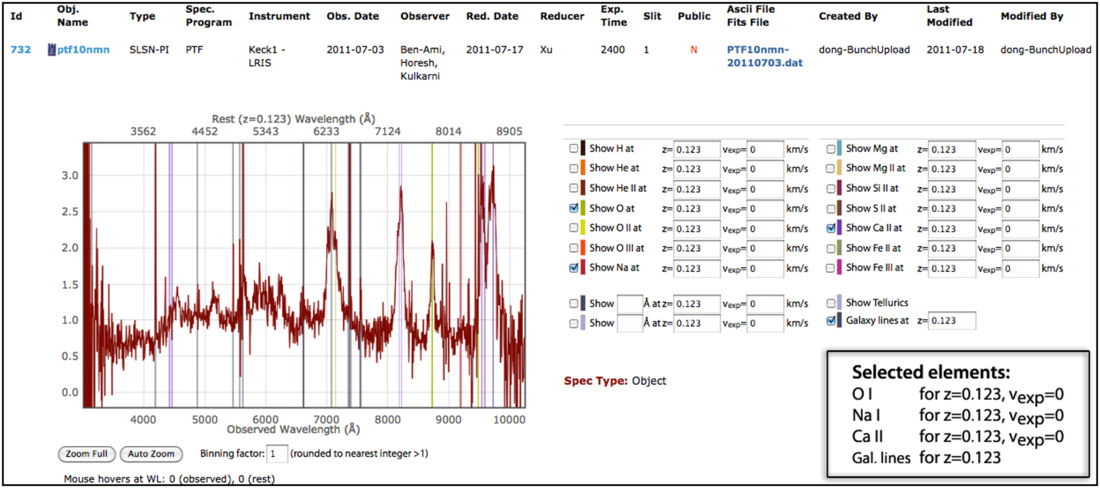
Fig. 3.— Section of a screenshot of the Spectra page, showing an example of line identifications in the Keck1-LRIS nebular spectrum of the PISN candidate PTF10nmn. The plot is interactive and enables live zooming, binning, and overplotting. The top _x_-axis marks the rest-frame wavelengths whenever the redshift is known and indicated. Note the overplotting of a selection of O I, O II, Na I, and Ca II lines for the appropriate redshift and for zero-expansion velocity, corresponding to an emission-line nebular spectrum. Common galaxy lines are also overplotted for the given redshift, aligning with the narrow host features (which can serve for both checking the validity of the spectrum wavelength solution and for determining the redshift when it is not already known). Inset at the lower right indicates the selected elements and parameters.
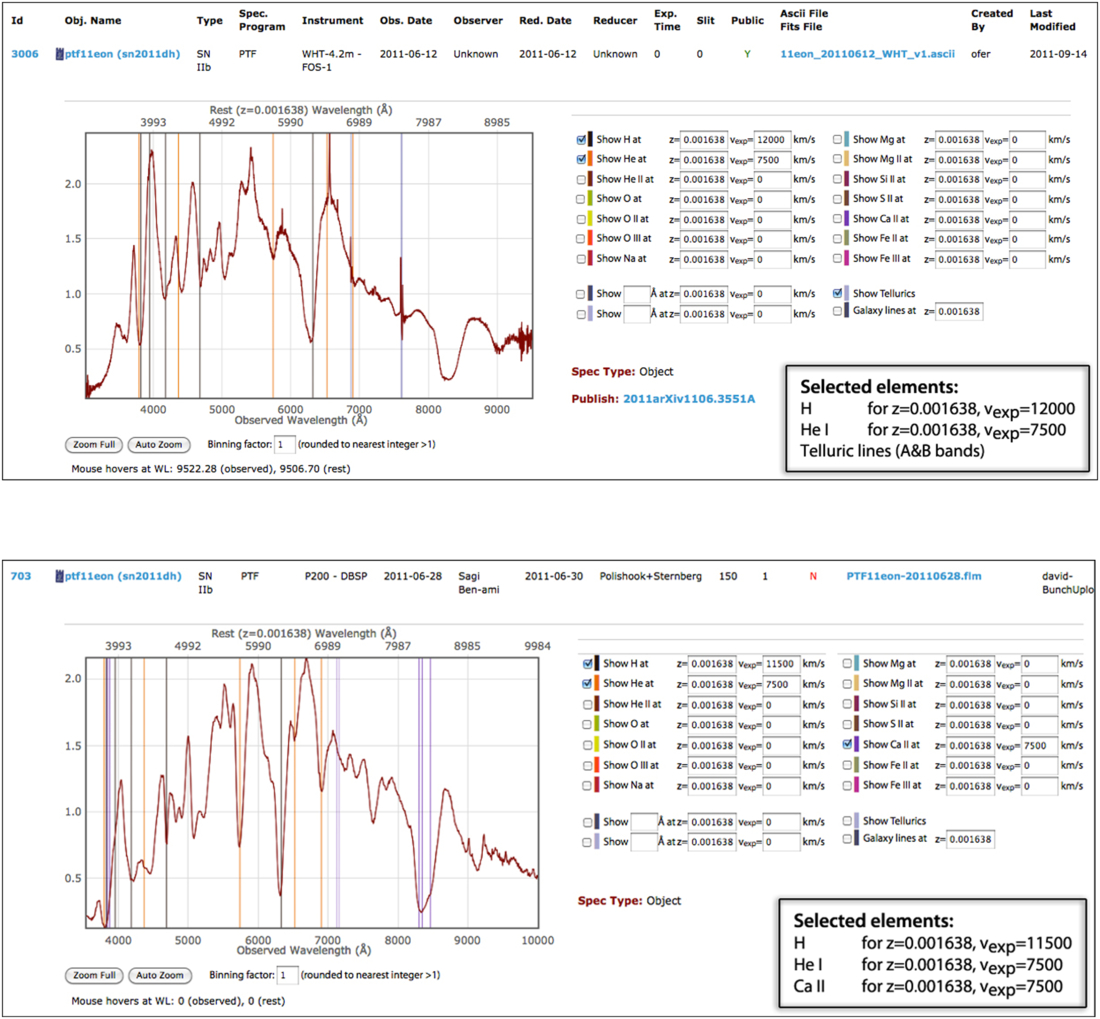
Fig. 4.— Example of line identification for two spectra of the recent Type IIb SN in M51-SN2011dh (PTF11eon; Arcavi et al. 2011). Top: William Herschel Telescope spectrum from June 12. Lines of H (Balmer series) and He I are overplotted for the appropriate redshift and expansion velocities -12,000 and 7500 km s-1, respectively. Note that whereas He lines are clearly emerging, the λ6678 line is obscured here by the narrow Hα emission line from the underlying host galaxy. Also plotted for demonstration are the telluric lines, which explain the corresponding artifacts seen on the spectrum. Bottom: P200-DBSP spectrum from ∼2 weeks later. Lines of H, He I, and Ca II are plotted for expansion velocities of 11,500 and 7500 km s-1. Insets at the lower right corners indicate the selected elements and parameters.
The interactive plots are useful to perform quick and efficient analysis online; to determine SN types, redshifts, and expansion velocities; and to select specific data for further detailed studies offline.
The purpose of WISeREP is to serve as a data repository for communities worldwide for holding, sharing, and analyzing spectra and data that are either public or private to a certain collaboration/program. The system therefore supports a modular management of ownership and access privileges.
A user can either log into the system as an occasional guest (in which case only the public data can be accessed) or, as a member of a specific collaboration/survey/program that is storing data in the archive, a user can log in using a personal or group account that has been provided. Each registered user account can be associated (via a mediating role definition) with one or several specific programs, whereas, from the other side, both objects and spectra can also be associated with a certain program. In this manner all access permissions and ownership of data are managed and followed.
It should be emphasized that every object and every spectrum can be independently linked to a program. Thus, for example, an object can be linked to a certain program, but it may have spectra that belong to other programs. Of those spectra, some could be marked as public (available to all), but those that are not publicly available can only be viewed and accessed by the accounts that are members of the corresponding programs.
This handling of ownership and access privileges enables each group/collaboration to not only use the archive to distribute data to the community, but also to share data that remain proprietary to the group members. Groups can thus use the archive as a useful collaboration platform, as well as use the analysis capabilities, without committing to a public data release. At any point in time, every object or spectrum can be individually marked as public or nonpublic. Users can choose to keep nonpublic data totally private (such that no other users know that these objects or spectra even exist) or to allow the system to show other users that additional data exist in the system, but are proprietary to specific groups; this mode will motivate collaborative efforts.
As part of the WISeREP Web page, we maintain additional useful utilities that are not necessarily an integral part of the archive, but offer convenient querying possibilities that may also serve those who are not necessarily searching for specific SN spectra or data.
The Atel RA/DEC List page enables searching The Astronomer’s Telegram according to coordinates: between values of right ascension and declination or a cone search around a given right ascension and declination. The possibility to search by coordinates is not provided by the ATEL Web page7 (there is no specific format for providing right ascension and declination values) and is clearly useful in various situations: e.g., for cross-referencing a new transient/object under study or to check (according to its coordinates) if it has been recently announced or not.
An entry exists in our DB for every coordinate that is specified in an ATEL, and within those entries it is also possible to query by ATEL information: post date, title, keywords, and authors. Upon submission of a query, clicking an ATEL number in the retrieved list brings up the telegram’s page from the ATEL Web page.
The list, a result of parsing each newly added ATEL entry, is automatically updated every hour and contains the majority of object right ascension and declination coordinates reported in The Astronomer’s Telegram (missing < ∼ 5% in total and complete to all new entries, including identification of possible nova [PNV], possible SN [PSN], and other variable-type [TCP] coordinates).
From both the Objects page and the Atel RA/DEC List page there are links (according to the object coordinates) to the following cross-references:
- 1.
ADS8 (SAO/NASA Astrophysics Data System)—position search results. - 2.
NED9 (NASA/IPAC Extragalactic Database). - 3.
SDSS (Sloan Digital Sky Survey) Navigator Tool10 (currently DR8). - 4.
SIMBAD11 astronomical database. - 5.
MAST12 (the Mikulski Archive for Space Telescopes) DSS FITS image retrieval. - 6.
WISE13 (Wide-field Infrared Survey Explorer) All-sky Release image data via the NASA/IPAC IRSA (Infrared Science Archive). - 7.
PTF image and source archive at the NASA/IPAC IRSA. - 8.
NASA’s HEASARC14 (High Energy Astrophysics Science Archive Research Center).
From the Objects page there is also an internal link to the Atel RA/DEC List page to automatically retrieve corresponding ATEL entries (if these exist) using the object coordinates.
6.1. Sources—SN Surveys and Archives
The archive currently holds SN spectroscopic data from several sources and programs. These include the complete SUSPECT archive (>1500 spectra for ∼180 SNe, all public); the 2603 Type Ia SN spectra obtained during 1993–2008 through the Center for Astrophysics (CfA) Supernova Program (Blondin et al. 2012); published spectra from the UC Berkeley SNDB (∼330 public spectra for ∼90 SNe; Silverman et al. 2012); the NTT/NOT SDSS-II SN spectra (∼240 public spectra for ∼190 SNe; Östman et al. 2011); PTF (Rau et al. 2009; Law et al. 2009; ∼3000 spectra in total, of which ∼60 are published spectra made public); CCCP—the Caltech Core-Collapse Project (Gal-Yam et al. 2007; Kiewe et al. 2012)—currently including ∼180 spectra, of which ∼20 are public; HST-Ia (observations of SNe Ia with Hubble Space Telescope [cycles 17 and 18; PI Ellis]; 75 spectra, internal to program members); HIRES (a study of Type Ia SN using high-resolution spectroscopy; Sternberg et al. 2011; 60 public spectra); PS1 public spectra (Chomiuk et al. 2011); public spectra from the large ESO/NTT program (Valenti et al. 2011; Taubenberger et al. 2011), and several other sources. We expect that additional data will be ingested into WISeREP in the near future from existing archives.
WISeREP will also serve as the curation and distribution facility for several ongoing and future surveys. In particular, the WISeREP system has began to serve as the distribution platform of the ESO large public spectroscopic PESSTO survey, which will host and distribute extensive public data sets of SN spectra and associated metadata and information on targets. PESSTO (see Valenti et al. 2012) is a 4(+1) year survey planned to deliver detailed, high-quality time series optical and NIR spectroscopy of ≳100 optical transients, to be obtained with the ESO-NTT telescope located in La Silla Paranal Observatory, Chile. WISeREP will also serve as the data portal of future PTF data releases (over 3000 spectra are already archived).
6.2. Additional Features and Tools
A major addition that is being considered for future implementation is extending the functionality of the system to include the archiving and analysis of photometric data, thus forming a more complete information reservoir of high-quality SN data. In particular, a graphic interface and automatic analysis of photometry (e.g., determination of peak SN dates and light-curve fitters) is foreseen.
An extension of spectral analysis capabilities is also planned, to include, e.g., line-fitting routines, to determine line widths and equivalent widths; online application of global spectral fitting software (e.g., the SuperNova Identification [SNID] tool [Blondin & Tonry 2007] and the supernova spectral fitting package Superfit [Howell et al. 2005]); queue-based application of parametric spectral synthesis routines (SYNAPPS; Thomas et al. 2011); and extension of spectral tools to include the IR and UV ranges.
High-level fitting results may be archived and distributed to further increase the utility of the data.
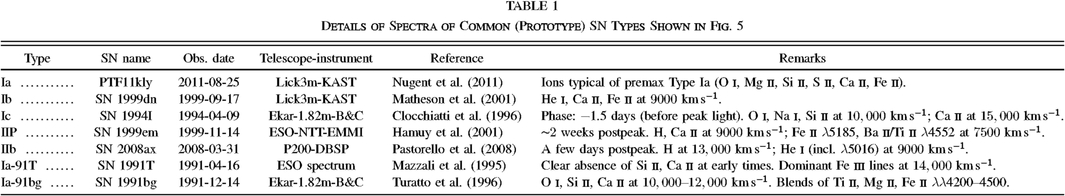
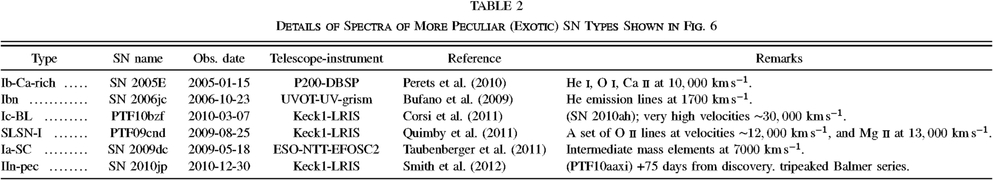
To further deliver a sense of the content and appearance of the system, as well as to provide a useful primer to the classification of common supernova spectra, in Figures 5 and 6 we show two representative sets of spectra. Figure 5 displays a set of seven spectra obtained around peak light (± 2 weeks) of common SN types, and in Figure 6 we show a set of spectra that serve as examples for some of the more peculiar cases we have encountered in recent years. See Tables 1 and 2 for the corresponding details.
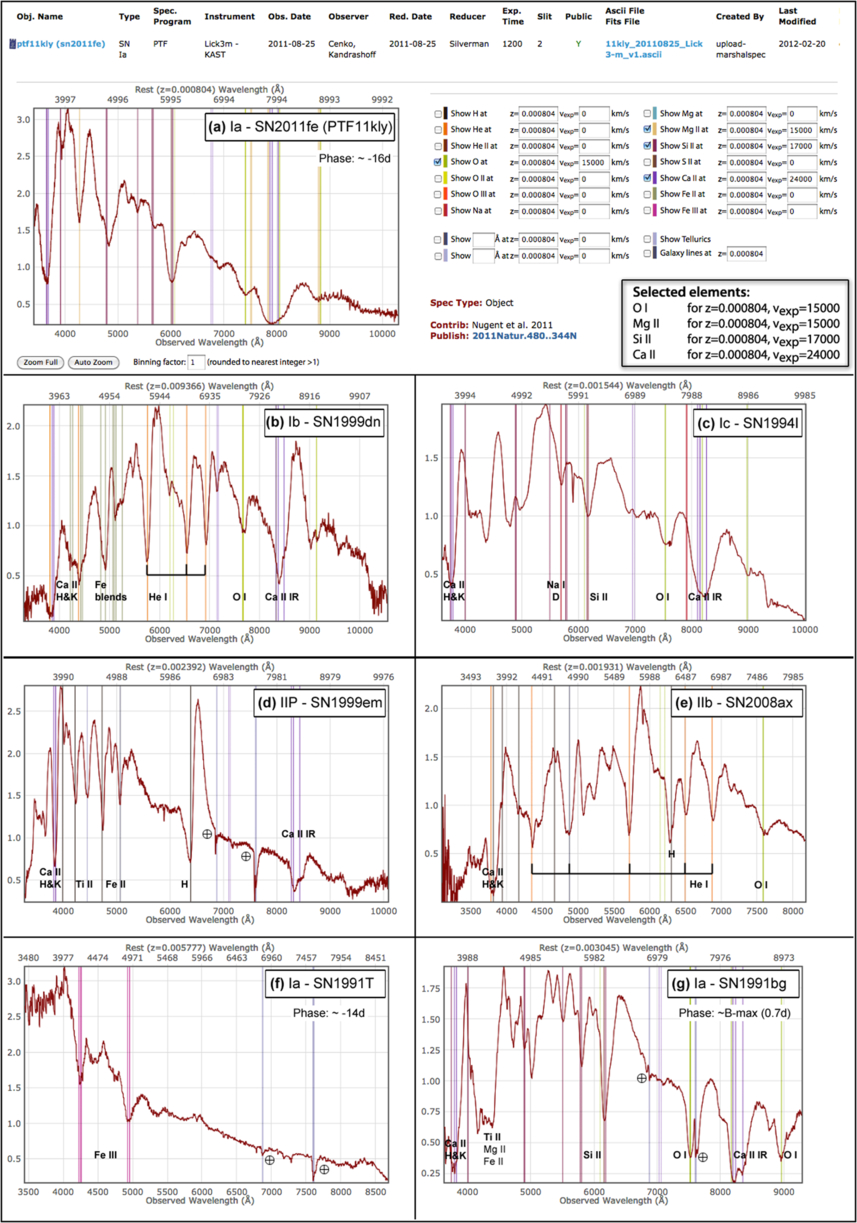
Fig. 5.— Plots of representative early-time spectra from the WISeREP archive (which originate from various programs—e.g., SUSPECT and PTF), denoting major SN types. For the recent Type Ia SN 2011fe, (a) displays a complete snapshot of the spectrum entry—the interactive plot alongside all related information that appears in the top (header) row and the element check-box area to the right. The remaining panels show only the graphs with the element identification lines overplotted; major features are marked. See Table 1 for details of the shown spectra.
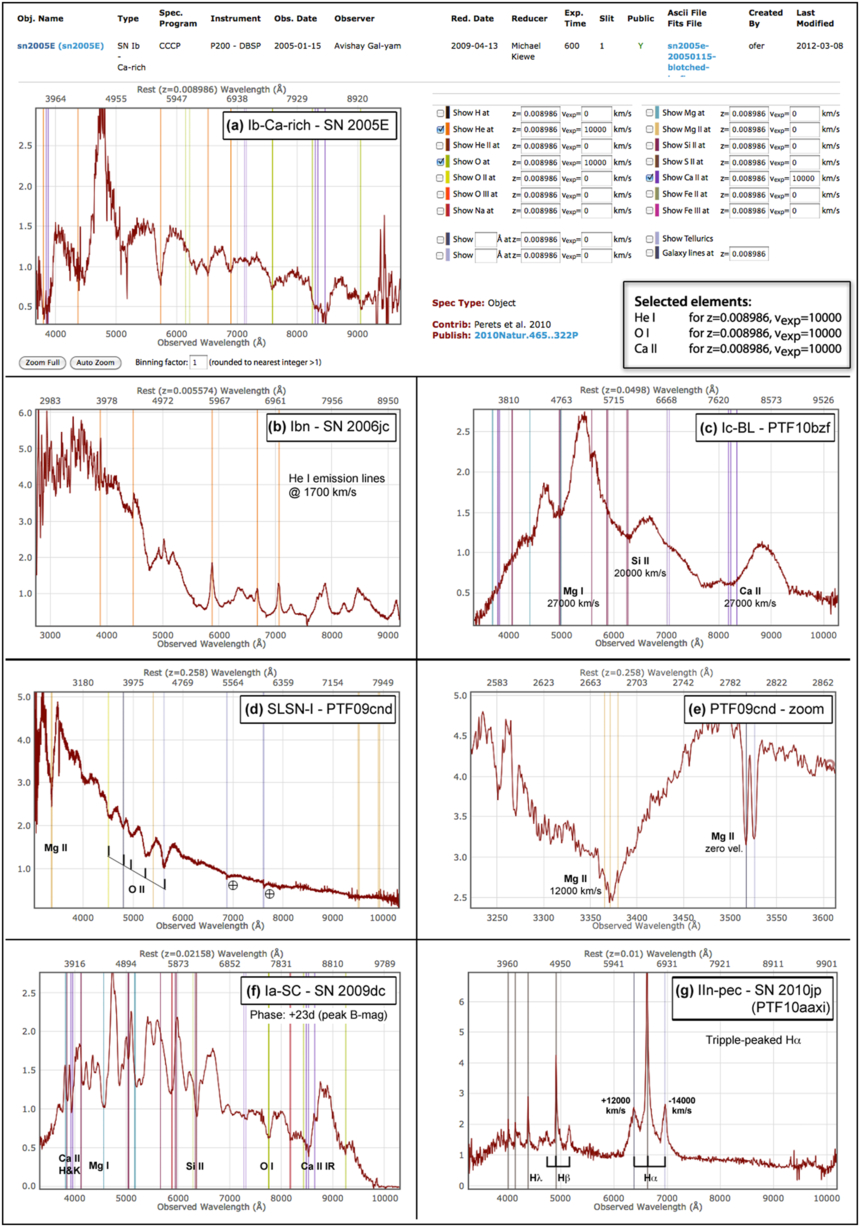
Fig. 6.— Representative set of spectra from the WISeREP archive denoting some of the more peculiar/exotic SN types. Like Fig. 5, the Type Ib Ca-rich SN 2005E is displayed as a complete snapshot of the spectrum entry in (a)—interactive plot, related information, and metadata. The other panels show only the graphs with the element identification lines overplotted. Panel e is an enlargement of the Mg II features region (broad blueshifted absorption and narrow doublet host absorption) of the PTF09cnd spectrum shown in (d). See Table 2 for details.
 |
|---|
 |
|---|
To conclude, we have reported here on the development of a new spectroscopic system that is fully searchable and offers online analysis tools in addition to data archiving and distribution. The interactive plots are useful to perform quick and efficient analysis online and to determine SN types, redshifts, and expansion velocities.
The archive already hosts more than 8000 spectra (of which >5000 are public) for ∼2600 objects, including the complete SUSPECT and CfA-Ia samples, and will serve as the curation and distribution facility for several ongoing and future surveys (e.g., the PESSTO survey and PTF data releases).
At any point in time, objects and spectra can be marked as publicly available or not. Only the users that are members of a relevant program may view and download its proprietary data. Therefore, users and groups can use WISeREP as a useful collaboration platform to archive and share proprietary data and make use of the analysis tools, without committing to immediate public release of their data.
We encourage the SN community worldwide to make use of the data and tools provided by WISeREP and to contribute data to be archived for posterity and made easily available to the community, thereby increasing its utility and the visibility of the article reporting it. For sending data for upload to the system, please follow the instructions specified in the Spectra Submission for Upload page.
We are aware that there may still be erroneous data (or metadata), missing information, or duplications of spectra (within a specific program or across programs), especially within the bulk of spectra ingested from the SUSPECT archive (e.g., ASCII files of spectra that have been uploaded with the wavelengths deredshifted and/or flux-dereddened, instead of the nonmanipulated reduced spectra). We would appreciate being notified whenever such cases are encountered so that we can correct and improve the content of this data repository continuously and on a regular basis. It is possible to log in to the WISeREP Web page15 as a guest user; members of programs supported by WISeREP should send a request for a personal (or a group) account by following the instructions on the home page.
We would like to thank the Supernova Spectrum (SUSPECT) team—Eddie Baron, Mary Hogan, and Jerod Parrent—for their help and cooperation in ingestion of the complete SUSPECT archive into the Weizmann Interactive Supernova Data Repository (WISeREP). In this respect, many thanks also go to Raphael Schepps and Adam Becker for their devoted help and effort in organizing and cleaning of SUSPECT data. We are grateful to the CfA supernova team—in particular, Stephane Blondin and Bob Kirshner—for their kind help and cooperation in ingestion of the CfA spectral data set into WISeREP. Special thanks to Derek Fox, Brian Schmidt, Stephen Smartt, and Eran Ofek for their helpful involvement and concern in various discussions and to Jeff Silverman for his continuous cooperation and valuable contribution (and specifically with regard to ingestion of the University of California, Berkeley, Supernova Database [SNDB] data). We highly appreciate the assistance of Giorgos Leloudas and Ariel Goobar of Stockholm University for their help with the incorporation of the complete SDSS-II NTT/NOT sample. We thank Iair Arcavi for his contribution to the development of the interactive plots.