Comparing estimates of climate change impacts from process-based and statistical crop models (original) (raw)
1748-9326/12/1/015001
Abstract
The potential impacts of climate change on crop productivity are of widespread interest to those concerned with addressing climate change and improving global food security. Two common approaches to assess these impacts are process-based simulation models, which attempt to represent key dynamic processes affecting crop yields, and statistical models, which estimate functional relationships between historical observations of weather and yields. Examples of both approaches are increasingly found in the scientific literature, although often published in different disciplinary journals. Here we compare published sensitivities to changes in temperature, precipitation, carbon dioxide (CO2), and ozone from each approach for the subset of crops, locations, and climate scenarios for which both have been applied. Despite a common perception that statistical models are more pessimistic, we find no systematic differences between the predicted sensitivities to warming from process-based and statistical models up to +2 °C, with limited evidence at higher levels of warming. For precipitation, there are many reasons why estimates could be expected to differ, but few estimates exist to develop robust comparisons, and precipitation changes are rarely the dominant factor for predicting impacts given the prominent role of temperature, CO2, and ozone changes. A common difference between process-based and statistical studies is that the former tend to include the effects of CO2 increases that accompany warming, whereas statistical models typically do not. Major needs moving forward include incorporating CO2 effects into statistical studies, improving both approaches’ treatment of ozone, and increasing the use of both methods within the same study. At the same time, those who fund or use crop model projections should understand that in the short-term, both approaches when done well are likely to provide similar estimates of warming impacts, with statistical models generally requiring fewer resources to produce robust estimates, especially when applied to crops beyond the major grains.
Export citation and abstractBibTeXRIS
Attempts to measure the impacts of climate change on agriculture must invariably rely on models that translate changes in climate to changes in agricultural outcomes. This need for models exists even when assessing the impacts of climate trends that have already occurred, since simultaneous changes in other factors that affect agriculture, such as technologies and government policies, preclude direct observations of impacts. Over several decades, many approaches to developing these models have evolved, with most falling into one of two camps.
In one camp are process-based simulation models that attempt to represent the key processes governing crop growth and yield formation. These models (referred to hereafter as ‘process-based’) typically operate with a daily time step and dynamically calculate various crop and soil properties. The history of this approach dates back at least to the early 1960s (De Wit 1965), and although models of this type were typically developed for applications in field-level cropping system decisions (Brisson et al 2003, Jones et al 2003, Keating et al 2003, Stockle et al 2003, van Ittersum et al 2003), they have been increasingly used to evaluate climate change scenarios (Challinor et al 2014). Indeed, one frequently cited concern with using these models for climate change studies is that they were not originally designed for this purpose, and thus may be missing key processes related to extreme climate conditions (White et al 2011, van Oort et al 2011).
On the other hand are models that use observations of weather and crop yields to develop statistical models that functionally relate the former to the latter. These models also have a long history, with early examples by Runge (1968), Thompson (1986, 1975), but have become increasingly common in recent years with the growing availability of data on both weather and crops. These data can be taken from field measurements, farmer surveys, official government statistics, or some combination of these and other sources. As with process-based models, statistical approaches have relative strengths and weaknesses. For example, a common concern relates to the difficulty of distinguishing the effects of highly correlated weather variables, such as temperature and rainfall in many locations (Sheehy et al 2006, Lobell 2007), although the growing amounts of data can enable one to overcome some of these traditional criticisms. In lieu of presenting detailed summaries of the methods themselves, readers are referred to the reviews of (Boote et al 2013, White et al 2011) for process-based models and (Auffhammer and Schlenker 2014, Hsiang 2016, Dell et al 2014) for statistical approaches. Here instead we focus on comparing predictions from the two approaches.
At the outset, it is worth recognizing that the distinction between ‘process-based’ models on the one hand, and statistical (or often called ‘empirical’) methods on the other is an imperfect one. All equations in process-based models include parameters that are derived either from experimental data or by calibration to observations. Likewise, statistical models require summaries of weather data, and these summaries implicitly include some assumptions about processes. For example, statistical models that use average daily maximum temperature over the entire growing season, daily average temperatures for a specific month, or a measure of degree day accumulation each make different assumptions about which processes are most important to capture. Therefore, many process-based models have a high-degree of empirical testing and calibration, whereas many statistical models have predictors and a structure that is informed by process understanding. Nonetheless, the distinction is useful for delineating the degree of reliance on experimental vs. observational data. In addition, the two methods are generally pursued by different communities and published in different journals, with process-based methods popular in agronomy and statistical methods in economics.
A frequent perception encountered by the authors is that statistical methods provide more pessimistic predictions of climate change impacts than process-based methods. This perception may arise from various factors, such that some prominent statistical studies have projected large negative impacts (Schlenker and Roberts 2009) and several authors have emphasized the simplicity or complete lack of treatment of high temperature effects in some prominent process-based models (e.g. White et al 2011, Asseng et al 2011, Lobell et al 2012, Siebert et al 2014). At the same time, there are several plausible reasons that statistical models could give less pessimistic predictions than process-based models. For example, if statistical analyses use noisy data or very rough measures of weather that do not correspond to the key processes, then the estimates will be biased towards zero. Similarly, if statistical models include too many ‘fixed-effects’ to control for possible omitted variables, they will tend to amplify problems of measurement error and also be biased toward zero (Fisher et al 2012).
The goal of the current paper is thus to provide a more systematic comparison of predictions from process-based and statistical models, based on the existing literature. In making this comparison, we view two considerations as particularly critical. First, the variance within each method is likely to be large, and minimizing that variance is important when testing for differences between methods. One approach to doing this would be to average many studies of each type, although that would require a larger literature than typically exists for any particular crop or region. Another approach is to limit the comparisons to studies that represent the ‘best’ of each approach, as the literature on both methods exhibit a wide range of quality. It is not our intention to single out deficient studies, but examples include process-based studies that fail to follow best practices on calibration and testing (as described in White et al 2011), or statistical studies that use erroneous data (Deschênes and Greenstone 2012) or that fail to adequately control for possible omitted variables (Zhang et al 2015).
A second key issue is that the two methods should be addressing an identical or nearly identical question. That is, they should be predicting impacts for the same crop in the same region (ideally for the same spatial scale), and for the same scenario of climate change factors. A common issue is that process-based models frequently incorporate the beneficial effects of higher carbon dioxide (CO2), whereas statistical models rarely do (as discussed more below). Comparisons of impacts from the two methods for climate change scenarios when only one considers CO2 (e.g. Estes et al 2013) may be useful for some questions, but not for assessing how the models differ in their response to climate trends such as warming or drying.
In the following sections, we discuss and compare process-based and statistical methods for specific climate change factors. Quantitative comparisons are presented when possible, mainly for temperature for which the most robust literature for both methods is available. Whereas a few prior studies have compared these methods for specific cases (Irmak et al 2005, Schlenker and Lobell 2010, Maltais-Landry and Lobell 2012, Estes et al 2013, Sheehy et al 2006, Lobell and Ortiz-Monasterio 2007), our emphasis here is on identifying any systematic differences between the methods.
We note that the two methods considered here differ in several aspects beyond their predicted responses to climate change factors, and a focus on predictions should not be perceived as a dismissal of these other aspects. For example, process-based models are typically more amenable to exploration of agronomic or genetic adaptation options, and can enable greater scientific understanding about plant growth and the interactions between crop genetics, management, and climate. These features may be valued as much or more than the ability to provide accurate predictions. The amount of effort required to develop robust predictions can also differ between the approaches, a topic we return to below. The following sections discuss differences between process-based and statistical approaches in terms of responses to temperature, precipitation, CO2, and ozone. We then outline some important differences in terms of effort required, and offer some brief conclusions.
In recent years, the community of process-based modelers has organized and completed several model intercomparison studies, primarily under the auspices of the Agricultural Model Intercomparison and Improvement Project (AgMIP) (Rosenzweig et al 2013). A common insight from these studies is that the median or mean of predictions from multiple models very frequently outperforms any individual model (Asseng et al 2013, 2015, Bassu et al 2014, Li et al 2015, Fleisher et al 2016). This finding reflects a ‘wisdom of the crowds’ often seen in model intercomparisons of other fields such as climate or weather forecasting (Pierce et al 2009, Gleckler et al 2008, Doblas-Reyes et al 2005), which derives from the independence of errors in different individual models.
AgMIP studies also commonly evaluate responses to changes in specific climate change factors, individually and in combination, for specific sites. For this analysis we use the model-median response to uniform increases in temperature as the best representation of process-based models response to warming. Unfortunately, only comparisons for maize, wheat, and rice were possible at the time of writing, given a lack of published estimates for other crops.
For each of the sites where AgMIP estimates are available, we then sought a study that used a statistical model for the same crop and location. The statistical model was evaluated to ensure it followed standard procedures for dealing with omitted variable bias, such as including time trends and/or fixed-effects in the regression model. We also considered only studies that used data spanning both temporal and spatial variation (often referred to as ‘panel’ studies), because statistical models relying only on spatial variation (i.e. cross-sectional studies) are very prone to omitted variable bias, whereas those relying only on temporal variation (i.e. time series studies) are occasionally subject to significant errors in estimates of temperature sensitivity (Sheehy et al 2006, Lobell and Ortiz-Monasterio 2007, Lobell and Burke 2010). These errors can arise from limited temporal variation in temperature compared to other weather variables, as well as strong temporal correlation between temperature and rainfall or radiation.
- a.
MaizeThe recent study of Bassu et al (2014) simulated yields at four sites using 23 different maize models. For three of these sites, independent studies using statistical models have also been published in recent years. The statistical models do not predict yields for the specific location for which the simulations were applied, but instead for a political unit that includes the site. In the case of France and Tanzania, the statistical predictions were only available at the national scale, whereas for Iowa a statistical prediction was obtained for the state level. A comparison of the process-based and statistical models reveals strong agreement between the two approaches, with no more than 1% difference in the inferred temperature response to 1 °C for all three maize cases (figure 1).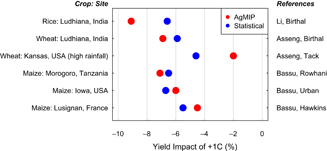
Figure 1. Estimated sensitivity to +1 °C warming for simulation (red) and statistical (blue) methods for selected locations and crops. Comparisons were made for cases that had both a multi-model simulation study and a panel-based statistical model estimate. References refer to sources of estimates for AgMIP (process-based) and statistical models. Li = (Li et al 2015), Asseng = (Asseng et al 2015), Bassu = (Bassu et al 2014), Birthal = (Birthal and Khan 2014), Tack = (Tack et al 2015), Rowhani = (Rowhani et al 2011), Urban = (Urban et al 2015a), Hawkins = (Hawkins et al 2013).
Download figure:
Standard imageHigh-resolution image - b.
WheatAgMIP activities for wheat have a slightly longer history than for other crops, and thus a richer set of studies and sites for which multiple models have been compared. In addition to a detailed study of four sentinel sites similar to maize (Bassu et al 2014) and wheat (Asseng et al 2013), a recent study compared predictions from 30 wheat models at 30 irrigated or high-rainfall sites throughout the world (Asseng et al 2015). The latter study included predictions from one statistical model, based on a panel dataset of spring wheat trials (Gourdji et al 2013). Figure 2 compares the predicted yield impact of +2 °C warming at each wheat site from the statistical model with the median of the 29 process-based models. The predictions are highly correlated (r = 0.73), and the statistical model prediction falls within the distribution of predictions from individual process-based models for all sites. However, the statistical model tended to predict less negative yield impacts than the median process-based model. In this case, it remains unclear whether the statistical or process-based model-median is more accurate. Some of the largest discrepancies were observed for sites with low humidity, which can be explained by the fact that the statistical model contains interactions between temperature and humidity. These interactions are based on evidence from trial data used in Gourdji et al (2013) that less humid sites are less sensitive to warming because of greater evaporative cooling, a process only recently included in some simulation models (Webber et al 2016). However, this does not necessarily mean the statistical model is better, as it may be overly sensitive to humidity given that it was developed with well-irrigated trials.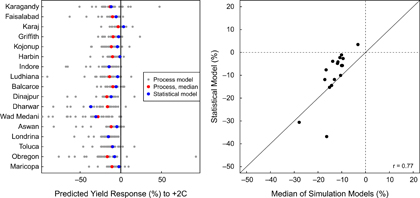
Figure 2. Comparison of estimated yield impacts of +2 °C on wheat yields from 29 simulation models and one statistical model. (a) Estimates for each individual simulation model (gray points), model-median (red point), and statistical model (blue point) for 30 wheat sites modeled in Asseng et al (2015). (b) Scatter plot of estimates from the simulation model-median and the statistical model. In this example, the statistical model was trained on spring wheat trials from CIMMYT’s elite spring wheat nursery, as described in Gourdji et al (2013).
Download figure:
Standard imageHigh-resolution image
Other statistical studies have also been conducted at several of the sites with AgMIP wheat simulations (figure 1). As with maize, the predictions from these models tend to be close to the model-median, although the process-based models predicted significantly less impacts in Kansas. This is not surprising given that the simulations in the Asseng et al (2015) study were done for irrigated or high rainfall conditions, meaning that water stress was not simulated. Although the empirically inferred sensitivities to temperature in Tack et al (2015) are provided for different quartiles of rainfall, and we use the estimates for the 75th percentile of rainfall in figure 1, Kansas is a fairly dry wheat growing region and it is likely that the wheat systems still experience a nontrivial amount of water stress at the 75th percentile of rainfall. Given the important role of water in driving water stress, one would expect the actual response to warming to be higher than seen in simulations without water stress.A recent study reached similar conclusions for wheat impacts at global and regional scales (Liu et al 2016b). Specifically, the authors considered estimated impacts of 1 °C global temperature increase on wheat using both point scale and gridded process-based models, as well as estimates from various statistical studies. In all cases, estimates of aggregated global impacts were between 4.1% and 6.4% yield loss for +1 °C, with a mean effect of 5.7%. For individual countries, estimated impacts from process-based and statistical models were also frequently within 1% of each other for +1 °C. The methods did appear to deviate for larger warming scenarios (i.e. +3 °C), although the point scale process-based models differed more from gridded process-based models than from statistical models, suggesting that the deviations did not result from any systematic difference between process-based and statistical approaches. - c.
RiceSimilar to maize and wheat, an AgMIP study involving multiple models for four sentinel sites was recently published for rice (Li et al 2015). In this case, 13 different models were compared, and the median model again agreed best with experimental data at the four sites. Unfortunately, only a few empirical studies that have used a panel dataset have been published for rice, and some of these do not report sensitivities per degree of warming (Welch et al 2010, Auffhammer et al 2012). Figure 1 compares a panel-based estimate for India with the AgMIP results in Ludhiana. Although there is a significant scale discrepancy between an estimate for all of India and simulations for a single site, the two estimates are fairly similar, with 6.6% for the statistical model vs. 9.1% for the process-based model-median.
The comparison summarized in figure 1 focuses on the impacts at low levels of warming. In most locations impacts are fairly linear with temperature up to roughly 3 °C of local warming (Rosenzweig et al 2014, Porter et al 2014). However, at higher levels of warming the impacts likely become more nonlinear, with each additional degree causing more yield loss in process-based models (Li et al 2015, Rosenzweig et al 2014) as well as many statistical models (e.g. Schlenker and Roberts 2009). For example, Li et al (2015) report an average process-model yield loss of 5.3% per °C for rice yield for 0–3 °C warming (at ambient CO2), which increases to 8.3 % per °C for 3–6 °C of warming. In a statistical study of U.S. yields, Schlenker and Roberts (2009) report an average 8.2% per °C loss for maize and 5.7% for soybean up to 3 °C, which increases to an average of 10.4% per °C loss for maize and 10.6% for soybean between 3–6 °C of warming.
Given the fewer number of estimates for either method for high levels of warming, it is difficult to assess whether the general agreement between the methods for near-term warming would translate to warming of 3 °C or more. In general, one would expect certain processes that are not included in process-based models to become more important under extreme warming scenarios, which could lead to process-based models becoming less pessimistic than statistical models. For example, processes that accelerate senescence in wheat appear important above 34 °C but are not included in many models (Asseng et al 2001, Liu et al 2016a, 2016c), and discrepancies between process-based models and observed senescence are largest under late sowing conditions which exacerbate heat exposure (Lobell et al 2012, Asseng et al 2015, Ottman et al 2012).
AgMIP studies have generally not published systematic sensitivity tests of process-based model responses to rainfall changes, unlike the case with temperature. A focus on temperature can be justified by the fact that warming is expected to be the more important driver of both expected impacts from climate trends and the associated uncertainties, especially at regional to global scales (Lobell and Burke 2008). Nonetheless, the impacts of rainfall trends may be important in some locations and time scales.
Although the lack of studies on rainfall precludes the type of comparisons presented for temperature, it is worth noting that many statistical studies have found a surprisingly small sensitivity to rainfall. For example, a widely cited panel analysis of U.S. corn yields (Schlenker and Roberts 2009) estimated a fairly small effect of changing growing season rainfall, with a 50% reduction in rainfall resulting in a predicted yield loss of just 10%. This is substantially less than the sensitivities shown for individual process-based models in the same region (Brown and Rosenberg 1997). A comparison of the DSSAT models with statistical models based on time-series analysis for wheat and maize at several U.S. sites also found much higher sensitivity to rainfall in the process-based models (Maltais-Landry and Lobell 2012).
In our experience, at least five reasons can be considered to contribute to discrepancies between rainfall sensitivities for process-based and statistical models, and in particular lower sensitivity for the latter. First, simulation experiments are usually carried out for a specific soil, whereas statistical models are derived from yields measured across a mix of soils. Soil characteristics (Asseng et al 2001), initial soil water conditions (Moeller et al 2009) and in particularly soil rooting depth (Wong and Asseng 2007) can have large impacts on crop yield and on the response of yield to rainfall. In some environments, the ranking of a soil for grain yield can reverse depending on rainfall (Wong and Asseng 2006, Kaspar et al 2003). Thus, one would expect that the sensitivity to rainfall would diminish as one aggregates across soils with differential responses to rainfall. For example, for wheat yields in Western Australia, reported yields varied from 0.9 to 2.3 t/ha during a 10 year period at the state level, which aggregates across a mixture of soils. For the same period, grain yields for individual farms with predominant sandy soils varied across a wider range of 0.2 to 3.0 t/ha (Asseng et al 2012). Although it is unlikely that soil differences alone explain the reduction in variance at broader aggregates, it is likely an important component. Similarly, studies that have examined sensitivity of simulated yields to rainfall changes have reported reduced sensitivity when aggregating across multiple soil types (Lobell and Burke 2010).
A second possibility is that some process-based models tend to overstate the importance of rainfall even at the site level, because simulated soil water depletion is too fast (Eitzinger et al 2004). However, other studies have found simulated water depletion in line with observations (Asseng et al 1998, Probert et al 1998, Probert et al 1995, van der Velde et al 2011).
A third, related factor is that crop models ignore factors that can be important for crop growth in some environments or seasons. These factors include crop damage from waterlogging, lodging, freeze events, and pest and diseases, all of which potentially prevent high yields in otherwise favorable conditions. Thus, process-based models may overstate the benefits of wet years, and thus the sensitivity to drying, whereas statistical models should implicitly include any of these yield dampening factors that would reduce the rainfall signal. Although this issue would also pertain to temperature sensitivity in many cases, it may be that excess moisture is particularly important in some regions (Urban et al 2015b, van der Velde et al 2011).
A fourth potential factor is that statistical models may understate rainfall’s importance because of measurement error, in that rainfall tends to be more spatially heterogeneous than temperature and thus harder to measure accurately across large regions. A study that attempted to characterize the potential magnitude of measurement error in rainfall and its implications for statistical models concluded that this factor could cause statistical models to underestimate the importance of rainfall by a factor of two or more in some regions (Lobell 2013). However, measurement errors in regions such as the United States are not likely to be large, so this factor alone is unlikely to explain some of the discrepancies noted above.
Fifth, process-based and statistical modeling approaches tend to make different assumptions about how other weather variables change when simulating impacts of total growing season precipitation. For example, sensitivity tests with process-based models tend to use a multiplier for precipitation amounts on each day, such that the number of rainy days is preserved, and they also do not change other factors such as radiation or temperatures. Statistical models, on the other hand, often do not include explicit treatment of several factors that are correlated with total rainfall, such as rainy day frequency or radiation. When these models are then used to predict the impacts of changes in total rainfall, they will implicitly assume that the historical correlation between rainfall and the omitted variables are preserved (since this correlation is implicitly included in the estimated effect of rainfall). For example, whereas a simulation study typically assumes radiation is unchanged, a statistical model would implicitly assume a reduction in radiation with increased rainfall.
Disentangling these various causes of discrepancy between process-based and statistical models will require more study. One potential approach is to develop statistical models that include measures that more explicitly capture within-season rainfall dynamics (Rowhani et al 2011, Fishman 2016), so that these aspects can be explicitly held constant or changed as desired. Another approach is to compare process-based models to statistical models trained on their output (i.e. emulators). This removes any concern about scale mismatches (the first factor discussed above), model errors (the second and third) or measurement error (the fourth), since the statistical model is trained on the inputs and outputs of the process-based model.
As an example of this approach, figure 3 shows the output of process-based models for three different sites based on prior work for wheat and maize, with simulated yields plotted against the in-season rainfall for the weather data used as input for the simulations. The rainfall response for a statistical model fit to the simulation data is shown for comparison. Note that because the statistical model also includes non-rainfall predictors such as temperature, the curve does not represent a fit to only the data shown in the plot. In particular, for the maize examples, the inferred sensitivity to precipitation is slightly less than what would be estimated if using only rainfall as a predictor. The rightmost panel in figure 3 then compares the predicted yield responses to a 20% decline in precipitation (holding other variables fixed at their historical values), using both the statistical model and the process-based model. In all cases, the distribution of predictions from the statistical model, obtained by bootstrap resampling of the simulation years, is shown in blue along with the mean estimate. The ‘true’ response of mean yield to rainfall change from the process-based model, shown in red, is within the distribution of statistical estimates for all cases, but less negative than the mean estimate for the wheat example and more negative for the maize examples. These examples illustrate that even without issues of scale mismatches or errors in process-based models or measurements, it is possible to have nearly a factor of two difference between predictions from process-based models and those from statistical models based on total seasonal rainfall. However, it does not appear that using total seasonal rainfall in statistical models always leads one to underestimate the true importance of rainfall, as the direction of bias depends on the relationship of total rainfall to other aspects of weather.
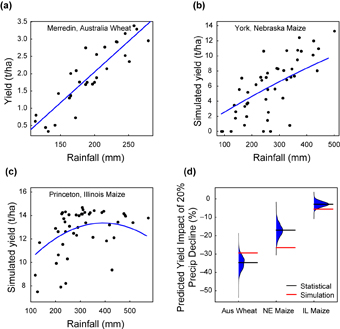
Figure 3. (a–c) Simulated yields for one wheat and two maize sites using the APSIM crop model, plotted against in-season rainfall for each year. Blue line shows sensitivity to rainfall inferred by statistical model fit to the data using linear and quadratic rainfall terms. (d) Simulated effect of a 20% reduction in rainfall for mean yields at each site (red line), along with the predicted impact based on the statistical models (blue distribution). Black line shows mean prediction from the statistical model based on 1000 bootstrap samples of the historical simulations. APSIM simulations were taken from previous work for wheat (Asseng et al 2001) and maize (Lobell et al 2013).
Download figure:
Standard imageHigh-resolution image
Perhaps the most important difference between process-based and statistical approaches is that the latter rarely include the effects of changes in CO2. Statistical estimation of CO2 effects is much harder than for weather variables because, unlike temperature or rainfall, CO2 does not exhibit strong gradients over space or time that can be exploited for statistical estimation. Instead, CO2 is fairly uniform across space and varies gradually over time. Given the large differences in technology uptake over time, or soils and other factors over space, it becomes extremely difficult to identify the signature of CO2 in statistical analyses. Attempts have been made to exploit anomalies in the year-to-year growth rates of CO2 and yields (Lobell and Field 2008), but the precision of these estimates were too low to allow meaningful comparisons with process-based model responses. Another approach has been to incorporate into statistical studies observations from experiments with CO2 enrichment, and then simultaneously estimate a technology and CO2 effect (Attavanich and McCarl 2014). However, this approach is not truly independent of process-based models, which are calibrated to these experiments.
Another challenge in statistically quantifying CO2 effects on crop yields is that the growth-stimulation might be heterogeneous. The elevated CO2 impact is accelerated under water deficit conditions (Kimball et al 2001, Wall et al 2006), but this effect could vary within a season and among soils. Also, the CO2 growth-stimulation could be negligible when nutrients (Hungate et al 2003, Kimball et al 2001, Ziska and Bunce 2007) or intense drought (Gray et al 2016) are growth limiting. Increasing atmospheric CO2 might also increase high temperature stress of crops due to stomatal closure and increasing canopy temperatures (Batts et al 1997). While CO2 and water and nitrogen interactions are captured in some process-based models (O'Leary et al 2015), interactions of canopy temperature in models (Webber et al 2016) and atmospheric CO2 are not considered yet.
Rather than attempting to estimate the total effect of elevated CO2, one study attempted to isolate the effect of CO2 on water-use efficiency by comparing yields over time in wet vs. dry conditions (McGrath and Lobell 2011). While promising, this approach required assumptions about changes in genetic and management factors that occurred simultaneous with CO2 increases and also affected the yield differential between wet and dry conditions, for which only a few experimental estimates are available. Notwithstanding these examples, the vast majority of statistical studies simply ignore CO2 effects, and thus predictions made with these models focus on the impacts of changes in other global change factors.
Moving forward, there are several opportunities to better incorporate CO2 into predictions from statistical models. One would be to identify novel approaches to estimating effects of CO2 in the statistical models themselves. As mentioned, this is extremely difficult given the strong correlation of CO2 with other slowly varying factors. A second option is to simply take predictions from statistical models and then add estimates of CO2 impacts based on other models. This was the approach taken in the recent Risky Business study of impacts in the United States (Houser et al 2015), which utilized estimates of CO2 impacts on yields for different crops and regions (McGrath and Lobell 2013).
A third approach is to explicitly modify predictors in statistical models, based on process understanding of how CO2 interacts with other factors that affect crop growth and yield. For example, Urban et al (2015a) developed a statistical model for maize in the United States that included a term for vapor pressure demand (VPD), which varies with temperature and humidity and is a strong predictor of yields in the region (Roberts et al 2012, Lobell et al 2014). The authors allow VPD to interact with rainfall, and use this statistical model to project impacts of future VPD changes, allowing CO2 increases to reduce the effective increase in VPD based on the equations used in the APSIM process-based model which relate transpiration efficiency to VPD and CO2. This represents a parsimonious approach to account for interactions between CO2 and weather. The projected impacts demonstrated the importance of CO2 changes in the region, even for a C4 crop such as maize (figure 4).
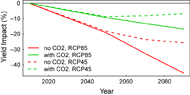
Figure 4. Predicted yield impacts of climate change for U.S. rainfed maize based on a statistical model that includes a simplified treatment of CO2 effects on crop water demand (Urban et al 2015a). Impacts excluding CO2 effects are also shown, and are substantially more negative, in line with previous statistical estimates for this region (Schlenker and Roberts 2009). Despite being a C4 crop, maize is affected by higher CO2 because of the frequent occurrence of crop water stress in the region, and the effects of CO2 on plant transpiration efficiency. Impacts are shown relative to a baseline of 2010. RCP85 refers to a high emission scenario, and RCP45 to a lower emission scenario.
Download figure:
Standard imageHigh-resolution image
Ozone (O3) is formed in the atmosphere when sunlight causes complex photochemical reactions involving oxides of nitrogen (NOx), volatile organic hydrocarbons, and carbon monoxide that originate from burning of fossil fuels. Near surface ozone (referred to as just ‘ozone’ hereafter) is a major atmospheric pollutant, which enters leaves through stomata during normal gas exchange and causes leaf chlorosis and necrosis.
Experiments have demonstrated that O3 concentrations above roughly 40 ppb lead to reduced assimilation rates, leaf conductance and consequently growth and yield (Ewert and Porter 2000, Heck et al 1983). Several authors have combined estimates of O3 impacts on yields from experiments with global chemical transport models to estimate current damage from O3 around the world (Van Dingenen et al 2009, Avnery et al 2011). These studies have estimated global aggregate impacts of ~10% for wheat and soybean, and ~5% for maize and rice. Tai et al (2014) use a similar approach to evaluate alternative future emission scenarios, finding large potential impacts of O3 on future production depending on emission scenarios.
Thus, the effects of O3 on crop production are increasingly viewed as comparable to weather and CO2, and thus deserving of more explicit consideration in modeling efforts and policy decisions. However, unlike for CO2, the effects of O3 are not included in most process-based model studies. There are a few attempts in the literature (Ewert et al 1999, Ewert and Porter 2000) and more work is ongoing, but these effects have not yet been applied at a global scale.
Most statistical studies also do not explicitly model the effects of O3, given a lack of good data on O3. However, some recent work has exploited new datasets on variation in O3 concentrations or precursors to O3 formation. Burney and Ramanathan (2014) used emissions inventories in India to estimate the net effect of short-lived climate pollutants, namely O3 and black carbon. They estimate losses of roughly 30% and 20% for wheat and rice, respectively, but with fairly large uncertainties. McGrath et al (2015) included data on U.S. rural O3 concentrations in maize and soybean statistical models, estimating roughly 10% and 6% losses for the two crops, respectively.
Given the fairly low precision in statistical estimates, and the lack of treatment of O3 in most process-based models, meaningful comparisons of the two approaches are not yet possible. However, this remains an important area for future work, arguably as or more important than factors such as rainfall whose trends do not appear to have as large of a potential impact on aggregate crop production as O3.
To consumers of yield impact estimates, such as integrated assessment modelers, the time and resources required to develop robust estimates can be as important as accuracy, particularly if results from process-based and statistical approaches are likely to be very similar in accuracy, at least for some factors. It is worth emphasizing, therefore, that the costs of producing such estimates can be very different for the two approaches, and vary with crop. For the four major grains (wheat, maize, rice, and soybean), multiple process-based models have been developed and international networks of researchers participating in model intercomparisons have already been established, so that the marginal cost of deriving new estimates for one of these crops from a process-based approach is relatively small. Yet consumers of yield impact estimates often require values for the full suite of crops relevant to economic activity and human nutrition. The typical approach is to either assume that a crop responds the same as one of the four grains, or that the impacts on a crop can be safely assumed to be zero. For example, when defining productivity shocks for an economic analysis of climate change impacts, Hertel et al (2010) assumed that cotton impacts were identical to rice, and that sugarcane impacts were zero. Nelson et al (2014) provide a more exhaustive description of crop assumptions for their analysis of economic impacts, a subset of which are illustrated in table 1. Some choices are clearly arbitrary, such as that the impact of cassava should be equal to the mean of wheat, rice, maize, and groundnuts, or that sugarcane should be treated the same as maize.
Table 1. Mapping of yield impacts for selected crops in the study of Nelson et al (2014). Left column shows the crop impact estimate needed for the economic model, and right columns show how that estimate was obtained for three different crop models using estimates for other crops.
| Impact | DSSAT | EPIC | LPJmL |
|---|---|---|---|
| Millet | Maizea | Sorghum | Millet |
| Palm kernels | b | Sunflower | Sunflower |
| Rapeseed | b | Rapeseed | Rapeseed |
| Sunflower | b | Sunflower | Sunflower |
| Cassava | b | Cassava | Cassava |
| Chickpeas | Groundnuts | Groundnuts | Groundnuts |
| Cotton | b | b | b |
| Potatoes | b | b | b |
| Sugar beet | b | b | Sugar beet |
| Sugar cane | Maize | Sugar cane | Sugar cane |
| Sweet potatoes | b | b | b |
| Temperate fruit | b | b | b |
| Vegetables | b | b | b |
aOnly one-half of negative impacts are applied, to represent improved drought tolerance. bAverage of rice, wheat, soybeans, and groundnuts.
One remedy for this gap between producers and consumers of yield impacts would be to invest in the development of process-based models for each crop, and indeed most crops have at least one functioning process-based model. However, as emphasized above and elsewhere (Asseng et al 2013, Palosuo et al 2011, Li et al 2015), obtaining the most accurate results with process-based approaches generally involves running not one but three or more independent models.
In contrast, statistical approaches require less effort, provided that sufficient quality and quantity of data exist to develop robust statistical relationships. In most major agricultural countries or regions (i.e. India, China, United States, European Union, Argentina, Brazil), public datasets on aggregate production and yield for district or county administrative units are available online, and cover most economically important crops in the region. For many African and Asian countries, subnational data on dozens of agricultural outcomes are increasingly available (www.countrystat.org/). The quality of these data are still unknown, but even noisy data can be successfully used in statistical studies if sample size is big enough and the errors are uncorrelated with weather.
It is difficult to precisely measure the costs of obtaining robust estimates. One line of evidence is that AgMIP papers for a single crop often have 30 or more authors (e.g. Asseng et al 2013) whereas statistical studies are often done for multiple countries and crops, including minor crops such as cassava, millet, and groundnuts, with only one or two authors (e.g. Schlenker and Lobell 2010). Despite the lack of good measures, though, it is likely in most situations that the costs of process-based approaches are considerably higher than statistical approaches.
There are many good reasons to continue investing in process-based approaches, and our intention here is not to flag them as too costly. For example, the additional systems understanding from building simulation models and their suitability for exploring climate change adaptation options might be worthwhile, and superior to statistical approaches. However, in our experience users of yield estimates are not aware of how much more work is involved to obtain robust estimates with process-based models, particularly for crops beyond the main grains. For decisions in the next few years that need information on climate change impacts for crops such as sugarcane, rapeseed, cassava, or oranges, statistical models are likely to produce the needed estimates much sooner and at much lower levels of investment.
In the long term, we expect that the distinction between process-based and statistical models will dissolve, as simulation modelers strive to make better use of observational data and statistical modelers incorporate more predictors that represent process understanding reflected in process-based models. Increased use of Bayesian approaches in process-based models (Iizumi et al 2009), efforts by simulation modelers to incorporate or improve processes that appear important in statistical studies (Lobell et al 2015, Boote et al 2013), and incorporation of sub-seasonal temperature and rainfall measures in statistical models (Fishman 2016, Rowhani et al 2011) are among the examples of the field moving in this direction. Moreover, the move toward model ensembles can readily accommodate models of both types, with the resulting model-mean or model-median reflecting aspects from each approach (Liu et al 2016b).
These developments are welcome, but do not reduce the short term need to assess and reconcile any differences between published results for the methods for the various users of predicted yield changes. Toward that end, we think four conclusions from the current study are particularly worth emphasizing:
- There are no apparent systematic differences between the predicted sensitivities to temperature change from process-based and statistical models for low levels of warming (figures 1 and 2). Currently, differences can only be evaluated for low levels of warming (<2°C) given the lack of projections from both methods for similar locations and crops for larger temperature increases. More work is needed to compare responses to larger warming scenarios, as well as for interactions between temperature and other variables.
- For precipitation, fewer estimates are available to compare, and thus whether systematic differences exist is unknown at this time. We discuss five reasons that estimates could be expected to differ, but also note that changes in precipitation are rarely the dominant factor for predicting impacts given the prominent role of temperature, CO2, and O3 changes.
- Predicted impacts from the two methods often differ because process-based models tend to include the effects of CO2 increases that accompany warming, whereas statistical models typically do not. Whether the impacts of warming alone or warming plus CO2 is of most interest will depend on the user. For users who desire the net impacts of both warming plus CO2, process-based models would be an appropriate tool, but we also offer several suggestions for incorporating the effects of CO2 into statistical models.
- Many opportunities exist to combine process-based and statistical models in climate change impact research, for instance by using insights from statistical studies to guide process-model development, using process-based models to identify useful predictors for statistical models, using CO2 responses from process-based models to complement climate impact estimates from statistical models, and enhancing confidence in impact estimates through multi-method (i.e. process-based and statistical) applications.
We thank Jim Jones and two anonymous reviewers for helpful comments.