Measuring the sustainable development implications of climate change mitigation (original) (raw)
1748-9326/15/8/085004
Abstract
Synergies and trade-offs exist between climate mitigation actions and target indicators of the Sustainable Development Goals (SDGs). Some studies have assessed such relationships, but the degree of such interaction remains poorly understood. Here, we show the SDG implications associated with CO2 emissions reductions. We developed ‘marginal SDG-emissions-reduction values (MSVs)’, which represent the marginal impacts on SDG indicators caused by a unit CO2 emissions reduction. This metric is applicable to national assessments and was applied to Asia. We found clear relationships between CO2 emissions reduction rates and many SDG targets. For instance, 1% reduction of CO2 can avoid 0.57% of air pollution-related premature deaths (SDG3), whereas the mean species richness (SDG15) is decreased by 0.026% with the same reduction (not including climate change impacts). Our findings are useful for assessing the SDG implications associated with CO2 emissions reduction targets, which will help inform national climate policies.
Export citation and abstractBibTeXRIS
The Paris Agreement [1] includes the following long-term temperature goal for international climate policy: ‘holding the increase in the global average temperature to well below 2 °C above pre-industrial levels and pursuing efforts to limit the temperature increase to 1.5 °C above pre-industrial levels’. The climate change mitigation strategy of reducing greenhouse gas (GHG) emissions may have various effects on multiple sectors. These effects are critically important to the implementation of climate change mitigation actions and other societal goals. Some studies have addressed the side effects of climate change mitigation actions on Sustainable Development Goals (SDGs) [2–5] and recent Intergovernmental Panel on Climate Change (IPCC) reports on reaching 1.5 °C warming summarise the relevant literature to date [6]. This research has revealed both trade-offs and synergies between sustainable development and climate change mitigation. Some researchers have proposed scenarios implementing additional societal changes to the so-called baseline scenario (e.g. shifting to less meat consumption and lifestyle changes that reduce energy demand) to attain multi-dimensional benefits from climate change mitigation. However, despite the existing literature on these topics, little is currently known about the relationships between climate change mitigation strategies and various sustainable development goals. Previous studies have described specific scenario outcomes that are limited to 1.5 °C or 2 °C temperature increase, viewed at the global scale. Further information, such as the responses of SDG target indicators to CO2 emissions reductions, would be useful for framing sustainable development policies at the national scale.
Here, we show the SDG implications associated with CO2 emissions reduction. To this end, we developed marginal SDG-emissions-reduction values (MSVs), representing the marginal impact on SDG indicators caused by a unit of CO2 emission reduction, which is generally applicable to national assessments. We determined these values for Asia as an example application in this study. Asia is predicted to be one of the most important regions over the next few decades in terms of population size, economy, and GHG emissions [7]. For example, emissions have continuously increased in the recent past, growing by 330% over the last four decades and reaching 19 GtCO2eq yr−1, approximately equivalent to 40% of global emissions, in 2010 [8]. Future scenario analysis was carried out and the scenario data were then processed to develop MSVs for five scenarios with varying degrees of climate mitigation stringency. One is referred to as the baseline scenario, which does not include climate change mitigation policy represented by carbon pricing. The other scenarios reduce GHG emissions by varying the stringency of mitigation actions, with global mean temperature changes at the end of the century of 1.5 °C, well below 2 °C, 2 °C and 2.5 °C compared with preindustrial levels (hereafter referred to as the 1.5 C, WB2 C, 2 C, and 2.5 C scenarios, respectively)[9]. These scenarios allow the implications of the Paris Agreement long-term goals to be explored. We used the AIM (Asia-Pacific Integrated Model) modelling framework coupled with other modelling tools to quantify multiple indicators associated with the SDGs listed in table 1, which is based on the SDG target list and current modelling capabilities (for more details, see the Methods, supplementary note1 and figure S1 (available online at stacks.iop.org/ERL/15/085004/mmedia)).
Table 1. Indicators associated with SDGs and the primary models used to quantify each indicator.
| SDGs | Field | Indicators (SDG targets) | Unit | Model |
|---|---|---|---|---|
| SDG2 | Hunger | Population at risk of hunger (2.1) | Person | AIM/Hub + Hunger tool |
| Agricultural price (2.c) | No unit | AIM/Hub | ||
| SDG3 | Health | Air pollution mortality (3.9.1) | Person | AIM/Hub + GEOS-Chem + Health assessment tool |
| SDG6 | Water | Population under water scarcity (6.4.2) | Person | AIM/Hub + Water assessment tool |
| SDG7 | Energy | Share of renewable energy (in primary energy) (7.2.1) | Ratio | AIM/Hub |
| Energy intensity (7.3.1) | GJ/$ | AIM/Hub | ||
| SDG8 | Labour | GDP per capita (8.1.1) Unemployment rate (8.5.2) | 2005US$/cap % | AIM/Hub |
| SDG9 | Economy | Secondary industry share (9.2.1) | Ratio | AIM/Hub AIM/Hub |
| SDG12 | Consumption | Food waste (12.3.1) | Mt/year | AIM/Hub |
| SDG15 | Life on land | Forest area (15.1.1) Mean species richness (15.5: Biodiversity index) | Area Species per grid cell | AIM/Hub AIM/Hub + AIM/PLUM + AIM/Biodiversity |
As noted in the above, we used the AIM (Asia-Pacific Integrated Model) modelling framework coupled with other modelling tools for scenario quantification, allowing assessment of the effects of climate change mitigation as well as other societal and environmental changes on the attainment of SDGs. To quantify the indices, we incorporated an economic (general equilibrium; AIM/Hub) [10, 11] model, gridded land use allocation model [12], biodiversity model [13], water scarcity assessment tool, emissions downscaling tool [11], hunger estimation tool [14], simplified climate model [15], air transport & chemistry model (GEOS-Chem) [16] and health assessment tool [16]. The details of each model are provided in the Supporting Information and here we briefly summarize each model as table 2 and what information is exchanged between models as table 3.
Table 2. Model summary.
| Model name | General model/tool type | Spatial resolution | Main outputs | Main inputs |
|---|---|---|---|---|
| AIM/BIO | Statistical habitat mdoel | Global 0.5 × 0.5 | Potential habitat of each species | Land use and climate information |
| AIM/Hub | Economic model | Global 17 regions | Economy, energy, land-use, emissions, food, and water demand | GDP, population and future technological changes |
| AIM/PLUM | Land use allication model | Global 0.5 × 0.5 | Land-use category and biomass supply | Aggregated land-use, and land-use related economic indicators |
| GEOS-Chem | Atmospheric Cheminal Transport model | Global 2.0 × 2.5 | Air pollutant concentrations | Meteological information and emissions |
| Health tool | Simple process model | Global 0.5 × 0.5 | Air pollution mortality | Air pollutant concentrations |
| Hunger tool | Simple process model | Global 106 countries and regions | Food distribution and population at risk of hunger | Food consumption and GDP/cap |
| Water assessment tool | Simple comparison | Global 0.5 × 0.5 | Population uder water scarcity | Water demand and climate information |
Table 3. Main exchanged information among models.
| Provider | Receiver | Information |
|---|---|---|
| AIM/Hub | Water assessment tool | Regionally aggregated water demand by sectors |
| AIM/Hub | GEOS-Chem | Spatially downscaled air pollutant emissions |
| GEOS-Chem | Health tool | Spatially explicit PM2.5 and Ozone concentrations |
| AIM/Hub | AIM/PLUM | Regionally aggregated land use Prices of carbon, agricultural commodities, labor and capital |
| AIM/PLUM | AIM/BIO | Spatially explicit land use |
| AIM/Hub | Hunger tool | Regionally aggregated food consumption |
In all climate change mitigation scenarios, carbon pricing starts from the year 2020 with a global universal carbon price. As in previous modelling exercises, we cap the carbon price on the agricultural sector at $100/tCO2 so that most emissions abatement can occur but excessive negative side effects can be avoided [14]. The global mean temperature outcomes from model assessment are shown in figure S12, which shows temperature increases in 2100 compared with the pre-industrial level of around 1.5, 1.7, 2.0 and 2.5 °C at the end of the century, while the baseline scenario increases by over 3.5 °C. SSP2 (Shared Socioeconomic Pathways [17]) was utilised for the background socioeconomic assumptions. For the near-term, we utilised the most recent energy information available and, consequently, the model results mostly follow the IEA Energy Balance Table until 2015. For the period 2020–2030, the climate policy assumption is stronger than the NDC as a result of global emissions constraints.
This study excludes climate change impact (e.g. on agricultural yield, water resources, or biodiversity) to isolate the effects of climate change mitigation, although climate change may have multi-sector impacts, which will be explored in future research. Further details of each model are shown in the supplementary note 1.
3.1. Asian mitigation pathways
We first explore the main features of the climate change mitigation scenarios. Aligning the emissions pathways to stabilise climate well below 2 °C, the CO2 emissions in Asia become, in 2050, about half of the current level, reaching zero around 2080 and negative values in 2100. In contrast, the baseline scenario projects continuous increases until the 2030 s, followed by a stagnant period (figure 1(a)). Attaining 1.5 °C increase and then stabilisation requires a rapid reduction and strongly negative emissions in the former and latter halves of this century, respectively. The carbon price will reach about $800/tCO2 in 2100 in the WB2 C scenario (figure 1(b)), while the other scenarios are widely spread. A small kink around 2035 in the WB2 C scenario is caused by the emissions trajectory generated by the optimisation model, which is based on the Dynamic Integrated Model of Climate and the Economy (DICE; figure 1(a)). The primary energy supply of the baseline scenario increases from 150 EJ in 2010 to 350 EJ in 2100, whereas the increase is constrained in the mitigation scenarios, with about 230 EJ in 2100 under WB2 C. The energy mix shows that more than half comes from renewable energy and the remainder from fossil fuels using carbon capture and storage (CCS) in the latter half of the century (figure 1(c)). Overall, land use is similar between the baseline and mitigation scenarios, whereas the forest area increases from 530 Mha to 730 Mha in the WB2 C scenario due to afforestation (figure 1(d)). Generally, as the emissions reduction becomes stronger, the degree of change in carbon price, energy, and land use becomes more severe. The global pattern is rather similar to that in Asia, although the absolute scale of the emissions, energy supply and land use areas differ (figure S2).
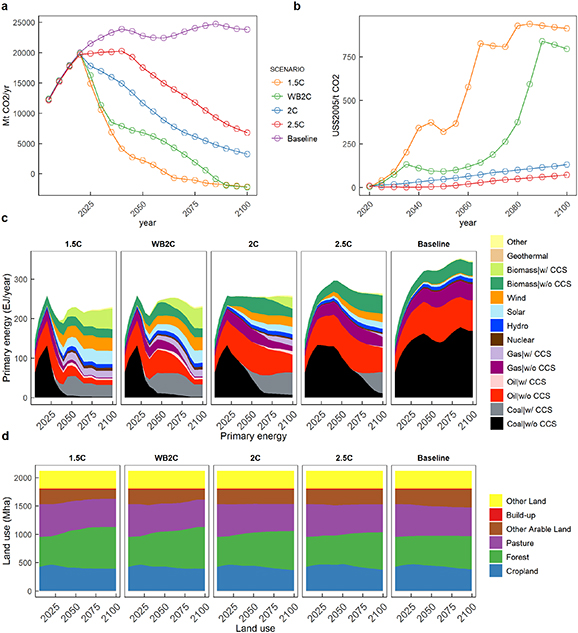
Figure 1. Mitigation pathways and general features of scenarios in Asia. The panels show results for (a) CO2 emissions, (b) carbon price, (c) primary energy supply, and (d) land use.
Download figure:
Standard imageHigh-resolution image
3.2. SDG implications of the Asian climate change mitigation
Figure 2 illustrates individual SDG indicators that indicate the multi-sectoral implications of climate change mitigation in Asia. The SDG impacts are closely linked to the stringency of climate change mitigation (figure 1). Six indicators, including number of deaths caused by air pollution (SDG3), air pollution mortality (number of people under water stress) (SDG6), share of renewable energy (in primary energy) and energy intensity (SDG7), unemployment rate (SDG8), food waste (SDG12), and forest area (SDG15) show co-beneficial relationships with climate change mitigation. The most remarkable sector is health, which shows a 30% reduction in air pollution-related mortality (SDG3) due to climate change mitigation. The share of renewable energy (SDG7) also shows significant improvement. Three indicators show trade-off relationships with climate change mitigation: population at risk of hunger (SDG2), secondary industry share (measured by manufacturing value added as a proportion of GDP; SDG9), and biodiversity index (SDG15). Risk of hunger (SDG2) has been shown in previous studies (e.g. Fujimori et al and Hasegawa et al [14, 18–20] and we confirmed a similar trend. GDP per capita (SDG8) shows small adverse effects that are limited and may be negligible considering other drivers such as socioeconomic assumptions or climate change impact. We discuss more details of these individual indicators below by mainly contrasting baseline and WB2 C scenarios.
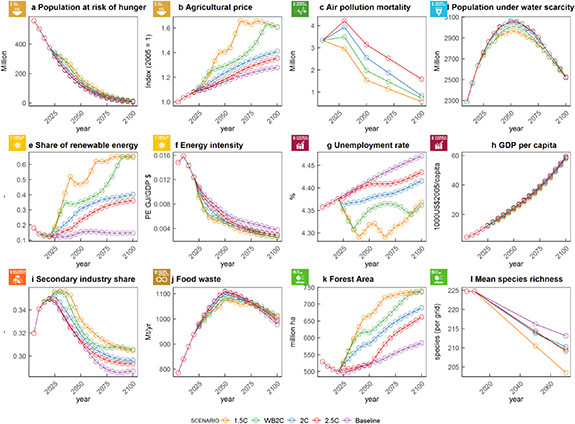
Figure 2. Multi-dimensional SDG impacts of climate change mitigation in Asia. Purple line represent the baseline and red, blue, green and orange do mitigation scenarios (2.5 C, 2 C, WB2, and 1.5 C), respectively.
Download figure:
Standard imageHigh-resolution image
Population at risk of hunger continuously decreases over this century from, 500 million in 2010 to 7.4 million in 2100 in the baseline scenario, mainly driven by steady income growth. Climate change mitigation based on a simple carbon tax policy could have negative impacts on the risk of hunger, which is a consequence of increased food price (figure 2(b)). This can be seen in most mitigation scenarios. These adverse side effects can be avoided through supplementary policies designed to eradicate them using relatively little in the way of financial resources or distribution changes [14, 21].
Mortality related to ambient air pollution, associated with air pollutants, would increase in the short term, increasing from 3.3 to 4.2 million between 2010 and 2030, but decreases in the long term even in the baseline scenario (figure 2(c)). Recent studies [22] show that sulphur emissions in China have decreased, which is not fully reflected in this study and, thus, the short-term trend may differ if we implement the latest data, but the general mid- to long-term trends would not be. The climate change mitigation co-benefits are greatest in this area, in accordance with previous studies in Asia [16] and worldwide [23]. For example, around 1.5 million premature deaths could be avoided annually by mid-century under the WB2 C scenario.
Population under water scarcity shows a modest increase in the first part of this century and then declines, showing almost identical trends in both scenarios (figure 2(d)). In the mitigation scenario, water demand may decrease or increase due to the phase out of fossil fuel fired power plants (reducing cooling water demand) [24] and large-scale expansion of energy crop production [25], and the final outcome differs little from the baseline, as shown in figure 2(d). The agricultural demand for food decreases slightly as a consequence of carbon pricing on non-CO2 emissions and associated GDP losses [18], which contribute to decreases the water demand in the irrigation.
Energy is the sector most closely linked with climate change mitigation, and it shows strong synergy with the renewable share of primary energy supply. This share begins at 20% in 2010 and reaches 60% in 2100 in the WB2 C scenario, while it remains stable during this century in the baseline scenario (figure 2(e)). Energy intensity decreases continuously throughout this century in all scenarios, mainly due to the continuous improvement of energy-saving technology and industrial structural changes wherein energy usage is gradually shifting from secondary to tertiary industries (figure 2(i)).
Among economic indicators, we found that the employment rate is almost constant over this century in both scenarios, with the baseline scenario trend depending mostly on the prescribed assumptions and showing little response to climate mitigation because the wage rate is hardly affected by the mitigation process (carbon price implementation) (figure 2(g)). The regionally aggregated baseline reflects the regional share and initial conditions. The employment would be benefit from the recycling the tax to the labour market under the modest carbon prices because we assume that the carbon tax revenue is recycled to the labor market as described in supplementary information, but further expensive carbon tax may adversely affect. GDP in 2100 reaches about 8-fold that in 2010 in the baseline scenario. The mitigation scenarios projected are similar to the baseline, showing 3% loss in the year 2100 under WB2 C and accumulated net present value of GDP loss over this century of 0.3% per year.
Food waste increases in the first part of century and then declines (figure 2(j)). As we did not assume that any additional policies are implemented to reduce food waste explicitly, the trend is similar to that of total agricultural demand under the baseline scenario. The mitigation scenarios show similar trends to the baseline scenario, crossing in the latter half of the century. This crossover is driven primarily by increased production of waste from first-generation biofuels produced from sources such as sugarcane in the mitigation scenario.
Forest area benefits from climate change mitigation through the carbon pricing mechanism due to the large carbon stock in such land (below and above the ground), leading to enhanced afforestation and reforestation of around 200 Mha during this century in the WB2 C scenario, whereas the baseline scenario maintains nearly the same forest area as the base year. The biodiversity index worsens slightly in both scenarios due to land use changes. The mitigation scenario may show an adverse side effect of mitigation actions due to land-based emissions reductions (e.g. bioenergy crop expansion), but these impacts are small (4% and 6% in the baseline and mitigation scenarios). Note that we do not consider the impact of climate change (temperature and precipitation effects), but previous studies have shown that much stronger negative impacts may occur in the baseline scenario [26]. Details of the scenarios for individual Asian regions and worldwide corresponding to figure 2 are shown in figures S3–S8, and supplementary note 2.
Regarding the differences between 1.5 C and WB2 C scenarios, there are two main features. First, the responses to the mitigation scenarios seen in WB2 C is strengthen in 1.5 C scenario. Second, the gaps are largest mid of the century while get small at the end of century. This can basically be explained by the emissions gap (figure 1).
3.3. Marginal SDG emissions reduction values
Figure 3 illustrates the relationship between CO2 emissions reduction rates and changes in SDG indicators compared with the baseline scenario. We fitted the plots through simple linear regression with a slope of the MSVs. Then, we added information about synergies, trade-offs, and unclear relationships, indicated on the traffic light in green, red and yellow, respectively. An unclear relationship here means that we could not obtain a statistically significant slope at the 5% confidence level. The relevant statistics are shown in table 4. As shown in the Asian total time-series panel, similar tendencies are observed in most regional results. For example, risk of hunger consistently worsened, while premature death associated with air pollution improved across all regions. This result indicates that Asian regions face similar challenges and experience similar co-benefits.
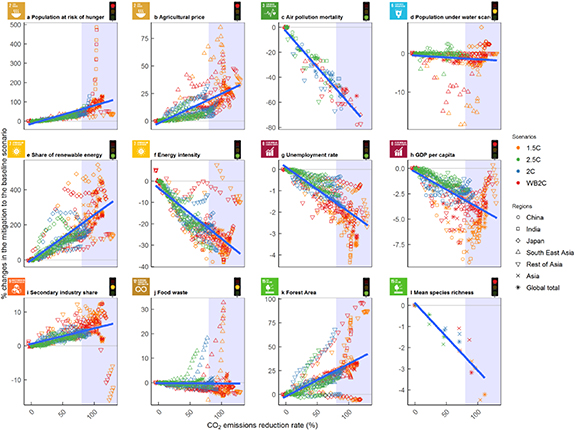
Figure 3. Marginal SDG emissions reduction curves for Asia. The x-axis represents CO2 emissions reduction rates in the mitigation scenario compared to the baseline scenario and the y-axis shows the percentage changes of individual SDGs in the mitigation scenario compared with the baseline scenario. The green, red and yellow traffic signals indicate improvement, worsening or mixed changes in SDGs when climate change mitigation is implemented. The trends are linear fits. Areas of over 100% CO2 emissions reduction are shaded. Note that biodiversity index (panel i) shows only continent-scale regions.
Download figure:
Standard imageHigh-resolution image
Table 4. Statistics of the regression for the MSVs for Asia.
| | Estimates | Standard error | t-value | Pr(>|t|) | | | ---------------------------- | -------------- | ------- | --------- | ---- | | Population at risk of hunger | 0.95 | 0.06 | 16.57 | 0.00 | | Agricultural price index | 0.27 | 0.01 | 23.14 | 0.00 | | Air pollution mortality | −0.58 | 0.02 | −31.00 | 0.00 | | Population at water scarcity | −0.01 | 0.00 | −2.72 | 0.01 | | Energy intensity | −0.24 | 0.01 | −30.06 | 0.00 | | Share of renewable energy | 2.58 | 0.09 | 29.46 | 0.00 | | Unemployment rate | −0.02 | 0.00 | −32.25 | 0.00 | | GDP per capita | −0.03 | 0.00 | −20.53 | 0.00 | | Secondary industry share | 0.05 | 0.00 | 12.35 | 0.00 | | Food waste | 0.00 | 0.01 | −0.24 | 0.81 | | Forest Area | 0.34 | 0.02 | 19.19 | 0.00 | | Mean species richness | −0.03 | 0.00 | −11.54 | 0.00 |
Co-benefits were identified for air quality, renewable energy share, energy intensity, unemployment and forest area, which exhibit 0.58%, 0.23%, 2.6%, 0.02%, and 0.34% improvements with 1% CO2 emission reduction compared with the baseline scenario, respectively. At the same time, risk of hunger, agricultural price, GDP, and biodiversity show adverse effects of 0.94%, 0.26%, 0.034%, and 0.026%, respectively. The food waste slope was statistically insignificant and, thus, we could not determine its relationship. One the one hand, the food consumption level would be slightly decreased under the mitigation while the first generation biomass expansion associated with higher carbon price would increase the production side waste.
Although most indicators were statistically significant, some countries show strong unique reactions to climate change mitigation as the CO2 reduction deepens beyond an 80% reduction. For example, the risk of hunger (figure 3(a)) in India exhibits a remarkably strong response in the area of high CO2 reduction, mainly due to increases in land rent. Food waste in Southeast Asia and the secondary industry share in the rest of Asia are other examples. The former is induced by first-generation biofuel production and the latter is due to energy crop expansion, which leads to an increase in primary industry share. These findings imply that the MSVs are currently applicable for moderate reductions (e.g. less than 80%). Over 80% reduction would cause non-linear responses. An 80% reduction would represent a strong reduction target in current climate policy, based on nationally determined contributions (NDCs) [27], but attaining the Paris Agreement goal of well below 2 °C requires deeper reductions in emissions, at least in the second half of this century. Notably, the Asia and global totals show very similar trends, indicating that the multi-dimensional sustainable development implications of climate change mitigation in Asia are similar to those at the global scale in terms of relative changes to the baseline scenario.
We explored the Asian SDG implications of climate change mitigation actions and developed marginal SDG emissions reduction values (MSVs), which provide multiple benefits. First, they can be used for any country that would like to predict the SDG implications of climate change mitigation actions without complex computer simulation models, such as integrated assessment models. For example, if a country is considering a 50% CO2 emissions reduction target as a post-Paris Agreement national target, they may be able to obtain first-order approximations of the SDG implications using the method introduced in this study. Second, the research modelling community would also benefit greatly from this information. Few models can represent the fine details and wide range of sectoral SDG impacts, and the information in this study will be useful to those modelling teams.
The robustness of the results must be investigated carefully and, therefore, four types of regression were carried out. First, we tested the regressions by excluding data points representing more than 80% reductions of CO2 emissions, as figure 3 shows a large spread in those data. Second, global model results (17 regions) were regressed to determine whether the results are applicable only to Asia or worldwide. Third, the global model results were used while excluding greater than 80% reductions of CO2 emissions, as described above for the Asian dataset. Fourth, we excluded each Asian regional result and regressed the results with that region to ensure that the overall results are unaffected by single-region results. The derived slopes were similar to those of the full dataset regression (figure 4). One exceptional case is the full global dataset, which shows markedly different values for some indicators (air pollution, energy intensity, and secondary industry share). This result appears to be driven by extraordinary behaviour in some regions (e.g. Brazil) with over 150% reductions (i.e. large negative emissions; see figure S9). Thus, we can conclude that our results are applicable for not drastic CO2 emissions reductions of less than 80%. Moreover, if this information is applied for national policy assessments, dramatic changes could occur in some countries with large reductions, as illustrated in figure 3. One more note is that we applied worldwide uniform carbon prices for each scenario, but actually this may not be realistic. If we assume individual nation’s emissions reduction levels by considering current capability, responsibility and equity, there would be much more regional variation and the regressed MSV parameters can change.
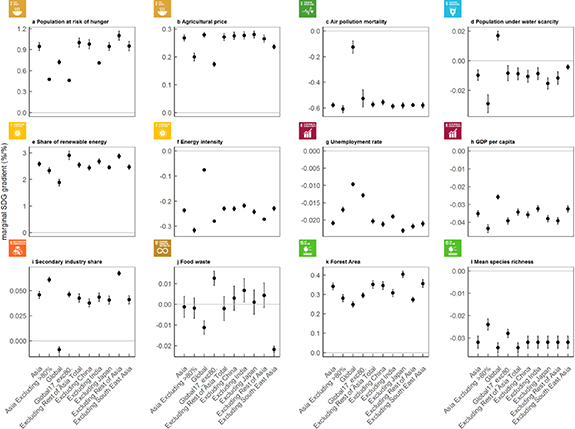
Figure 4. Regression results validating the robustness of the estimated marginal SDG emissions reduction curves. X-axis indicates the tests used; ‘Asia’: original data, ‘Asia excluding >80%’: excluding data for CO2 reductions over 80%, ‘Global’: global data, ‘Global excluding >80%’: global data excluding CO2 reductions over 80%, and the others are excluding individual Asian regions. Dots represent regression slopes of CO2 emission reduction rates and error bars indicate standard errors.
Download figure:
Standard imageHigh-resolution image
In this study, we only employed linear regressions for MSV fitting, but non-linear relationships are possible. In particular, at greater emissions reduction rates, the non-linearity could be strong. Application of more complicated regression techniques could result in better fitting; however, such approach would reduce the simplicity and ease of use and, therefore, we employed linear regressions in this paper. This study’s primary focus was on introducing the concept of MSVs, and further elaboration, such as the use of other regression methods, would be a logical next step. Incorporating more samples is also expected to improve the reliability of estimates, as is adding more integrated assessment model results. Considering fixed effects of regions may also be another possibility but we have carried out the regression with the region fixed effects which shows small differences from the original results and the qualitatively results are hold (table S1).
We defined the ratio of SDG indicator changes in the mitigation scenarios to those in the baseline scenario as MSVs. Ratios relative to the base year may also prove useful. However, we tested that relationship and obtained poor results with some exceptions such like air pollution (see figure S10 for parameter fitting and figure S11 and supplementary note 3 for comparison with the predicted ratios in Asian regions in 2075), partly because changes relative to the base year include the effects of socioeconomic changes that occur regardless of the stringency of climate policies, making CO2 reduction rates poor explanatory variables.
We confirmed that numerous benefits arise from climate change mitigation, enabling achievement of some SDGs. Meanwhile, we confirmed that there are also trade-offs between climate change mitigation and SDGs, and avoiding adverse side effects still must be addressed. Some countermeasures have already been proposed in previous studies; for example, food aid and exemption from carbon pricing for the agricultural sector would help avoid the trade-off with SDG2 [14].
Interpreting this study in comparison with previous works, we consider two remarkable articles, namely, Bertram et al [2] and van Vurren et al [3], both of which explored long-term global multi-dimensional sustainability implications. To these bases, we have added several indicators that have not been quantified to date (e.g. mortality associated with air pollution, population at risk of water scarcity and unemployment). The present study adds to the field in this regard, as well as by focusing on Asian regional implications. Meanwhile, we found similarities that validated the results of those studies. For example, Bertram et al [2] implemented multiple societal changes along with simple carbon pricing, which is typically used in climate change mitigation studies, and the food price increased due to climate change mitigation without exemption from carbon pricing for agricultural GHG emissions.
Several caveats are needed for interpretation of this study. Firstly, the indicators employed in this study are limited within the broad context of sustainable development. We mapped the assessed indicators with SDG targets, but they do not fully represent each SDG target. Thus, the multi-faceted implications discussed in this study represent just one illustrative example of such analysis. At the same time, assessment of a full, complete set of indicators is not a realistic approach for integrated assessment modelling and, thus, a compromise is needed. Secondly, as noted above, improvement of land-related modelling is in progress. Thus, careful consideration is needed when interpreting the results of land-related factors and improvement of the representations of land use and associated factors is desirable. Although some studies have shown that scenarios with certain societal changes have relatively low reliance on negative emissions technologies [3, 28], once zero or negative CO2 emissions are required, it is impossible to avoid changing land use unless the direct air capture or its equivalent technologies are available. In contrast to previous studies, we did not explicitly consider additional ecosystem protection and food security policies that may be implemented in climate change mitigation strategies. When implementing large-scale dedicated bioenergy crop production, it is important to consider protecting the land ecosystem to avoid the problems seen with deforestation for commercial usage. In Asia, Indonesian palm oil plantations are a well-known example, showing that market-driven changes without special consideration for environmental protection can easily degrade the ecosystem. Thirdly, and related to the first and second points, we did not consider other land-related impacts that may be affected by climate change mitigation actions, such as nitrogen pollution and water quality changes, which are often cited as global concerns [29]. If bioenergy crops rely on intensive nitrogen fertilisation, the situation could worsen. Fourthly, we did not include climate change effects (e.g. agricultural yield and biodiversity) in this analysis and accounting for them would further improve the results.
Finally, we explore the future research potential based on this study. First, we limited the number of scenarios to obtain better focus, as there are multiple ways to expand the scenario frameworks. Addition of shared socioeconomic pathway (SSP) dimensions would be the first change to implement. More climate scenarios under various climate policies would also be useful. In the long term such differences may not be of concern, but for short-term scenarios based on NDC, it may be useful. Second, expanding the SDG-related indicators would be beneficial (e.g. SDG1). Third, as noted above, land use issues must be addressed under zero or negative emissions conditions, as land use would be strongly affected by climate change mitigation and the current aggregated and naïve models must be improved. Fourth, we assessed the SDG indicators from the perspective of climate change mitigation, and the reverse analysis, targeting each SDG objective and then interpreting the climate change mitigation implications, is also highly relevant and should be explored in future research.
S F, K T, and T H are supported by the Environment Research and Technology Development Fund (2-2002 2-1908, S-14) of the Environmental Restoration and Conservation Agency of Japan and JSPS KAKENHI Grant (No. 19H02273). S F, K T, and T H are supported by The Sumitomo Foundation. H D and Y X are supported by the National Natural Science Foundation of China (71903010, 71704005).
The authors declare no competing interests.
S F, T H and K T designed the research, S F carried out analysis of all modelling results, T H computed risk of hunger and gridded land use, H O and M T translated land use information into the biodiversity index. H D, Y X, Y Z, S F and Y H generated air quality data and performed the health assessment, J L, S F and K T contributed to developing the water assessment tool, S F created figures, and S F drafted the paper; all authors contributed to discussion and interpretation of the results.
The data that support the findings of this study are openly available at the following URL/DOI: https://doi.org/10.7910/DVN/4YOAYM. In this repository, there are two files as follows; IAMCTemplate.csv: The data template which is based on the IAMC template (www.globalchange.umd.edu/iamc/scientific-working-groups/data-protocols-and-management/iamc-time-series-data-template/).
SDGIndicators.csv: This a subset of the above IAMC data template only taking the SDG indicators shown in the paper.