Satellite-based global maps are rarely used in forest reference levels submitted to the UNFCCC (original) (raw)
1748-9326/18/3/034021
Abstract
The Earth observation (EO) community is coordinating a range of activities in support of the Global Stocktake. One objective is to enhance the uptake of satellite-based global-scale maps (hereafter ‘EO products’) in national greenhouse gas (GHG) inventories submitted to the United Nations Framework Convention on Climate Change (UNFCCC). To measure progress towards this objective, we compile information on the use of EO products on land cover, fire, and above-ground biomass to derive carbon flux estimates in forest reference levels from 56 tropical countries submitted to the UNFCCC between 2014–2022. The global forest change (GFC) was the only EO product used to measure land extent and change, and was used by almost half the countries. Only two countries used existing EO products for fire mapping. Four countries used biomass maps, although only indirectly, such as for comparing with biomass estimates from field plot measurements or with IPCC defaults. The uptake is limited but improved the measurement, reporting and verification capacity of 22 countries. The relatively high uptake of the GFC demonstrates the importance of meeting essential conditions in the IPCC guidance when developing EO products, including conditions on spatial and temporal resolution, temporal coverage and consistency, and the flexibility to adapt to biophysical thresholds in national definitions. The limited use of other global land EO products underlines the need for developers of EO products to interact with groups responsible for GHG inventories and experts familiar with IPCC guidance so that their products are suitable for national reporting, and thus contribute to more complete aggregated estimates in the Global Stocktake.
Export citation and abstractBibTeXRIS
Forests play a key role in the pledges made by countries towards meeting Paris Agreement (UNFCCC 2015) targets, mostly through reducing carbon emissions from deforestation or enhancement of carbon removals from large afforestation programmes (Grassi et al 2017). However, measuring and tracking these contributions from the land use, land use change and forestry (LULUCF) sector is complex, and the corresponding estimates of greenhouse gas (GHG) fluxes have high uncertainties (Friedlingstein et al 2022). The Global Stocktake, running in 2021–2023 and to be repeated in 5 year cycles, will use aggregated information from national submissions to the United Nations Framework Convention on Climate Change (UNFCCC), complemented by independent inputs (e.g. the assessment report of the United Nations Intergovernmental Panel on Climate Change, IPCC), to assess the collective progress in achieving the objectives of the Paris Agreement. For the process to be effective in informing policy makers on the role of forests and land use in achieving carbon neutrality, the high levels of uncertainty in the estimates of GHG fluxes from land must be reduced.
Global maps derived from satellite-based Earth observation (hereafter ‘EO products’) are considered fundamental in addressing this problem, as a practical means to consistently monitor large-scale and remote land areas at high spatial and temporal resolutions (DeFries et al 2007, Achard and House 2015, Romijn et al 2018, Herold et al 2019). Such global capabilities can support country Parties to the UNFCCC in measuring fluxes from LULUCF and in fulfilling their reporting obligations, namely the national GHG inventories that form an integral part of the Global Stocktake (table 1). This is particularly relevant for tropical countries, where domestic GHG inventories are neither frequent nor complete (Federici et al 2017, Grassi et al 2022).
Table 1. Examples of key uses and opportunities for earth observation (EO) products in the core elements of the Paris Agreement (UNFCCC 2015, corresponding article in brackets). Satellites can only measure the land surface, so only the above-ground biomass pool is considered here within emission and removal factors (EF/RF). Note the identified key uses have a bias towards the mitigation component of the Paris Agreement.
| Element of the Paris agreement | Opportunities for satellite data and derived products (‘EO products’) |
|---|---|
| Updating nationally determined contributions (NDCs) (Art. 4) | Quantitative metrics to derive quantitative targets and to obtain GHG targets from non-GHG targets. |
| Reducing emissions from deforestation and forest degradation in developing countries (REDD+) (Art. 5) | Estimation of activity data (land area change, AD) and emission/removal factors (biomass change, EF/RF)) for establishing forest reference levels (FRLs) and report REDD+ results in a technical annex to the Biennial Transparency Report (BTR) in the context of accessing results-based payments,assessment of drivers of forest changes and corresponding carbon fluxes for REDD+ strategies,independent data sources for comparison by the assessment teams/UNFCCC LULUCF experts or to constraint the estimates by the Party (verification). |
| National reporting under the enhanced transparency framework (Art. 13) | Estimation of carbon emissions and removals from forests, and non-forest areas with significant woody biomass (i.e. cropland/ grassland) in the GHG inventory (GHGi) and biennial transparency reports (BTRs; including AD and EF/RFs for all categories), and to track progress of the quantitative indicators of the NDCs,supporting tools for Parties with lower Measurement, Reporting and Verification (MRV) capacity who will need to adapt to the more stringent reporting rules (previous non-Annex I Parties),Independent data sources for verification and to support assessment teams in the technical expert review of BTRs. |
| Global stocktake (Art. 14) | Contribution to inputs (first phase) to each cycle of the Global Stocktake (taking place every five years), and its collective view on progress to achieve the objectives of the Paris Agreement, through country-Party submissions (NDCs, REDD+, GHGi/BTR, see above) and independent estimates by non-Party stakeholders. |
The international EO community monitoring the land surface has responded spectacularly to the needs of the Global Stocktake (CEOS 2021, ESA 2022, Hegglin et al 2022). Firstly, space agencies are making large investments to launch new missions (e.g. Landsat 8, GEDI, BIOMASS, NISAR) dedicated to measuring land dynamics, forest structure and biomass using a combination of sensor types (Quegan et al 2019, Dubayah et al 2020). Secondly, there is an unprecedented degree of collaboration between international groups on harmonizing methods and improving the accuracy and policy-relevance of EO products (Szantoi et al 2020, Tsendbazar et al 2021, Araza et al 2022, Labriere et al 2022). Finally, partnerships with technology platforms allow free and easy dissemination and processing of EO products (Gorelick et al 2017) which should facilitate their uptake in reports to the UNFCCC and support the operationalization of the Paris Agreement (table 1). Nonetheless, it is unclear how extensively the wide range of EO products offered by the EO community (table 2) are being used in national reporting and thus is contributing to the Global Stocktake.
Table 2. Examples of existing satellite-based global-scale maps (or earth observation products in the text) on land-cover, land-cover change, fire, and above-ground biomass (AGB) covering the tropics. Many of these products are identified as being key for the land sector by the research and systematic observation community (ESA 2022). Because the focus of our study is on country uptake for domestic GHG inventories and on consistent global monitoring for the global stocktake, we have excluded datasets with spatial resolutions coarser than 1 km and with only regional to local coverage. Maps produced with Earth observations from airborne data are not included.
| Earth Observation products (global/pantropical scope) | Spatial resolution | Temporal coverage | Theme/units | |
|---|---|---|---|---|
| Land cover and land cover change | ||||
| NASA MODIS Land Cover MCD12Q1 | (Friedl et al 2010) | 500 m | 2001-present (yearly) | Class (in 6 different legends) |
| Global land cover facility tree-canopy | (Sexton et al 2013) | 30 m | 2000, 2005, 2010, 2015 | Percent tree-cover |
| Global forest change | (Hansen et al 2013) | 30 m | 2000 | Percent tree-cover |
| 2000-present (yearly) | Class loss | |||
| 2000-present | Class year of gain | |||
| JAXA forest non-forest maps | (Shimada et al 2014) | 25 m | 2007–2010 (yearly), 2015–2021 (yearly) | Class (Forest, Non-Forest) |
| CCI land cover maps | (ESA 2017) | 300 m | 1992-present (yearly) | Class (hierarchical) |
| Global mangrove watch | (Bunting et al 2018) | 25 m | 1996, | Class |
| 2007–2010 (yearly), | ||||
| 2015–2020 (yearly) | ||||
| Copernicus land cover | (Buchhorn et al 2020) | 100 m | 2015–2019 (yearly) | Class (hierarchical) + cover fraction |
| Global mangrove loss drivers | (Goldberg et al 2020) | 30 m | 2000–2005; 2005–2010; 2010–2015 | Class |
| HILDA+ global land-use change reconstruction | (Winkler et al 2021) | 1 km | 1960–2019 (yearly) | Class (6 + change) |
| WorldCover | (Zanaga et al 2021) | 10-m | 2020; 2021 (planned) | Class |
| Sentinel-2 land-use/land-cover | (Karra et al 2021) | 10 m | 2017–2021 (yearly) | Class (10, including “trees”) |
| Global land cover mapping and estimation (GLanCE) | (Arevalo et al 2022) | 30 m | 2001–2019 (yearly) | Class (7, including ‘tree-cover’) |
| Fire | ||||
| Copernicus burned area | (Tansey et al 2008) | 300 m | 2014-present | Class |
| MODIS active fire MOD14A1 | (Giglio et al 2016) | 1 km | 2000-present (monthly) | Class |
| MODIS burned area MCD64A1 | (Giglio et al 2018) | 500 m | 2001-present (daily) | Class |
| VIIRS S-NPP NOAA-20 hotspots | (Schroeder and Giglio 2018) | 375 m | 2012-present | Class |
| CCI-fire burned area | (Lizundia-Loiola et al 2020) | 250 m | 2001-present | Class |
| Above-ground biomass | ||||
| NASA JPL | (Saatchi et al 2011) | 1 km | 2003–2004 | Mg/ha |
| WHRC pantropical AGB map | (Baccini et al 2012) | 500 m | 2007–2008 | MgC/ha |
| GEOCARBON (map fusion) | (Avitabile et al 2016) | 1 km | 2003–2008 | Mg/ha |
| GlobBiomass growing stock and AGB | (Santoro et al 2021; 2018) | 100 m | 2010 | m3/ha; Mg/ha |
| Global mangrove AGB | (Simard et al 2019) | 30 m | 2000 | Mg/ha |
| CCI biomass | (Santoro et al 2021) | 100 m | 2010, 2017, 2018 | Mg/ha |
| AGB change, pantropical belt | (Baccini et al 2021) | 500 m | 2003–2016 | Mg C/ha/yr |
| NASA GEDI footprint product | (Duncanson et al 2022) | 25 m | 2019–2021 | Mg/ha |
| NASA GEDI gridded product | (Dubayah et al 2022) | 1 km | 2019–2021 | Mg/ha |
We therefore present a compilation of information on the use of satellite data, specifically global EO products developed from satellite data, for estimating carbon fluxes from the LULUCF sector in the reporting from country Parties to the UNFCCC. The overall objective is to evaluate if the global capabilities provided by these new opportunities are being exploited in the national reporting obligations to the UNFCCC, and thus to assess the extent to which the decade-long investment in developing EO products is effective in supporting national aspects of international climate policy (Oliver and Cairney 2019, Findlater et al 2021). While other studies aggregate data from reports to the UNFCCC to explain the large differences in carbon flux estimates from different sources (Deng et al 2022, Grassi et al 2022), here we focus on the satellite-based data and methods that are used to ingest EO products. We also focus on tropical developing countries, where remote sensing contributions to forest monitoring are larger (Nesha et al 2021), GHG inventories are scarcer and less complete, and measurement, reporting and verification (MRV) capacity has improved through REDD+ (Federici et al 2017). We include data from 56 countries with 75 submissions to the UNFCCC under the MRV for REDD+ Framework (UNFCCC 2014) from 2014 and up to 2022. We seek to understand: (a) if satellite data, and specifically the numerous products offered by the EO community, are being used; (b) which ones are used; and (c) how they contribute to quantifying the domestic carbon fluxes from the LULUCF sector. This provides a basis for identifying which products are effective in this sector, and why. It also highlights the challenges to wider use of existing and planned products.
We compile data from all the forest reference emission levels/forest reference levels (FREL/FRLs) to date submitted voluntarily to the UNFCCC over the almost 10 years of the REDD+ framework (UNFCCC 2014). We use the term FRL regardless of whether removals are included (typically FRL) or only emissions are reported (typically FREL). Our analysis covers 56 countries and 75 FRLs submitted since 2014. Combined, these submissions cover a forest area of over 1.5 billion ha, which is over 1/3 of global forest area and more than 80% of the forest land in the tropical domain (FAO 2020b). We group the submissions by geopolitical regional groups recognized by the UN and the group of least developed countries (LDCs) which overlap with the regional groups. Of the 75 FRLs included in our analysis, six are still undergoing technical assessment (cut-off date December 2022). For the 69 that have completed the assessment we also extracted information from the technical reports prepared by the LULUCF expert reviewers. Annexes to the 75 FRLs or other auxiliary information, if made available by the Party, were also reviewed. All the information used is accessible in the REDD+ portal (UNFCCC 2022b) and through web links within each submission. The overview database prepared by the UNFCCC secretariat (UNFCCC 2022a) was used for quality control and as an alert for new submissions or for submissions completing the technical assessment process and with technical assessment reports available for inspection (figure 1).
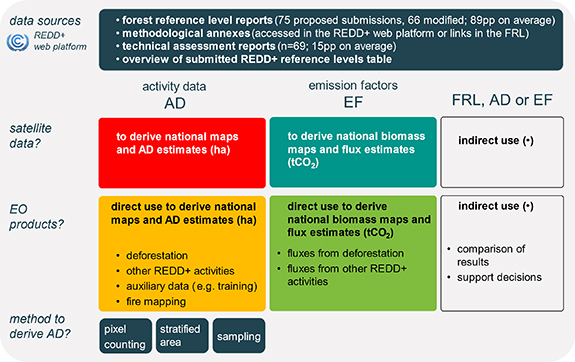
Figure 1. List of all data sources used in this study (accessed through the UNFCCC REDD+ Web platform, (UNFCCC 2022b), and methodological steps in the analysis. For each of the 75 forest reference level (FRL) submissions, we checked if: (i) satellite data (e.g. Landsat imagery) or ii) EO products (satellite-based global maps, see examples in table 2) were used in their development; if so, for which element of the FRL (AD—activity data or EF—emission factors) and in which way (direct or indirect use). In addition, we identify (iii) which method was used to derive AD. For clarity, the colour scheme and symbol • match the legend of the figures and tables in the results section.
Download figure:
Standard imageHigh-resolution image
In each submission we identify the use of satellite data (e.g. Landsat imagery) and EO products (or satellite-based global maps as in table 2) for land cover and land cover change, fire and above-ground biomass to estimate the IPCC variables related to activity data (area and area change, AD), and emission or removal factors (biomass and biomass change, EF/RF). We separate the different ways in which EO products can contribute to estimating AD from (a) ‘deforestation’, and (b) ‘other REDD+ activities’ (all classes can be mapped to the IPCC categories used in GHG inventories, see supplementary information; table S1), and also whether they were used (c) as auxiliary data, or (d) to map fire occurrences associated with either deforestation or forest degradation. These are ‘direct’ contributions to deriving AD. The use of EO products for EFs is only disaggregated into uses to directly estimate carbon fluxes from (a) ‘deforestation’ and (b) ‘other REDD+ activities’. We further identify ‘indirect contributions’ of EO products if they are not used directly to estimate one of the variables (AD or EF) but are used, for example, to support decisions and compare/constrain national estimates (verification).
Finally, to understand if other methodological choices determine the use or preference for certain satellite data sources, including EO products, we identify which of three methods was selected by the country to derive AD: (a) ‘pixel-counting’, where areas of change are obtained by comparing two (or more) wall-to-wall maps or direct change detection wall-to-wall maps are produced; (b) ‘stratified area estimation’ (Olofsson et al 2014), where the classification bias of the areas from the wall-to-wall map is corrected using a reference dataset (i.e. better quality data, such as photo-interpretation from higher resolution imagery or use of field data); and (c) ‘sampling’, when AD estimates are derived from a reference dataset and calculated directly from sample proportions without using areas from a map.
Satellite data, mostly Landsat imagery or imagery accessed through the Collect Earth platform (combining a time series of Google Earth, Bing Maps, Landsat, Sentinel, SPOT and RapidEye images), were used by all countries to produce their own maps or estimates for the FRL, in particular as a data source for forest change data (AD; red quadrants, figure 2). EO products were used by 46% of the countries (n = 26; lower quadrants figure 2), but this proportion varied with geopolitical/negotiating groupings: 70% of LDCs (noting the overlap with regional groups), 65% of African States, 50% of Asian States, but only 25% of Latin American and the Caribbean (LAC) States used EO products. Hence, the regional group with highest proportion of countries submitting FRLs (more than 60% of LAC countries submitted at least one FRL) is also the group relying less on EO products to derive their FRLs (figures 2(a); S1).
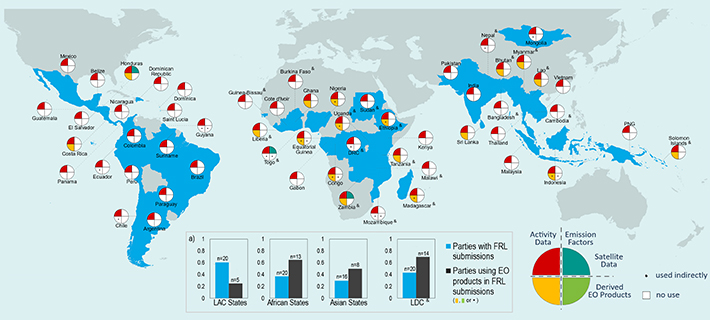
Figure 2. Location of the 56 country parties to the UNFCCC that submitted 75 forest reference emission levels/forest reference levels (FREL/FRL) to the UNFCCC from 2014 up to 2022. The colour scheme in the quadrant charts shows the use of satellite data (e.g. Landsat imagery) and derived products (i.e. satellite-based global maps in table 2 or ‘EO products’ in the text) to directly derive activity data (AD, left-hand quadrants in red and yellow respectively), and emission factors (EF, right-hand quadrants in teal and green respectively). Indirect uses of EO products are represented with a • mark in a quadrant (e.g. use for validation, to justify decisions, to adjust the FREL/FRL, or for comparison of reported estimates). See table 4 for more details on what is considered direct and indirect contributions and table S2 for details on the specific ways country parties use the data. Use of maps produced from airborne technology are not included. Panel (a) shows the proportion of developing country parties that have submitted at least one FREL/FRL (blue bars) and proportion within those that submitted at least one FREL/FRL using ‘EO products’ in their FREL/FRL (black bars; including direct and indirect use of EO products depicted in the widgets in yellow and green and with a • mark). Country parties are separated in panel (a) by geopolitical regional groups recognized by the UN—Latin American and the Caribbean (LAC) States, African States, Asian States—and the negotiating party group defined as least developed countries (LDCs, marked with the & symbol). Note that the 56 countries with FREL/FRL submissions are part of one of the three regional groups while 20 of them are also designated by the UN as LDCs. See figure S1 for more information on MRV capacity indicators separated by party groupings.
Download figure:
Standard imageHigh-resolution image
All countries using EO products to derive AD (n = 24 or 43% of the total countries with FRL submissions; yellow quadrants, figure 2) relied on a single product—the global forest change (GFC) product (Hansen et al 2013). Submitted FRLs show that national technical teams found ingenious ways to adapt and integrate the GFC product into their monitoring systems, even to directly estimate deforestation and other forest dynamics and land-use transitions (‘other REDD+ activities’) (n = 16; tables 3, 4, S2). For example, tree cover or tree cover loss or gain data were resampled to pixel blocks matching the minimum mapping unit of the national definition and combined with domestic maps or a reference dataset for the correct attribution of land uses in cases of tree crops, shifting agriculture, harvest and oil palm plantations (e.g. Bhutan, Equatorial Guinea, Madagascar, Sri Lanka). The GFC product was also used in combination with other data, including very high resolution imagery, to train a map classifier (e.g. Ethiopia, Zambia, Tanzania) or to correct mapped areas (e.g. Honduras). Furthermore, 14 countries used it indirectly, e.g. for quality control or verification by comparing the estimates produced with national data with the deforestation magnitude and trends of the GFC product (n = 9).
Table 3. All the global maps derived from satellite-data (‘EO products’) used by 26 out of the 56 countries that submitted a forest reference emission levels/forest reference levels (FREL/FRL) to the UNFCCC between 2014 and 2022 and ways in which these products were used: to directly derive activity data (AD; yellow box) and emission factors (EF; green box) or contributing indirectly to the FREL/FRL. The EO products are grouped by type: land cover and land cover change, fire, and above-ground biomass (text in bolt). Colors and symbols (yellow, green and • match the legend of figures 1–2). Uses for AD are separated into deriving information on ‘deforestation’, on ‘other REDD+ activities’, as auxiliary data (e.g. as training data or to correct the maps), and to map fire occurrences. Uses for emission factors are separated into deriving information on ‘deforestation’ and ‘other REDD+ activities’. Unlisted countries (from the 56 with submitted FREL/FRL) used no EO product in their FRLs, or if one was used, it is not clearly identified in the submission and supporting documentation. Dash (-) denotes no use. * Togo compared emission results with data from the global forest watch relying on the global forest change (Hansen et al 2013) product. Totals are total number of countries. Note countries can appear repeated in the same column or row.
| EO products used | Activity data | Emission factors | Indirect contribution (•) | Total countries | |||||
|---|---|---|---|---|---|---|---|---|---|
| Deforestation | Other REDD+ activities | Auxiliary data | Fire mapping | Deforest. | Other REDD+ activities | Support decisions assumptions adjustments | Comparison of results | ||
| Land cover and land cover change | |||||||||
| Global forest change (GFC) | (10) | (6) | (6) | — | — | — | (6) | (9) | 24 |
| Bhutan | Bhutan | Ethiopia | Congo | Chile | |||||
| Congo | Costa Rica | Honduras | DRC | Ecuador | |||||
| Costa Rica | Equat.Guinea | Lao | Indonesia | Ethiopia | |||||
| Equat.Guinea | Liberia | Tanzania | Madagascar | Indonesia | |||||
| Liberia | Solom.Islands | Uganda | Mongolia | Mozambique | |||||
| Madagascar | Sri Lanka | Zambia | Nigeria | Nepal | |||||
| Myanmar | Togo* | ||||||||
| Nigeria | Uganda | ||||||||
| Solom.Islands | Zambia | ||||||||
| Sri Lanka | |||||||||
| Fire | |||||||||
| MODIS burned area | — | — | — | (1) | — | — | (1) | — | 2 |
| Ghana | Equatorial Guinea | ||||||||
| MODIS active fire | — | — | — | (1) | — | — | — | — | 1 |
| Indonesia | |||||||||
| NOAA fire hotspots | — | — | — | (1) | — | — | — | — | 1 |
| Indonesia | |||||||||
| Above-ground biomass | |||||||||
| Saatchi et al (2011) | — | — | — | — | — | — | — | (3) | 3 |
| Congo | |||||||||
| Equat.Guinea | |||||||||
| Mozambique | |||||||||
| Baccini et al (2012) | — | — | — | — | — | — | (1) | (1) | 2 |
| Guyana | Congo | ||||||||
| Total countries | 18 | 0 | 16 | 26 |
Table 4. Examples of how this study classifies the different contributions from products derived from satellite data (EO products) found in forest reference emission level/forest reference level (FREL/FRL) submissions to the UNFCCC. The main classification of EO product uses is as i) a direct contribution to derive activity data (AD; highlighted in yellow), ii) a direct contribution to derive emission factors (EFs; in green; n.a. because no examples of uptake were found) and iii) indirect contributions related to either AD or EFs (in white). See more details at country level in Table S2.
| Classes of EO product uses | Examples of uses found in reference level submissions (Party, year of submission) | |
|---|---|---|
| Activity data (AD) | Direct use for ‘deforestation’Direct use for ‘other REDD+ activities’ | Filling cloud gaps (Costa Rica 2016);Produce wall-to-wall forest non-forest maps by adjusting tree-cover and tree-cover change to national definitions or combining it with national layers (Bhutan 2020, Congo 2016, Costa Rica 2016, Liberia 2020, Madagascar 2017 and 2018, Nigeria 2018 and 2019, Sri Lanka 2017);Support the classification of sample units (Solomon Islands 2019) or segments (Equatorial Guinea 2020);‘Pixel-counting’ approach (Costa Rica 2016, Madagascar 2017);Stratification in a ‘stratified area estimation’ approach (Bhutan 2020, Congo 2016, Equatorial Guinea 2020, Liberia 2020, Madagascar 2018, Myanmar 2018, Nigeria 2018 and 2019, Sri Lanka 2017);‘Sampling’ approach (Solomon Islands 2019). |
| Auxiliary data | Training data (Ethiopia 2016, Tanzania 2017, Uganda 2017, Zambia 2016);Map correction (Honduras 2017, Lao 2018, Zambia 2021). | |
| Fire mapping | Burned areas mapping (Ghana 2017);Supporting the mapping (Indonesia 2022);Validating burned areas (Indonesia 2022). | |
| Emission factors (EF) | Direct use for ‘deforestation’ | n.a. |
| Direct use for ‘other REDD+ activities’ | ||
| Indirect contribution (•) | Map validation (Madagascar 2017);Justification of omission of activities and gases (Equatorial Guinea 2020, Nigeria 2019);Supporting the choice of tree canopy threshold to define forest land (DRC 2018, Equatorial Guinea 2020);Adjusting the FRL (Guyana 2015; Congo 2016);Comparing estimates by the Party (Congo 2016, Equatorial Guinea 2020, Ethiopia 2016, Mozambique 2018, Nepal 2017, Togo 2020, Uganda 2017) or the assessment team (Chile 2016, Congo 2016, Ecuador 2015, Zambia 2016);Support decisions on the intensification of the sampling grid (Mongolia 2018);Stratification to support the spatial distribution of field plots for biomass measurements (Indonesia 2022). |
Technical teams found creative ways of using the GFC product regardless of the technique employed to derive AD (figure 3, table 4), although more than half of the available examples are from FRLs using a ‘stratified area estimate’ approach. There is a trend for countries to move away from purely pixel-counting techniques using wall-to-wall mapping (p < 0.001, 95%CI) to a combination of wall-to-wall maps with a reference dataset to correct the bias of the map-based estimates (as recommended by Olofsson _et al_ (2014) and GFOI (2020); _p_ > 0.1, 95%CI) or to probabilistic sampling methods using either a stratified or systematic approach (p < 0.001, 95%CI). This trend is closely linked to a change in preferred data sources, since the latter two methods rely heavily on very high resolution imagery. It is noteworthy that in the past two years there are no examples of use of EO products to directly estimate AD.
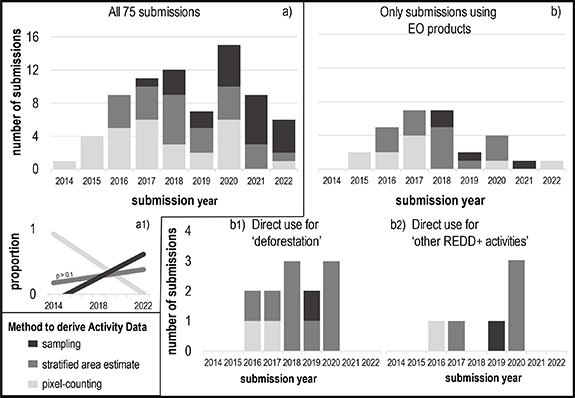
Figure 3. Number of forest reference emission levels/forest reference levels (FREL/FRL) submissions to the UNFCCC per year since 2014 and up to 2022 separated by technique employed to generate activity data (AD): pixel-counting, stratified area estimate, or sampling. Panel a) includes all the 75 submissions to date with a1) showing the trend of the annual proportion of submissions using each AD technique. The trend is statistically significant (at 95% CI) for ‘pixel-counting’ (_p_-value < 0.001) and ‘sampling’ approaches (_p_-value < 0.001) but not for ‘stratified area estimate’ (_p_-value = 0.374). Panel (b) shows only those submissions using products derived from satellite data (n = 29; 29 submissions from 26 country-parties with Madagascar, Nigeria and Zambia using earth observation products in their two submissions; see table 4); and further separated into submissions using earth observation products b1) to directly derive AD for deforestation (n = 11 including all nine countries in table 3, with Madagascar and Nigeria using it in their two submissions) or b2) to directly derive any of the other REDD+ activities (n = 6).
Download figure:
Standard imageHigh-resolution image
The use of satellite data to derive information on biomass and biomass change (EF/RF) is much less common. Just three countries used satellite imagery to produce their own biomass maps, from ALOS (Zambia 2017) or Landsat (Honduras for forest degradation and Togo, 2020) and no country used available global biomass maps (tables 3 and 4). National forest inventory (NFI) plot measurements are the main source of biomass data (61%), sometimes complemented with IPCC defaults and additional field data (23%). If an NFI was not available, countries used a combination of other sources such as harmonized plot data, literature, and IPCC defaults (38%), or even biomass data from neighboring countries (n = 2) (table S2). Two biomass maps (Saatchi et al 2011, Baccini et al 2012) were explored in four (5%) submissions (from Congo, Equatorial Guinea, Guyana, and Mozambique; tables 3, S2). However, they were only used indirectly, for example to compare estimates with the reported values in the FRL (verification). The use of EO products is also negligible for fire mapping (table 3). Of the 16 countries including emissions from forest fires or non-CO2 emissions from biomass burning from deforestation, only two used EO products to estimate AD for burnt areas (Ghana and Indonesia), and another (Equatorial Guinea) used them simply to justify omitting these fluxes.
Given the wealth of products offered by the EO community (table 2 shows just the most prominent examples and some of their characteristics), the most striking finding from this study is the lack of diversity in those used for AD and their very limited use to map fire and support estimates of EFs. Below we explore some of the issues surrounding this observation.
4.1. IPCC considerations for area representation: national definitions, spatial and temporal resolution, temporal coverage and consistency
The GFC (Hansen et al 2013) is the only EO product used to estimate AD, consistent with studies highlighting its suitability to produce estimates of forest area at both global (Harris et al 2021) and national scales if local maps are not available (McRoberts et al 2016). Reasons for its use in almost half the FRLs, and preference to other global land EO products, include its flexibility, which allows it to be adapted to different national definitions of forest land. The GFC includes a layer of percentage tree cover per Landsat pixel for the year 2000 and annual loss layers corresponding to the removal of all tree cover in a Landsat pixel. As a result, countries using the GFC selected the percentage tree cover matching the biophysical thresholds in their national definition of forest land (which always includes canopy cover thresholds, and varies between 10 and 60% among countries studied here, table S2) and integrated it with national data to produce AD. We found examples in ten submissions (see tables 4 and S2). Alternative global maps with more rigid thematic classes (e.g. MODIS land cover, JAXA F/NF, CCI land cover; table 2) are not broadly applicable and equally accurate at national level (Tsendbazar et al 2015, 2017, Li et al 2016) given the wide variation of canopy cover thresholds used to define forest, i.e. they cannot simultaneously match the forest definitions of all countries.
Land cover maps with a spatial resolution coarser than the minimum area that defines forest at national level were never used in FRL submissions. Most countries select either 0.5 ha or 1 ha as the minimum area of land in their national definitions (51% and 39% of submissions, respectively; table S2). EO products with spatial resolutions coarser or finer than the corresponding 70 m and 100 m do not accurately depict forest and forest change extent. For example, coarser pixels may include mixed classes from the national definitions and miss small-scale dynamics (Milodowski et al 2017, Kalamandeen et al 2018, Ganzenmuller et al 2022). For finer resolutions, FRLs using the GFC (30 m pixels, or approximately 0.09 ha) resampled the data to the minimum mapping unit matching the national definition of forest so as not to overestimate the area of forest and deforestation. For example, Zambia in 2016 used the GFC aggregated into 5 × 5 pixel blocks to create an initial training dataset for stable forest, non-forest and deforestation (table S2; see also Bhutan, Congo).
Temporal resolution, coverage and consistency are also important considerations (Herold et al 2019, IPCC 2019, GFOI 2020). FRLs estimate yearly fluxes and most have reference periods of 10–15 years. EO products need to be available and comparable over time, as well as consistently applied to the entire time series. Starting in the year 2000, with annual estimates of total tree cover loss, and described as globally consistent, the GFC product is the only example from table 2 meeting those requirements. Products that are not annual (i.e. coarser temporal resolutions) may miss land dynamics such as harvest and conversions to tree crops (Pengra et al 2020, Woodcock et al 2020). Discontinuation (e.g. GLCF; (Sexton et al 2013)) or unexpected interruptions (JAXA Forest/Non-Forest; (Shimada et al 2014)) of EO products at equivalent spatial resolutions could have prevented their use. Note that recent studies highlight a temporal inconsistency also in the GFC product attributed to changes in the algorithm (Ceccherini et al 2021, Palahi et al 2021). Temporal inconsistencies in fact exist in all EO products, even those from the long-running Landsat programme, because of sensor degradation or sensor and technology changes between successive missions (Roy et al 2016, Vogeler et al 2018).
Temporal inconsistencies and the biases they introduce may help explain why countries are relying more on reference data, most commonly a sample dataset of visually-interpreted imagery with high spatial resolution available through the Collect Earth platform (table S2; figure 3). In the last three years 70% of the submissions used a reference dataset to estimate AD. While 40% stratified the sample with a map (including the GFC product), as recommended to reduce omission errors (Olofsson et al 2020), 30% relied only on the samples. This trend towards reduced dependency on wall-to-wall maps to derive AD can partially explain the limited uptake of EO products. The need for compliance with IPCC good practice and reporting of uncertainty may also help explain this trend. Pixel-counting methods introduce bias in the estimate from map classification errors, and the map accuracies derived from error matrices do not quantify that bias, as required by the IPCC guidelines (McRoberts 2011, Olofsson et al 2013).
Another reason for the transition in methods to derive AD is related to attribution: while land cover can be obtained from EO, and is typically used as a proxy for land-use, the two are not the same. We find countries are using sampling methods and visual interpretation of very high resolution imagery to identify complex land dynamics, and to distinguish plantations, tree crops, shifting agriculture and trees outside forest, in order to attribute these areas to the correct class according to the national land classification. Such attribution is not possible with EO products alone (Tropek et al 2014, Curtis et al 2018, GFOI 2020). For example, the Bangladesh FRL identifies that more than 50% of mapped tree canopy cover is from trees outside forest (Potapov et al 2017). Solomon Islands used Collect Earth to correct cases of harvest and replanting of oil palm (cropland) identified in the GFC as forest loss. Similarly, Guinea-Bissau manually corrected the land cover maps and noted in its FRL that 74% of the corrected pixels corresponded to cashew trees (a tree crop) being mapped as forest (Melo et al 2018). Ghana changed its AD approach from pixel-counting (in the 2017 submission) to systematic sampling (in the 2021 submission), resulting in a change in the deforestation (AD) estimate from around 312 000 to around 18 000 ha per year in the same reference period (i.e. deforestation estimate with the systematic sampling approach rendered a deforestation estimate which is only 6% of that obtained with pixel-counting). Ghana noted in its FRL that using very high resolution imagery as source of AD allowed the proper disaggregation of tree crops from forest which had led to the overestimation of the AD in the 2017 submission.
However, we note that in this transition towards sampling-based methods for deriving AD (including ‘stratified area estimate’ and ‘sampling’ in this study) the bias of the reference data is never quantified in the FRLs. Such bias can be substantial due to interpretation errors and to the temporal inconsistencies of the available imagery, given that the tropics do not have good coverage by very high resolution imagery, especially for a reference period of 10–15 years (Lesiv et al 2018, McRoberts et al 2018, Schepaschenko et al 2019, Pengra et al 2020).
4.2. Limited uptake of global biomass maps
None of the available above-ground biomass EO products were used to estimate EFs. The only ways they were used, and only in the submissions of four countries, was as independent estimates to compare and enhance the confidence in the national above-ground biomass values used to derive EFs, or, in Guyana, to adjust the national historical emission trend with a global emission level to predict future emissions more accurately. Using EO products for verification (i.e. comparing with national estimates) was the only example of implementation of the 2019 Refinement to the 2006 IPCC Guidelines, now including a section on the use of above-ground biomass EO products. Similarly to AD, when reporting the uncertainty of EFs, national teams need to document the precision of the estimates through confidence intervals. However, none of the biomass EO products from table 2, except the most recent ones using GEDI data (Dubayah et al 2022, Duncanson et al 2022), provide the required variances and covariances (GFOI 2020, McRoberts et al 2022). There are examples on how to improve the precision of NFI plot-based estimates with global EO products of above-ground biomass (Naesset et al 2016, 2020, Malaga et al 2022), but there has been no implementation of these methods in FRLs.
4.3. Regional differences in the uptake of EO products
Our study reveals a higher uptake of EO products by countries from Party groupings with lower forest monitoring capacity (African States and LDCs; figures 2 and S1) and highlights the important role of EO products in enhancing these countries’ MRV capacity. This finding is consistent with a recent study from Nesha et al (2021) on forest monitoring capacity in reporting to the FAO, where the authors conclude that despite remaining lower than in other regional groups, the remote sensing capacity of African States has increased significantly between 2015 and 2020. It also confirms that developing countries’ capacity to report GHG fluxes from LULUCF to the UNFCCC has been increasing with REDD+ investments (Federici et al 2017) (figure S1). For 80% (n = 45) of the developing countries implementing REDD+ activities, submission of the FRL was their first experience of reporting GHG fluxes from LULUCF and going through a technical review under the UNFCCC (table S3). Half of those countries (n = 22) did so while using EO products in their FRL. Furthermore, as of December 2022, there were 13 countries submitting a FRL with the support of EO products that have not yet submitted any biennial update report. The contribution of EO products can, therefore, be more prominent if the capacity built for FRLs leverages the development of GHG inventories. This is an important conclusion because strategically selecting collaborations with national teams with lower MRV capacity, who rely more on the EO products offered, will support their transition to the more stringent reporting requirements of the Paris agreement. At the same time, it contributes to a more complete global time-series of carbon fluxes obtained from the aggregation of national GHG inventories in the Global Stocktake.
4.4. Transparency of reference level submissions and limitations of the analysis
Of the 75 submissions included in our analysis, 69 have completed technical assessment. Of those, 75% (n = 52) are described by the expert reviewers in the technical assessment report as being ‘transparent and in overall accordance with the guidance’. However, the remaining submissions ranged from ‘mostly transparent’ to ‘not sufficiently transparent’, with the experts flagging the need for including more detail on the data sources and methods. The limitations of this study due to lack of transparency in at least 25% of the submissions are twofold:
- (a)
Possible underestimation of the use of EO products due to our inability to find all data sources used. For example, maps were used for stratification but were not adequately documented in the FRL submission and accompanying methodological annexes. To minimize this source of bias we assumed that the technical assessment report had priority over the FRL, given that experts have access to more information that is not publicly shared. For example, Equatorial Guinea does not clearly describe how the GFC layers ‘were superimposed over the maps to help to classify AD’ but because it is in the technical assessment report, we attributed a direct contribution of GFC in deriving AD. - (b)
Possible underestimation of the direct use of EO products to derive AD due to poor descriptions of the methods. For example, any incorrect definitions of the AD method as ‘sampling’ instead of ‘stratified area estimate’ will lead to an incorrect classification of the use of the EO product as indirect instead of direct (e.g. Myanmar, Mongolia). In our analysis, eight submissions (10%) were flagged with low confidence in the attribution of the method used to derive AD because the FRL submission was not clear or our classification disagreed with FAO analysis on REDD + FRL (FAO 2020a). Of these eight submissions, three (4%) used the GFC product. To address this uncertainty, for these submissions, we relied on personal communications with the national technical teams to attribute the method used (e.g. Nigeria, see table S2).
Analysis of the use of satellite data and derived EO products by 56 developing country parties to the UNFCCC in 75 REDD+ forest reference levels indicates that the only land EO product used was the GFC; this was used by 43% (n = 24) of the countries, with 29% (n = 16) using it directly to estimate AD. The number of countries using EO products to map burnt areas (n = 2) and to estimate emission factors (n = 0) is negligible. However, the GFC and pantropical biomass maps were used for verification (n = 9 and n = 3, respectively) by countries and expert reviewers. There is a trend towards using probabilistic sampling methods that do not rely on wall-to-wall mapping to quantify land dynamics (p < 0.001, 95%CI), which can partially explain a limited uptake of land maps. Nevertheless, overall, the availability of EO products enhances MRV capacity: 70% of LDCs and 65% of African States with FRL submissions relied on EO products, and for 22 of the countries using EO products in their submission, this was their first reviewing process under the UNFCCC. This analysis may help the EO community by clarifying the properties EO land products must have for their effective take-up by countries in their reporting for the land use sector. Fostering collaboration with experts familiar with IPCC guidance can help in the design of EO products and facilitate their integration into national reporting, and hence enable more complete GHG inventories and increase confidence in the data used by the Global Stocktake process.
JM was funded by the Natural Environment Research Council (NERC Reference NE/L002574/1) until 31 October 2022. JM acknowledges the Committee on Earth Observation Satellites (CEOS) task teams working on contributions from the AFOLU sector to the Global Stocktake and the Biomass Harmonization sub-group for the exchange of views and feedback provided. The authors thank Marieke Sandker for her contribution to the quality control of the attribution of AD method used in the submissions flagged as low confidence in our study. The authors acknowledge the constructive comments from two anonymous reviewers.
All data that support the findings of this study are included within the article (and any supplementary files).