Extending natural hazard impacts: an assessment of landslide disruptions on a national road transportation network (original) (raw)
1748-9326/12/1/014010
Abstract
Disruptions to transportation networks by natural hazard events cause direct losses (e.g. by physical damage) and indirect socio-economic losses via travel delays and decreased transportation efficiency. The severity and spatial distribution of these losses varies according to user travel demands and which links, nodes or infrastructure assets are physically disrupted. Increasing transport network resilience, for example by targeted mitigation strategies, requires the identification of the critical network segments which if disrupted would incur undesirable or unacceptable socio-economic impacts. Here, these impacts are assessed on a national road transportation network by coupling hazard data with a transport network model. This process is illustrated using a case study of landslide hazards on the road network of Scotland. A set of possible landslide-prone road segments is generated using landslide susceptibility data. The results indicate that at least 152 road segments are susceptible to landslides, which could cause indirect economic losses exceeding £35 k for each day of closure. In addition, previous estimates for historic landslide events might be significant underestimates. For example, the estimated losses for the 2007 A83 ‘Rest and Be Thankful’ landslide are £80 k day−1, totalling £1.2 million over a 15 day closure, and are ∼60% greater than previous estimates. The spatial distribution of impact to road users is communicated in terms of ‘extended hazard impact footprints’. These footprints reveal previously unknown exposed communities and unanticipated spatial patterns of severe disruption. Beyond cost-benefit analyses for landslide mitigation efforts, the approach implemented is applicable to other natural hazards (e.g. flooding), combinations of hazards, or even other network disruption events.
Export citation and abstractBibTeXRIS
The impacts of natural hazard events are typically evaluated and communicated in terms of direct physical damage to natural and built environments. Economic loss and population exposure is quantified using metrics related to a hazard’s severity (e.g. flood depth) within a ‘footprint’ (i.e. areal extent), which are combined with inventories of exposed assets and their value or population statistics (e.g. [1, 2]). There is growing interest in the study of the impacts that arise when hazards interact with transport networks [3]. Through such networks, impacts are accrued not only by direct physical damage, but also by direct perturbation to network operation (i.e. reduced access, travel delay and costlier routes). Consequently landslide hazard impact and population exposure is distributed far beyond the hazard’s physical location. Critical network segments are those characterised by a high consequence of failure generally irrespective of likelihood [4, 5]. A poignant example is the estimated £3.0 billion regional economic loss incurred in the South West, UK [6] by damage to 40 m of railway line during storm water levels exceeding previous maxima in 100 year historical records [7]. The identification of critical network segments is integrated within network management guidelines [8, 9]. However, these operational assessments are limited to road segment level indicators of for example road classification (i.e. importance) and average daily traffic flow (i.e. demand and capacity). Road network analysis and simulation offer a number of conceptual frameworks and methodologies with which to calculate wider network impacts, yet these are currently limited to theoretical studies of network structure and to urban scale networks [3, 10, 11]. National road transport networks are continuously exposed to a number of weather driven hazards [12]. There is concern that the frequency and severity of hazards, and therefore losses, may increase. This is however, subject to uncertainty in the context of future climate change [13, 14] and in the medium to long term response of physical processes (e.g. slope and soil subsidence [15, 16], flooding [17, 18] and wind storms [19]). The economic benefits of increased transport network resilience, by for example, pre-emptive intervention rather than costly remediation are well defined [20, 21]. Hence there is need for methodologies and assessments at the national scale to identify where critical network segments exist and to estimate potential economic losses at scales practical to support hazard risk management [22, 23].
The conceptual frameworks and methodologies to quantify network impacts can be broadly categorised in to those involving measures of network topology (i.e. graph theory) or system operation (i.e. travel time and cost) [3, 5, 10]. Each follows a similar basic framework to i) determine a network, ii) define a set of disruption events (i.e. hazard scenarios) and iii) evaluate the impact of each event using a defined measure [10]. In the topological approach transport networks are represented using graphs and adjacency matrices from which, link, node and network-wide measures are calculated, for example of connectivity, path length and degree [24]. The computational efficiency of these measures is advantageous in the study of uncertain disruption events by conducting a full-scan [5] of all single link disruptions (e.g. [11, 25]). However, topological measures provide only a simplistic representation of network operation. They lack consideration of the considerable effect that periodic demand and route choice can have on travel time and cost, and which develop in even moderate network flows [3, 21, 26–28]. Therefore, the severity and spatial distribution of hazard event impacts, and consequently hazard risk, are often underestimated as they vary not only in accordance with which links are physically disrupted but also with the demands and response of network users (i.e. system operation) [5, 10, 29].
The operational approach uses traffic models to simulate realistic network flows but this is at the expense of method complexity, data and computational requirements [3, 10]. Models are developed to provide the best possible representation of the period and area of concern [30, 31]. Impacts attributed to network disruption events are most pronounced during periods of peak flow (i.e. commuter times) when available network capacity to absorb displaced traffic is reduced [13, 32]. At the urban scale, studies have examined both transient and long term disruptions on traffic flow (e.g. by traffic incidents, inclement weather or bridge failure) [33–40]. At the national scale, focus has instead been on comparing the resilience of conceptual network structures [38, 41, 42] or by constraining the analysis to specific regions of interest, for example on transport corridors [32, 43] and local diversionary networks [44]. The impacts of hazards events on a national road network, and during periods of peak flow, have so far not been considered.
The United Kingdom is subject to extreme seasonal and storm events presenting geological (e.g. subsidence and landslides), flooding and severe wind hazards [16, 18, 45, 46]. During the past decade a particular issue has been landslide hazards that have caused repeated disruption to major road network in Scotland, which is here used as a case study. Landslide susceptibility data are used to define a set of possible landslide events, or ‘event set’, which contains hypothetical and/or historical events designed to represent conceivable manifestations of the hazard on the road network. The landslide events are coupled with a road network model which is used to quantify event impacts. To clarify the adopted terminology, ‘event’ (i.e. single hazard occurrence) and ‘event set’, is widely used in this way in probabilistic risk assessment, hazard analysis, and catastrophe models (i.e. in insurance) [2, 47]. This terminology is also applied in past network studies (e.g. [5, 38]), however, others also use ‘scenario’ specifically for potential hazard occurrences restricting ‘event’ to actual past occurrences [48]. At its most basic, an event set could simply be compilation of the historical occurrences of a hazard, but are commonly supplemented by physical or statistical modelling to extrapolate beyond experience to potential and extremely rare events.
The network model is constrained to a period of peak flow conditions and calculates impacts from a road user perspective (i.e. additional travel time). Economic impacts are then derived using a generalised cost value of travel time [45]. This is a national average value for the costs associated to vehicle operation, market value of user time and lost utility. The approach is consistent with national transportation planning and appraisal guidelines [45]. However, it does not capture the wider socio-economic impacts known to arise by, for example, loss of tourism and long term reductions in regional investment [46]. Therefore the impacts presented herein should be regarded as likely minimum estimates. The net additional travel time and economic impact of each event is used to rank the criticality of individual road segments. The spatial distribution of impacts is evaluated by creating a set of ‘extended hazard impact footprints’. These footprints are the spatial distribution and severity of losses incurred by road users, with loss for each user’s journey assigned to their place of origin. This allows different types of event footprint (e.g. ‘acute’ and ‘dispersed’) to be identified. Previously unidentified vulnerable populations can be identified and regional economic loss can be estimated. Recent estimates of daily economic impacts used similar network modelling techniques albeit at a local, diversionary route scale [44]. Where available, these are used as a means of validation and also to compare the results of different modelling approaches.
The method sequentially follows five steps, described in more detail below; i) establish the road network, ii) evaluate the susceptibility of the road network to landslide hazards, iii) create an event set of landslide disruptions, iv) develop a network model to simulate traffic flow, and v) measure the impact of each event.
The network includes roads classified as strategic (e.g. motorway and arterial), primary and secondary (e.g. inter-regional and regional) in mainland Scotland; roads on Islands connected by bridges are also included. Roads classified as tertiary, residential and unclassified (e.g. single lane or residential roads) are omitted and is consistent with similar studies [38, 43, 47–49]; the omitted minor roads include residential streets, cul-de-sacs and single lane tracks. The network is obtained from OpenStreetMap (OSM), the native format for the simulation software (2.4). As the OSM data is open source, its topology (i.e. connections) and attributes (i.e. speed) are validated against proprietary Ordnance Survey transport network data [50]. No topological errors were found and only a small number (24) of road speed corrections were made in order to reflect actual limits.
Areas which are susceptible to landslide activity can be determined by examining the environmental factors of past failures including superficial and bedrock geology (e.g. available failure material), geomorphology, land use and vegetation [51]. Here the susceptibility of the road network is classified (see 2.3) using the British Geological Survey GeoSure landslide susceptibility data (e.g. [32, 48, 51, 52]). GeoSure was produced using a combined heuristic and deterministic modelling of environmental and hydrological factors (e.g. soil permeability) and ∼15 000 landslide records including falls, topples, slides or flows [52, 53]. The data is supplied as polygons in 5 classes of increasing landslide susceptibility (i.e. compounding causative factors A–E; table 1) at 1:50 000 scale [54]. It is available nationwide and is widely used by insurers and infrastructure operators. This study uses categories D and E as these represent areas that are most susceptible to landslides (see table 1).
Table 1. GeoSure landslide susceptibility categories from [54].
| GeoSure category | Description |
|---|---|
| A | Slope instability problems are not thought to occur but consideration to potential problems of adjacent areas impacting on the site should always be considered |
| B | Slope instability problems are not likely to occur but consideration to potential problems of adjacent areas impacting on the site should always be considered |
| C | Slope instability problems may be present or anticipated. Site investigation should consider specifically the slope stability of the site |
| D | Slope instability problems are probably present or have occurred in the past. Land use should consider specifically the stability of the site. |
| E | Slope instability problems almost certainly present and may be active. Significant constraint on land use. |
The landslide event set is generated by conducting a susceptibility analysis, using GeoSure, of Scotland’s 4300 km strategic road network. This network is the main transport connection between regions, population centres and key infrastructure; locally termed the ‘trunk’ road network. Landslide events are defined for individual road segments (i.e. between junctions) and assume complete closure (i.e. all lanes in each direction). Events are not created on junctions (i.e. intersection or slip roads) or on primary and secondary roads (e.g. interregional and local roads). This is to constrain the scope and complexity of the study (e.g. as in [25, 48, 49, 55]) and to align with national level management of the strategic road network; all other roads are managed at the local authority level.
An event is created for each road segment found with areas of neighbouring susceptible ground. The search area is selected using two different buffer values to account for the fact that the GeoSure data does not distinguish between different landslide mechanisms. In upland regions, shallow translational slides and debris flow are the dominant failure types. Past analysis of these landslides in Scotland note that these failures most often occur on steep slopes (max ≥ 26°) and produce deposition run-out distances of up to 500 m [53, 56, 57]. Road segments in other regions are more likely to be susceptible to underlying and close proximity slope movements. A 50 m road buffer was used in recent landslide studies (e.g. [58]) in addition to assess GeoSure by UK insurance and infrastructure organisations [9, 54] and is therefore also adopted here. An event is created when segment (i) susceptibility (Si > 0) and is given by (1) and (2):
Si=αL
α=Asb/Atb
where (L) is segment length and (α) is the fraction of susceptible ground area (As, i.e. GeoSure categories D and E) to total ground area (At) within a 50 m or 500 m buffer (b). The buffer distance is set to 500 m if a road segment intersects a landscape basin with a max slope angle ≥ 26°. Landscape basins are created using the GRASS r.watershed procedure [59] using void filled 30 m SRTM data [60].
The impact of each disruption event is calculated for a single period of peak flow (i.e. the weekday morning rush hour 03:00 am to 12:00 pm) by measuring the number of trips which are delayed or displaced onto costlier routes. These are calculations are made using a network model generated using the SUMO software suite [61]. The model is an integrated micro-meso scale traffic simulation (e.g. [62]). This enables efficient computation of intersection and junction traffic patterns (e.g. which cannot be realistically modelled at the micro scale for large and complex networks), whilst also supporting micro level considerations (e.g. for individual vehicle routes) and areas of future interest (i.e. intelligent transport systems, partial road closures and multi modal transportation).
A trip assignment routine [30] is implemented to create an origin-destination matrix (OD, e.g. linking location of residence and location of work) for peak flow commuter vehicle and passenger trips using recent census data [63]. The census OD zones are provided at intermediate zone level geography for 2500–6000 residents [64]. Pragmatically, these were chosen as the data represent ∼80% of total daily trips within Scotland and are available as a consequence of the UK’s comprehensive 10-yearly census [63]. Trip data for other modes (e.g. bus, cycle and rail) are omitted as multi-modal modelling, although possible, is still in its relative infancy and bus trips are prevalent within urban areas (i.e. contribute little to inter-regional and national flows).
A user equilibrium state is established when no individual route can be further adjusted to reduce its travel cost [65] and is widely applied to model the self-optimising nature of road network traffic [30]. The network model follows the iterative procedure described in [66] to establish a user equilibrium state for the undisrupted network and for each disruption event. The undisrupted simulation is calibrated using the routine described in [67, 68] and utilises traffic count data obtained at 35 different locations on the strategic road network (data period Jan 2004 to Dec 2015) [69]. The calibration computes the normalised Root Mean Square Error (nRMSE) between the modelled and observed traffic counts and nRMSE values of 2.5%–20% are reported for the best models in [30, 68]. In addition, a sensitivity test and mean error value for each OD zone (e.g. ±3 minutes) is determined by simulating 30 disruptions on segments expected to have little effect (i.e. with no undisrupted traffic flow).
For each event the travel delay and economic impact is considered nationally and within each OD zone. Economic impact is derived using UK national average value for travel time generalised cost (i.e. the market price value of occupant time and vehicle operation). This value is used in transportation planning and appraisal [45], and in previous impact assessments [44]. The nationwide impacts (NI) are given by (3) where the generalised cost (C) is multiplied by the net increase in travel time (T) between all OD zones (o,d) in the undisrupted and disruption event simulations:
NI=∑o∑dTo,dC
The spatial distribution of impacts is illustrated in terms of extended hazard impact footprints. These footprints are constructed by aggregating the increase in travel time for trips by their zone of origin (i.e. their zone of residence).
Events that form isolated sub-networks and disconnect OD pairs are termed cut links. In the literature cut links are handled by introducing a measure for the proportion of unsatisfied demand [70, 71], setting travel time delay equivalent to the disruption duration [25], or by not fully closing segments (e.g. reducing speed 99.9%) [36]. In undisrupted network conditions a trip is made to gain some economic or social benefit. It is therefore reasonable to assume that the value of this benefit is equivalent to or greater than the cost of travel. Hence, in this study trips that are affected by a cut link are omitted from the simulation (i.e. as they have no possible route). The impact (tio,d) of these trips is calculated as equivalent to the undisrupted travel time and cost of the trip (tuo,d); for instance if a trip has duration 30 minutes in undisrupted conditions (tio,d) and is then disrupted by an event which creates a cut link, its impact is +30 minutes (tio,d).
A total 152 road segments were identified as susceptible to landslide activity, representing 34% of the strategic road network (i.e. 1500 of 4300 km and illustrated by orange and red roads in figure 1(a)). The majority (127) of the susceptible roads, and therefore events, are situated in the central and west highlands (i.e. around 57° north) and are neighbouring steep slopes (i.e. ≥26° and with a 500 m buffer as in figure 1(b)).
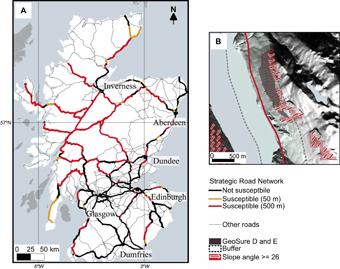
Figure 1 (a) A map of Scotland showing the strategic road segments which are susceptible to landslide hazards. Susceptible roads are highlighted to indicate the buffer distance used orange (50 m) or red (500 m). (b) Illustrates a single susceptible road segment with a 500 m buffer (dashed black line), area of GeoSure landslide susceptibility indicator (grey area) and areas where the terrain slope angle is ≥26° (red shading and arrows).
Download figure:
Standard imageHigh-resolution image
The network model calibration nRMSE is 0.12% (i.e. within 2.5%–25% recommended in [68]) and the sensitivity test returned OD zone error values of max ± 7 minutes and with an average ±1 minutes (section 2.4). The model is therefore considered stable and minimum values are given in the remainder of this article. For each landslide event the nationwide impact (NI) is calculated and used to rank the criticality of each road segment (i.e. rank 1–6 in table 2); higher NI values indicate the net increase in travel cost (as a function of time) and reduced network efficiency. The NI values for all of the events (n = 152) are summarised in the distribution presented in figure 2. The event impacts follow an asymmetrical distribution with mean NIμ = £56k per day of disruption. The NI distribution is positively skewed by 6 events incurring relatively extreme impacts (i.e. with NI > NI_μ_ + 2_σ_) and are annotated in figures 2(a) and (b).
Table 2. Event impacts (rank 1–6) on strategic road segments. The segments are displayed spatially in figure 2(a).
| Rank NI | £k | Description | Approx. coordinatesa |
|---|---|---|---|
| 1 | 129 | A830 Fort William to Glenfinnan | 56.855, −5.229 |
| 2 | 128 | A9 Dalwhinnie to Calvine | 56.814, −4.127 |
| 3 | 116 | A90 Queens Ferry Road | 55.964, −3.316 |
| 4 | 97 | A82 Corran to Fort William | 56.759, −5.184 |
| 5 | 94 | A82 Achallader to Glencoe | 56.636, −4.809 |
| 6 | 84 | A82 Fort William to Inverlochy | 56.821, −5.094 |
aCoordinates are given for the approximate centre of each road segment in WGS 1984.
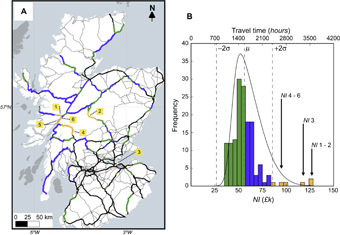
Figure 2 (a) A map of Scotland showing the location and net economic impact of susceptible road segments ‘events’. The road segments are shaded according to their impact severity and correspond with the colours of a skewed histogram in (b) Annotations highlight the location of extreme events (NI 1–6). In (a) the strategic road network is represented as a thick black line and a thin black line displays all other roads in the network.
Download figure:
Standard imageHigh-resolution image
The spatial distribution of event impacts is examined through extended hazard impact footprints. Each footprint is the area in which road users whose journeys’ are affected by a disruption event originate, with darker shading indicating more travel delay and cost; given that the journeys examined here are for commuting, this is also where the road users live. Figure 3 displays the impact footprints for the most extreme events (i.e. _NI_1 to _NI_6 and which are displayed spatially in figure 2(a)), in which impacts are shown to generally fall within the zone(s) that are in close proximity to the disrupted road segment. However, the impact footprints also highlight affected regions and communities that are positioned far from the landslide location. A notable, albeit qualitative, inference is that impact footprints may be either spatially dispersed or acute. The events _NI_2, _NI_3 and _NI_5 feature a zonal impact <5 £k in any single origin zone (e.g. equivalent to an average increase of 4 minutes per trip) and the footprint of impacts is relatively dispersed across a large number of zones. In contrast, several event impact footprints exhibit a focussed, acute impact within certain affected zone(s). This is most extreme in events _NI_ 1, _NI_ 4 and _NI_ 6 which feature zonal impacts >10 £k (e.g. equivalent to an average increase of 65, 60 and 35 minutes per trip in the darkest shaded zones; figure 3).
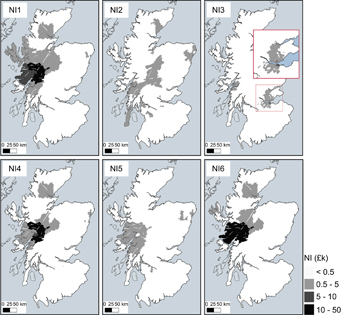
Figure 3 Hazard impact footprints for landslide events NI 1–6.
Download figure:
Standard imageHigh-resolution image
In figure 4(a), a combined severity footprint is constructed by taking the sum of the impact footprints created for each of the 152 events. This shows the zones in which road users are typically most exposed to transportation delay and cost imposed by disruptions on roads susceptible to landslide hazards. The impacts are focused to the central and north-west of Scotland, and away from the major urban centres (e.g. Glasgow, Edinburgh and Aberdeen). Figure 4(b) shows the distribution of known landslides per zone and which are recorded in the British Geological Survey landslide database [53]. There is a general association between the zones which feature both high impact and high numbers of landslides. However, only 6.5% of the road users reside within the zones which feature landslides whereas 25% reside within zones with high impacts (i.e. NI > 10 £k). This disparity reveals how the interactions that occur within the transportation system (i.e. between user demand, network topology and road capacity) disperse and inflict hazard impacts far beyond a hazard’s physical location.
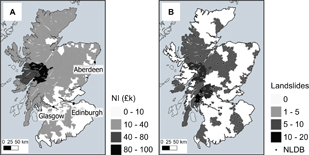
Figure 4 (a) Severity footprint displaying the sum impact (NI £k) of each event impact footprint where darker shading of zones indicates higher impacts. (b) The number of known landslides within each zone is indicated by grey shading; landslides are recorded in a national landslide database [53]. The difference in shaded areas, between (a) and (b), reveals how hazard impacts are distributed by the transportation system.
Download figure:
Standard imageHigh-resolution image
A national study of landslides was conducted following severe storms and widespread transport disruption that occurred in August 2004 and then again in October 2007 [56]. The study reports on the direct economic impacts of the landslides (i.e. cost of emergency response and engineering works), and an assessment of indirect economic impacts (i.e. delay to traffic) was made by Winter et al [44]. These indirect economic impacts were also calculated using the national generalised cost values [45] and the user equilibrium principle used in this study (section 2.4 Network model). Crucially however, the model used by Winter et al [44] was the ‘queues and delays at roadworks model’ (QUADRO [72]), and for which traffic flow is constrained to a limited set of prescribed diversionary routes; whereas the approach used in this study enables traffic to utilise the entire road network. Table 3 compares these assessments to the results of this study. The economic impacts by delays to traffic are typically increased (A83 Cairndow by 17%, A83 RABT by 63% and A85 Glen Ogle by 65%). Only the A9 Dunkeld event saw a decrease (−56%). This is thought to be the result of the prescribed QUADRO diversionary routes, and although these are not given in [73], external reports note that the A9 diversions were established along a 132 km route via Aberdeen [74]. In contrast the SUMO model would enable trips to take shorter routes via the local primary and secondary roads of 25–80 km.
Table 3. A comparison of the indirect economic impacts caused by four historic landslide events and calculated using the QUADRO [44] and SUMO road transport models; text within the brackets describes the road segment between settlements or intersections with other roads. The date of failure, duration in days, emergency response cost (ER £k) and engineered costs (Eng. £k) are reported from [56]. ‘NI Rank’ is the rank impact of the event in relation to the 152 other events examined in this study. The economic impacts are reported per day of disruption (£/day) and for the duration of the road closure (£ total).
| | A83 Cairndow (B828 to A815) | A9 Dunkeld (B898 to A827) | A85 Glen Ogle (Lochearnhead to A827) | A83 Rest and Be Thankful (Arrochar to B828) | | | | | | | ------------------------------ | ------------------------- | ------------------------------------ | ------------------------------------------- | ---------- | ------------ | ---------- | ------------ | ----- | | Date | 09/08/2004 | 11/08/2004 | 18/08/2004 | 28/10/2007 | | | | | | Duration | 2 | 2 | 4 | 15 | | | | | | ER (£k) | £300 | £700 | £500 | £270 | | | | | | Eng. (£k) | — | — | — | £1 156 | | | | | | | £k/day | £k total | £k/day | £k total | £k/day | £k total | £k/day | £k total | | | QUADRO | 47 | 94 | 150 | 300 | 40 | 160 | 49 | 735 | | SUMO | 55 | 110 | 65 | 130 | 66 | 264 | 80 | 1 200 | | NI Rank | 71 | | 27 | | 23 | | 10 | |
The network susceptibility analysis indicates that a large proportion (34%) of the strategic road network is susceptible to landslide hazards. The selection includes road segments with no known history of failure in addition to previously identified landslide prone corridors (e.g. the A82, A83, A85 and A9 in figures 1–2 and table 2) [56]. The method is applicable to other linear infrastructures (e.g. rail or transmission lines), and also to regions which feature other slope failure mechanisms (e.g. shrink swell [75] or compressible ground) using additional GeoSure layers. The GeoSure data indicates areas which feature environmental factors that are associated with known landslide activity. This makes it a suitable indicator of the present day hazard potential. It is currently uncertain how several factors driving landslide activity, including vegetation cover and superficial material strength, will respond to long term seasonal cycles as climate changes [16, 76]. It is therefore uncertain to what degree future landslide activity is reflected in the GeoSure data. Nonetheless this network landslide susceptibility analysis is a first attempt using GeoSure to classify road network landslide susceptibility at the national scale.
The impact of each event is first expressed in terms of nationwide, Scottish economic impact from road user travel delay (figure 2). Events which incur the greatest nationwide impact (i.e. NI 1–6 in table 2) include both road segments subject to repeated past failure [56] and those with no known history of failure. Detailed records of regional landslide activity are limited to within recent decades [53], but there is recent anecdotal validation of GeoSure. Illustratively, whilst preparing this article a small landslide, the first known recorded incident, closed the A9 road at Helmsdale which has been selected as susceptible and with a potential to cause significant disruption to commuter traffic (_NI_7); fortunately no widespread traffic disruption was reported as the event took place and was cleared overnight [77]. The results thus demonstrate a first worked example, and the importance of segment criticality considerations [3, 5] in transport network hazard management.
As far as these authors are aware, this is the first use of national OD data to calculate landslide hazard impacts on a complete national-scale road transportation network. This approach is applicable to the study of other hazards and UK regions, in addition to territories with comparable OD data (e.g. Eurostat, US census bureau and the Australian bureau of transport statistics). It is stressed that the impacts presented herein should be construed as potential minimum estimates. Network trips are computed to user equilibrium conditions in which routes are chosen to minimise travel time and cost. User equilibrium is analogous of a best case user response (e.g. equivalent to some modern day navigation systems), whereas in reality there is often a degree of user uncertainty for the best route during a network disruption [11, 31, 40]. In addition, economic impacts are derived by multiplying additional travel time with a national average value for road user generalised cost. Calculating the full extent of a hazard event’s economic impact is non-trivial as they are determined not only by travel delays but also by short and long term socio-economic interactions (i.e. reduced investment in hazard prone areas) [44], which are beyond the scope of this study. Nonetheless it is demonstrated that landslide events may cause substantial losses by means of user travel delay alone. Network impacts therefore represent a significant proportion of the net impact of a hazard and therefore contribute to landslide risk. However, these are not routinely considered in state of the art hazard risk assessment. The method and results of this study may therefore be used to conduct a more complete assessment of landslide hazard risk, and such investigations are planned by these authors. It is expected that these assessments will be of interest to infrastructure operators who must evaluate and justify mitigation expenditure on a cost benefit basis [78].
The extended impact footprints (figure 3) illustrate that impacted zones (e.g. affected road users) are often and unexpectedly situated at distance to the disrupted road segment. Event impact footprints are found which are either acute (i.e. impacts are focussed to a small number of zones) or dispersed (figure 3). The acute impacts are explained by network topological characteristics; for instance the lack of equivalent length alternative routes [79]. Dispersed impact footprints reveal unexpected and previously unidentified impacted communities which comprise a significant part of the national impact. The dispersal of impacts is attributed to long distance trips adopting circuitous routes to avoid disrupted links and the cascading effect of re-routing of traffic onto alternative routes, subsequently increasing travel time and displacing further traffic. The combined severity footprint indicates that the Central and North West regions of Scotland are most exposed to the potential impacts of landslide disruptions on the strategic network (figure 4).
Comparing assessments made using different scale network models (e.g. diversionary route specific and network wide) offer a qualitative means for model validation, as common in other fields (e.g. [80]). Where comparisons are available, the impacts are typically found to be 20%–65% greater than previous estimates (table 3). The undisrupted network model is constructed and validated using long term automatic traffic count data (section 2.4). Attempts to validate disruption event simulations using this data were unsuccessful due to i) scarcity and missing data, ii) the short duration of captured disruption events (e.g. not during peak flow), and iii) unknown additional factors influencing traffic flow including roadworks, severe rainfall and flooding. These techniques are likely feasible on other networks (e.g. with dense urban monitoring) and as data from connected vehicles and intelligent infrastructure systems become more prevalent. For future hazard impact assessments these comparisons demonstrate the importance of methodological considerations of network model inputs and scale, in relation to expected hazard impact characteristics (e.g. timing, duration and spatial influence).
Currently, indirect hazard impact assessments and the identification of critical links is limited to conceptual and urban networks [35, 36, 39, 41], and there is a need to develop this knowledge at wider scales [3, 5, 8] to address the threats and challenges posed by climatic change [12–14, 16, 23, 32]. This study demonstrates an assessment of the indirect impacts of landslide hazards on a national road network. It enables the identification of critical road segments which are susceptible to landslide hazards, and to examine the how disruption impacts are spatially distributed amongst the network users.
The study raises several interesting areas for future research. Of particular interest to these authors are first, to investigate how environmental factors, thus susceptibility indicators and network segments, may develop in response to medium and long term climatic change [16, 75]. Second, to examine present day and future landslide failure return periods to estimate expected annual losses (NI) and its spatial distribution amongst zones (i.e. creating a probabilistic event set that includes all plausible events, as is done to model risk for insurance purposes in ‘catastrophe models’ (e.g. [1, 2, 81]). Third, to explore how the severity and distribution of impacts varies when considering other hazard phenomena (e.g. flooding and severe wind storms), simultaneous network disruption, and the inclusion of other network users and modes of transport.
The authors would like to acknowledge the British Geological Survey and Landslides team for access to GeoSure and the SUMO community for assistance with the network simulation. This work was supported by the Natural Environment Research Council [grant number 1401793].
Citation de l'article: Benjamin Postance, John Hillier, Tom Dijkstra, Neil Dixon, Extending natural hazard impacts: an assessment of landslide disruptions on a national road transportation network, 0, (2016)