The untold story of missing data in disaster research: a systematic review of the empirical literature utilising the Emergency Events Database (EM-DAT) (original) (raw)
1748-9326/18/10/103006
Abstract
Global disaster databases are prone to missing data. Neglect or inappropriate handling of missing data can bias statistical analyses. Consequently, this risks the reliability of study results and the wider evidence base underlying climate and disaster policies. In this paper, a comprehensive systematic literature review was conducted to determine how missing data have been acknowledged and handled in disaster research. We sought empirical, quantitative studies that utilised the Emergency Events Database (EM-DAT) as a primary or secondary data source to capture an extensive sample of the disaster literature. Data on the acknowledgement and handling of missing data were extracted from all eligible studies. Descriptive statistics and univariate correlation analysis were used to identify trends in the consideration of missing data given specific study characteristics. Of the 433 eligible studies, 44.6% acknowledged missing data, albeit briefly, and 33.5% attempted to handle missing data. Studies having a higher page count were significantly (p < 0.01) less prone to acknowledge or handle missing data, whereas the research field of the publication journal distinguished between papers that simply acknowledged missing data, with those that both acknowledged and handled missing data (p < 0.100). A variety of methods to handle missing data (n = 24) were identified. However, these were commonly ad-hoc with little statistical basis. The broad method used to handle missing data: imputation, augmentation or deletion was significantly (p < 0.001) correlated with the geographical scope of the study. This systematic review reveals large failings of the disaster literature to adequately acknowledge and handle missing data. Given these findings, more insight is required to guide a standard practice of handling missing data in disaster research.
Export citation and abstractBibTeXRIS
In recent decades, the frequency and intensity of disaster events have increased, owed partly to the effects of rapid urbanisation and climate change [1]. The occurrence of devasting, compounded disaster events was evident in 2022; the first ‘triple dip’ La Niña event of the 21st Century induced a series of cascading extreme weather events worldwide. Notably, the 2022 Pakistan floods, which alone caused 1739 deaths and affected 33 million people [2]. In 2023, earthquakes affecting much of Turkey and Syria further brought to the forefront the threat of disasters attributed to natural hazards. Accordingly, increased urgency granted to the research of, preparedness to and mitigation of natural hazards will ensue. Endeavouring to mitigate disaster risk and conjointly meet the goals set out in the Sendai Framework [3] and Paris Agreement [4] will require a robust, reliable evidence base to inform appropriate decision-making. Nevertheless, the reliability of the current evidence base can be contested.
Data gaps, termed missing data, are commonplace across real-world datasets including disaster databases [5–7]. Missing data within a disaster database may be due to numerous reasons, including technological limitations in the surveillance of disaster events, methodological difficulties quantifying their impacts and inconsistent disaster reporting across and within countries [8, 9]. However, missing data are commonly overlooked, even when guidance concerning its handling is stipulated [10–12]. Neglect or inappropriate handling of missing data can subject statistical analyses to bias and risk the reliability of study results, particularly if the likelihood of data being missing is dependent on observed or unobserved characteristics of the disaster event [13, 14]. Rubin [15] classifies such mechanisms of missing data as missing at random (MAR) or missing not at random respectively.
Methods to handle missing data can be broadly categorised as imputation, augmentation and deletion [16]. A thorough discussion of missing data methods can be found elsewhere, see [17–20]. Imputation involves the ‘filling-in’ of data gaps to generate a complete dataset and relies on a missing data mechanism of MAR [16]. Augmentation methods do not explicitly substitute missing data. Instead, these methods make underlying assumptions regarding the distribution of missing data given the observed data, during parameter estimation [16]. Conversely, deletion methods exclude missing data before analysis. Deletion methods are generally considered inferior to imputation and augmentation methods [16, 19].
The deletion of missing data by a method termed complete case analysis (CCA) is standard practice in empirical research [12, 21–23]. With CCA, complete observations are excluded if data on at least one variable of interest are missing. However, this can result in a substantial loss of information, reducing the representativeness of the dataset. For example, assuming a dataset of 15 variables, CCA could lead to a loss of 75.7% of the sample if missing data constituted 9% of the dataset and occurred uniformly throughout 4 . In addition, deletion methods generally pose a high risk of bias, unless missing data are missing completely at random (MCAR). That is, their probability to be missing is independent of observed and unobserved data [14].
Missing data in disaster databases are unlikely to be MCAR. Jones et al [7] found that the year of a disaster event, income status of the affected country and disaster type were all significant predictors of missingness within the Emergency Events Database (EM-DAT), an established disaster database with global coverage. The same study also raised doubt over the appropriate consideration of missing data in pivotal disaster literature. In this paper, we extend this work by undertaking a systematic review of quantitative, empirical studies utilising the EM-DAT to determine how missing data have been acknowledged and handled in the disaster literature more widely.
This systematic review was conducted according to the Preferred Reporting Items for Systematic Reviews and Meta-Analyses (PRISMA) guidelines [24]. A review protocol was registered prospectively in the international database PROSPERO (CRD42022303757).
2.1. Eligibility criteria
There are six disaster databases with global coverage: EM-DAT [25], NatCatSERVICE [26], Sigma [27], GLIDE (https://glidenumber.net/glide/public/search/search.jsp), GFDRR [28] and BD CATNAT Global [29]. In this paper, we sought studies employing EM-DAT as a primary or secondary data source. Since its conception in 1988, EM-DAT has been exploited extensively in the empirical literature, across multiple disciplines [30]. This is partly due to its public availability and having an established reputation. Accordingly, we focused on EM-DAT as a starting point to capture an extensive and representative sample of the disaster literature.
Published, full-text papers including journal articles, reports and book chapters were included in the review. No language restrictions were imposed. If papers were written in a language other than English, online translation tools were used and full-texts were reviewed to reduce the risk of missing non-searchable ligatures. Only those papers which were deemed to be empirical and quantitative were considered eligible. Qualitative studies were excluded to prevent potential selection bias; the risk of bias due to missing data is negligible with qualitative analysis and thus, there is minimal reason to consider missing data.
2.2. Data sources
Electronic database searches were carried out on 17 Janruary 2022 by two reviewers (RLJ and AK) independently. The electronic databases included EconPapers (RePEc), EconLit (Ovid), EMBASE, Global Health Database (EBSCOhost), Google Scholar, JSTOR, MEDLINE (PubMed), Web of Science, Scopus and The Cochrane Library. A ‘snowball’ search of bibliographies was conducted to identify additional, eligible studies. Due to the magnitude of the literature search, electronic database searches were not updated before the final data analysis.
2.3. Search strategy
Key search terms were limited to the ‘Emergency Events Database’ and its related nomenclature to prevent over-restricting the search results. This included ‘EM-DAT’, ‘EMDAT’, ‘Emergency Events Database’, ‘International Disaster Database’ ‘OFDA’ and ‘CRED’. Search results were filtered by publication date: 1990–2022.
2.4. Selection process
To assess the suitability of the eligibility criteria, a preliminary 5% sample of search results was examined by all reviewers independently (triple screening). Inconsistencies in the application of the eligibility criteria were discussed until a consensus was reached. A second preliminary 5% sample was then examined by all reviewers independently to assess convergence. The remaining papers were assessed by two reviewers (RLJ and AK) (double screening), first by titles and abstracts, and then through a screening of full texts. Any discrepancies in the decision to include or exclude a paper were first discussed among the two reviewers (RLJ and AK) and if no consensus was reached, the third reviewer (ST) was consulted.
2.5. Data collection
Data were extracted from each eligible study using a pre-specified data extraction form held on Microsoft Excel. Two reviewers (RLJ and AK) were responsible for data extraction. A 5% sample of studies was reviewed independently by both reviewers to identify any discrepancies in data extraction. If a consensus could not be reached between the two reviewers, the third reviewer (ST) was consulted.
Data were extracted on: study identifiers (authors, study title, publication year and publication source); page count; study overview; use of EM-DAT data, including the period the data spanned; the consideration given to missing data; and the method employed to handle missing data. Qualitative data on the consideration of missing data were extracted verbatim to prevent information from later being misconstrued. If no information were available, this was taken to mean that missing data was neither acknowledged nor handled.
2.6. Data synthesis
Data that were extracted on the consideration of missing data, were analysed by descriptive and univariate correlation analysis. All statistical and graphical analyses were conducted in Microsoft Excel or STATA version 17.0. Figure 1 depicts the order of descriptive analysis, highlighting which studies were included at each stage.
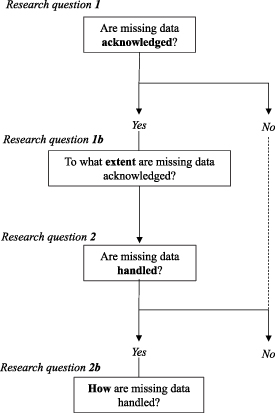
Figure 1. Flowchart depicting the inclusion steps of eligible studies for analysis.
Download figure:
Standard imageHigh-resolution image
If EM-DAT was not the primary or sole data source of an empirical analysis, missing data might be addressed in relation to an alternative dataset, or more generally. For this reason, all cases where missing data had been considered, within EM-DAT or otherwise, were analysed.
Missing data can be bracketed within issues of data quality and data availability, as might limitations in data collection, reporting bias and misreporting. Because of this, we first classified what was being acknowledged: data availability, data quality, data collection, data (in)completeness or missing data (either explicitly, or inexplicitly). From this, we identified a subsample of studies deemed to acknowledge missing data. This included studies that: referred to missing data, or data (in)completeness explicitly; or inexplicitly referred to missing data using alternative taxonomy, but with clear insinuation of missing data.
The extent missing data were acknowledged varied across eligible studies. Accordingly, meticulous inspection of full-text papers was necessary to identify all cases of acknowledgement. We categorised the extent of acknowledgement as: brief, moderate or comprehensive. Brief acknowledgement was defined as: missing data acknowledged in one to two sentences and/or confined to footnotes or figure/table legends. Moderate acknowledgement denoted a more in-depth discussion related to either the limitations, potential consequences and/or handling of missing data. Comprehensive acknowledgement was defined as a thorough discussion of the aforementioned topics, as well as a diagnosis of the patterns and/or mechanisms of missing data.
Studies that inadvertently handled missing data were classified as having not handled missing data. In these cases, it could be inferred that missing data had been handled, yet a conscious effort to do so could not be identified.
2.6.1. Correlation analysis
To assess whether certain study characteristics were associated with the acknowledgement and/or handling of missing data, we performed a univariate correlation analysis. Multivariate correlation analysis and logistic regression analysis were precluded by inadequate sample sizes.
Univariate correlation analysis was performed separately across four outcome variables of interest and a set of study characteristics. The four outcome variables included: (1) acknowledged (1 if missing data had been acknowledged, 0 otherwise); (2) handled (1 if missing data had been handled, 0 otherwise); (3) acknowledged and handled (1 if missing data had been acknowledged and handled, 0 if missing data had been acknowledged, but not handled); and (4) method, a nominal variable denoting the broad missing data method employed and comprising: imputation, augmentation, deletion or combination. The category ‘combination’ was coined due to several studies employing at least two of the three broad missing data methods.
Table 1 describes the study characteristics analysed against the four outcome variables. Study characteristics were pre-selected based on a screening of the literature. The variable page count was log-transformed to reduce the influence of potential outliers. During robustness checks quartiles of page counts were also tested.
Table 1. Set of study characteristics to be assessed by univariate correlation analysis.
| Study characteristic | Description |
|---|---|
| Publication year a | Discrete variable ranging from 1990–2022. |
| Page count b | Continuous log-transformed variable, denoting the number of pages of the published paper. |
| Descriptive | Dichotomous variable taking value 1 if the study performed a primarily descriptive analysis and 0, if the study performed more advanced statistical methods. |
| Multi-country | Dichotomous variable taking value 1 if the geographical scope of the analysis was not restricted to a single country and 0 otherwise. |
| Pre-1970s | Dichotomous variable taking value 1 if the study utilised data, from any source, from before the year 1970. |
| Research field | Nominal variable denoting the research field affiliated to the publication journal, comprising: Economics, Engineering, Health Sciences, Natural Sciences, Political Sciences, Other Social Sciences and multidisciplinary journals. |
| EM-DAT data | Nominal variable denoting the type of data studies acquired from EM-DAT, comprising: frequency of disaster occurrence alone; economic and human losses; human losses, without economic losses; or economic losses, without human losses. |
aPublication year exhibited a left-skewed, negative distribution, yet it could not be appropriately transformed. bPage count exhibited a right-skewed, positive distribution and thus, was log-transformed to better resemble a normal distribution.
Correlation tests were chosen according to the types of variables analysed: continuous, discrete, dichotomous or nominal. Tetrachoric correlation was used to test the strength of the association between two dichotomous variables (STATA command: ‘tetrachoric’ [31]). Cranmer’s V correlation was used to test the strength of association between a dichotomous and nominal variable, or two nominal variables (STATA command: ‘tab, V Chi2ʹ [32]). Point-biserial correlation 5 was used to assess the strength and direction of the association between a dichotomous and continuous, or discrete variable (STATA command: “esize twosample, all” [33]). Point-biserial correlation coefficients were reported along with Cohen’s d and Hedges’ g standardised mean difference effect sizes. Bootstrap analysis of 1000 iterations was performed to obtain p-values of statistical significance for Cohen’s d and Hedges’ g effect sizes. For each correlation test, we interpreted effect sizes and statistical significance (p-values) separately.
Of the initial 2127 search results, 417 full-text papers were deemed to meet the inclusion criteria following title, abstract and full-text screening (figure 2). An additional 16 eligible studies were identified from bibliographic searches, resulting in 433 studies included in the analysis (supplementary material). Major reasons for exclusion were: the article did not utilise EM-DAT as a primary or secondary data source (n = 730) or the article was neither empirical nor quantitative (n = 533).
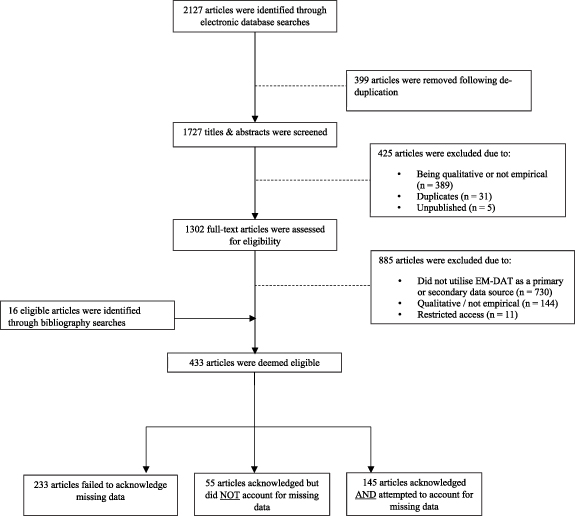
Figure 2. PRISMA flowchart outlining study selection.
Download figure:
Standard imageHigh-resolution image
Eligible studies had a publication year ranging from 1997 to 2022, yet most studies (77.4%) were published more recently, between 2013 and 2021. Although this could infer an increase in the utilisation of EM-DAT data in the empirical literature over time, it could also indicate a general growth in the volume of empirical studies published over this period. Nonetheless, the utilisation of EM-DAT data across research fields has expanded since 1997 (figure 3). Most studies in this systematic review were sourced from journals affiliated with Natural Sciences (28.2%) Economics (25.4%) or sourced from multidisciplinary journals (24.3%).
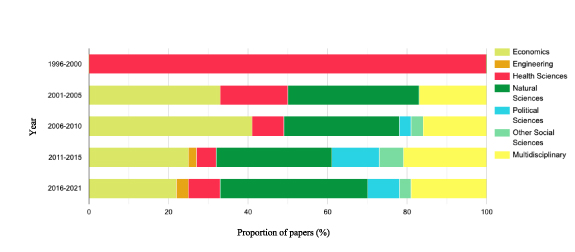
Figure 3. Distribution in the utilisation of EM-DAT across research fields. Reproduced with permission from [30]. [Centre for Research on the Epidemiology of Disasters].
Download figure:
Standard imageHigh-resolution image
Eligible studies had a page count ranging from 4 to 148 pages, with a median page count of 19 pages. Most studies (85.2%) performed advanced quantitative analyses, beyond solely descriptive analysis. In addition, most studies conducted a multi-country analysis (76.0%) compared to a single-country analysis. Studies most commonly acquired data on human losses from EM-DAT (35.3%). A smaller proportion of studies acquired EM-DAT data solely on disaster occurrence (27.7%) or on both human and economic losses (27.3%). Conversely, only 9.7% of studies utilised EM-DAT data on economic losses, without also acquiring data on human losses.
3.1. Acknowledging missing data
It is customary for data availability or data quality to be specified as a limitation of empirical studies. Nevertheless, broad reference to data availability or data quality neglects the specificity required to evaluate the potential implications of missing data. A total of 47 studies (10.9%) acknowledged data availability or data quality broadly, without clear insinuation of missing data. In contrast, 44 studies (10.2%) acknowledged missing data inexplicitly, but with clear insinuation of missing data. A further 156 studies (36.0%) acknowledged missing data or data (in)completeness explicitly. This gave 200 studies that were deemed to acknowledge missing data.
Of these 200 studies, 125 (62.5%) acknowledged missing data briefly. These studies simply acknowledged the presence of missing data or cited missing data as the cause of a reduced sample size during statistical analysis. Otherwise, 52 studies (26%) acknowledged missing data in moderate detail and 23 studies (11.5%) in comprehensive detail, also diagnosing potential patterns or mechanisms of missingness.
3.2. Handling missing data
Of the initial sample, a total of 145 studies (35.6%) attempted to handle missing data. An additional 49 studies handled missing data inadvertently, whereas three studies failed to specify the approach taken. These studies were excluded from the aforementioned total. We identified 24 different approaches to handling missing data in the disaster literature. Table 2 reports the frequency each approach was employed, whether in isolation or conjunction with another approach. Approximately a third (33.1%) of studies (n = 48) used multiple approaches to handle missing data in conjunction.
Table 2. Missing data methods identified in quantitative, empirical studies utilising EM-DAT data.
| Method | Classification | Description | Frequency |
|---|---|---|---|
| Excluding observations ad-hoc | Deletion | Excluding select observations, or groups of observations in an ad-hoc manner. | 30 |
| Complete case analysis (CCA) (Listwise deletion) | Deletion | Excluding observations with missing data on at least one variable of interest. Also referred to as row deletion. | 27 |
| Supplementing with other data sources | Imputation | Filling data gaps with data from alternative sources either manually, or by merging data sources. | 27 |
| Restricting the scope of analysis | Deletion | Restricting the geographical or temporal scope of the analysis based on data availability. | 23 |
| Imputation (unspecified) | Imputation | Imputing missing data to generate a complete dataset. | 15 |
| Aggregating observations | Deletion | Compiling and expressing individual-level data into summary forms for statistical analysis. | 11 |
| Column deletion | Deletion | Deleting variables which have a high proportion of missing data. A threshold of greater than 60% missing data is commonly suggested. | 8 |
| Interpolation | Augmentation | Estimating missing data values based on a known range of discrete, observed data points. | 8 |
| Zero-value imputation | Imputation | Treating all missing data as true zero values and substituting accordingly. A type of single imputation. | 7 |
| Available case analysis (ACA) (Pairwise deletion) | Deletion | Utilising all observed data points for each variable, or pair of variables, to calculate sample ‘moments’ (population mean, variance, etc.). Sample moments are then included in data analysis in place of population parameters. | 5 |
| Mean imputation | Imputation | Substituting all missing data with a single unconditional mean of the observed values. A type of single imputation. | 5 |
| Multiple imputation | Imputation | Creating several, plausible datasets, each containing a different, imputed value for all missing data. The results from each dataset are then combined to generate a single set of parameter estimates and standard errors. | 4 |
| Extrapolation | Augmentation | Estimating missing data values based on an unknown range of discrete data points. | 3 |
| Imputation (Last observation carried forward) | Imputation | Substituting missing data with the value of the previously observed observation. | 2 |
| Machine learning | Augmentation | Employing machine learning algorithms that are robust to missing data, or by incorporating missing data methods into machine learning models. | 2 |
| Maximum likelihood estimation | Augmentation | Using all observed data to generate the parameter estimates that are most likely to result from the data. | 2 |
| Median imputation | Imputation | Substituting all missing data with the median of the observed values. A type of single imputation. | 2 |
| Regression-based imputation | Imputation | Substituting all missing data with a value predicted from regression analysis conditional on any observed predictors of missingness. A type of single imputation. | 2 |
| Oversampling | Augmentation | Introducing new or cloned data points in the [minority] class with the fewest observations to rebalance the dataset. | 1 |
| Bayesian analysis | Augmentation | Treating missing data as additional, unknown variables for which posterior predictive distributions can be calculated. Requires a missing data model and Bayesian priors to be specified. | 1 |
| Hot-deck imputation | Imputation | Substituting each missing value with a plausible value observed for similar observations within the same classification. | 1 |
| Imputation (next available) | Imputation | Substituting all missing data with the value of the next observed observation. A type of single imputation. | 1 |
| Linear trend exponential smoothing | Augmentation | Creating a forecast of unobserved data from a moving average of observed time-series data. | 1 |
| Weighting (unspecified) | Augmentation | Applying weights to observations with complete information so they better represent the entire dataset, including excluded, incomplete observations. | 1 |
| 190 |
Ad-hoc exclusion of incomplete observations, or groups of observations, was the most common approach to handling missing data (n = 30). This differed from CCA as exclusion criteria were less systematic and a complete dataset was not generated. The use of alternative data sources to impute missing values was the second most frequent approach (n = 27). It is likely that this is due to a plethora of local, regional, national and global disaster databases that exist. Missing data within EM-DAT were commonly supplemented with data acquired from the Dartmouth Flood Observatory (DFO), Natural Hazards Assessment Network or reinsurance companies (Swiss RE’s NATCAT and Munich RE’s Sigma). Other common approaches were: CCA (n = 27) and restricting the analysis (n = 23) either by geographical scope or by period. Robustness checks were conducted by 16 studies to assess the effect of missing data on study results.
3.3. Correlation analysis
To identify potential predictors of whether a study acknowledged or handled missing data, we conducted a univariate correlation analysis. The results are displayed in table 3. Page and word count restrictions imposed by journals were hypothesised to impede authors from adequately considering missing data. In contrast, we found that studies with a higher page count were significantly (p < 0.010) less prone to acknowledge or handle missing data. Studies that acknowledged or handled missing data had a (log) page count 0.302 standard deviations (SD) and 0.332 SD lower than studies that did not. Since we took the logarithm of the variable page count, these results were robust to outliers. In addition, we did not observe any change in results when page count quartiles were used instead.
The research field of the publication journal significantly (p < 0.100) distinguished between studies that simply acknowledged missing data from those that acknowledged and handled missing data. Studies that both acknowledged and handled missing data were primarily sourced from journals affiliated with Natural Sciences (29.7%), interdisciplinary journals (25.5%) or journals affiliated with Economics (23.5%).
The missing data method employed by a study was significantly (p < 0.010) associated with the geographical scope of the analysis. Studies performing a multi-country analysis most commonly employed a deletion method to handle missing data, whereas studies performing a single-country analysis were just as prone to employ an imputation method.
Handling missing data has become increasingly accessible due to the incorporation of advanced missing data methods in conventional statistical software. However, we found no association between the publication year of the study and any of the outcome variables assessed. In addition, we found no association between the type of EM-DAT data utilised; if studies performed advanced quantitative methods, beyond descriptive analysis; nor if studies utilised pre-1970s data, which is considered inferior in quality and completeness versus more recent data [34–38].
Escalation in the frequency and intensity of disasters attributed to natural hazards has fuelled the urgency for effective disaster mitigation and conjointly, climate policies. A reliable evidence base is a prerequisite for effective decision-making. Nonetheless, missing data are ubiquitous across disaster databases [5–7]. When neglected, or inappropriately handled, missing data threatens the validity of study results and consequently, the wider evidence base. Ultimately, systematic, peer-reviewed reporting of disaster events in the field is necessary to evade large proportions of missing data. However, achieving this requires extensive, long-term efforts. Instead, missing data should be appropriately accounted for to maximise the reliability of the existing data.
This systematic review revealed large failings of the quantitative, empirical, disaster literature to acknowledge and handle missing data. Given the prevalence of missing data across disaster databases [5–7] it can be assumed that most studies in our sample were subject to missing data. Accordingly, we contested that a lack of acknowledgement was not due to an absence of missing data. Less than half (46.2%) of the studies in our sample acknowledged missing data and only a tenth (11.5%) of these acknowledged missing data to an extent deemed comprehensive. Accordingly, in most cases, the proportions, implications or potential mechanisms of missing data could not be appropriately evaluated. Eekhout et al [21] similarly found that only 14% of studies published in the American Journal of Epidemiology, Epidemiology and the International Journal of Epidemiology considered potential mechanisms of missing data. Of note, we identified page count as a significant, negative determinant of a study to acknowledge missing data. This negates the assumption that page and word count restrictions impede adequate acknowledgement of missing data. Instead, it is possible that policy reports, which generally have higher page counts and place less emphasis on methodological detail, due to a broad readership, drove this association.
Of the studies that acknowledged missing data, a large proportion (72.5%) took steps to handle it. The research field of the publication journal was identified as a significant predictor of a study to both acknowledge and handle missing data. This indicates that specific research fields, namely Natural Sciences and Economics, have more exacting methodological standards concerning their consideration. However, only a third (33.5%) of the studies in our sample handled missing data. This is consistent with the findings of Díaz-Ordaz et al [12] who found only 33.7% of RCTs in their sample handled missing data.
Little insight could be derived from the disaster literature concerning typical or standard practices to handle missing data. Instead, we found that missing data were handled inconsistently and often haphazardly, with the most frequently employed approaches being ad-hoc and lacking statistical basis. This raises concern regarding the validity of the evidence base.
The broad missing data method employed was significantly associated with the geographical scope of the study. Studies that conducted a multi-country analysis most commonly employed a deletion method. One possible explanation is that data were initially acquired from numerous data sources, generating a more complete dataset. Given a smaller proportion of missing data, the risk of bias associated with deletion methods is reduced [14]. Nonetheless, deletion methods still pose a risk of bias since missing data are unlikely to be MCAR [7].
A limitation of this systematic review is that we only considered studies utilising EM-DAT as a primary or secondary data source. Extending our eligibility criteria to include other disaster databases would have improved the external validity of our results. In addition, whilst every effort was made to identify all relevant studies, there is a possibility that unpublished working papers and studies published before 1990 were missed. Nonetheless, due to EM-DAT’s prominence in the disaster literature and as we identified only a few studies published before 1997, it is likely that this systematic review still captured a representative sample of the disaster literature.
This paper is the first, large-scale systematic review of the disaster literature to determine how missing data have been acknowledged and handled in practice. This comes at an opportune time; when disaster data are increasingly utilised by decision-makers and researchers to inform disaster mitigation and climate policies. The results of this systematic review highlight the shortcomings of quantitative, empirical disaster research to adequately acknowledge and handle missing data. Consequently, this paper casts doubt over the reliability of the evidence base and prompts authors not to overlook the issue of missing data. Although the risk of bias due to missing data will vary across studies, it cannot, systematically, be assumed to be negligible. Future work should focus on informing best practices to acknowledge and handle missing data in the context of disaster research. This could derive from an evaluation of potential missing data methods via simulation analysis and/or the formation of an expert advisory group.
This research was undertaken with support from the Centre for Research on the Epidemiology of Disasters (CRED) and the Université catholique de Louvain, as well as funding granted to CRED from USAID/DCHA/OFDA [Ref No. 72OFDA20CA00072]. We would like to thank the reviewers and editors at Environmental Research Letters who helped shape the final version of this paper.
All data that support the findings of this study are included within the article (and any supplementary files).
The study was conceptualised by ST and RLJ. All authors were involved in the design of the study protocol and participated in the writing of the review protocol. RLJ and AK carried out the systematic review under the supervision of ST. RLJ and AK conducted the data analysis and prepared figures under the supervision of ST. All authors contributed to the interpretation of results. RLJ wrote the first version of the manuscript. All authors contributed to the subsequent writing and revision of the manuscript.
The authors declare that they have no competing interests.