Tracking changes in frailty throughout later life: results from a 17-year longitudinal study in the Netherlands (original) (raw)
Journal Article
Department of Epidemiology and Biostatistics, Amsterdam Public Health research institute, VU University Medical Center, Amsterdam, the Netherlands
Address correspondence to: Emiel O. Hoogendijk, Department of Epidemiology & Biostatistics, VU University Medical Center, PO Box 7057, 1007MB, Amsterdam, the Netherlands. Tel: +31204443146; Email: [email protected]
Search for other works by this author on:
Division of Geriatric Medicine, Department of Medicine, Dalhousie University, Halifax, Nova Scotia, Canada
Search for other works by this author on:
Division of Geriatric Medicine, Department of Medicine, Dalhousie University, Halifax, Nova Scotia, Canada
Search for other works by this author on:
Department of Health Sciences, Lakehead University, Thunder Bay, Ontario, Canada
Search for other works by this author on:
Bregje D Onwuteaka-Philipsen ,
Bregje D Onwuteaka-Philipsen
Department of Public and Occupational Health, Amsterdam Public Health research institute, VU University Medical Center, Amsterdam, the Netherlands
Search for other works by this author on:
Department of Epidemiology and Biostatistics, Amsterdam Public Health research institute, VU University Medical Center, Amsterdam, the Netherlands
Search for other works by this author on:
Department of Epidemiology and Biostatistics, Amsterdam Public Health research institute, VU University Medical Center, Amsterdam, the Netherlands
Department of Sociology, VU University, Amsterdam, the Netherlands
Search for other works by this author on:
Received:
15 January 2018
Revision received:
27 March 2018
 PDF
PDF Cite
Emiel O Hoogendijk, Kenneth Rockwood, Olga Theou, Joshua J Armstrong, Bregje D Onwuteaka-Philipsen, Dorly J H Deeg, Martijn Huisman, Tracking changes in frailty throughout later life: results from a 17-year longitudinal study in the Netherlands, Age and Ageing, Volume 47, Issue 5, September 2018, Pages 727–733, https://doi.org/10.1093/ageing/afy081
Close
Navbar Search Filter Mobile Enter search term Search
Abstract
Background
to better understand the development of frailty with ageing requires longitudinal studies over an extended time period.
Objective
to investigate changes in the degree of frailty during later life, and the extent to which changes are determined by socio-demographic characteristics.
Methods
six measurement waves of 1,659 Dutch older adults aged 65 years and over in the Longitudinal Aging Study Amsterdam (LASA) yielded 5,211 observations over 17 years. At each wave, the degree of frailty was measured with a 32-item frailty index (FI), employing the deficit accumulation approach. Socio-demographic characteristics included age, sex, educational level and partner status. Generalized Estimating Equation (GEE) analyses were performed to study longitudinal frailty trajectories.
Results
higher baseline FI scores were observed in older people, women, and those with lower education or without partner. The overall mean FI score at baseline was 0.17, and increased to 0.39 after 17 years. The average doubling time in the number of deficits was 12.6 years, and this was similar in those aged 65–74 years and those aged 75+. Partner status was associated with changes over time in FI score, whereas sex and educational level were not.
Conclusions
this longitudinal study showed that the degree of frailty increased with ageing, faster than the age-related increase previously observed in cross-sectional studies. Even so, the rate of deficit accumulation was relatively stable during later life.
Introduction
Frailty is a clinical state and can be quantified to characterise the degree to which older adults are at risk of adverse outcomes, such as functional decline, hospitalisation and mortality [1, 2]. Despite the compelling evidence that frailty is associated with adverse health outcomes, there is still a great deal we do not know about the emergence of frailty in later life. Cross-sectional studies have shown, not surprisingly, that a higher age is associated with higher frailty levels [3]. However, the rate of increase in frailty with ageing still has to be determined [4]. This is needed to better understand how frailty develops, information which can be used to predict future healthcare use. Longitudinal studies over an extended period allow us to investigate the extent to which the degree of frailty changes as people age.
Besides describing general changes in frailty with ageing, it is also important to provide insight into variability in change between subgroups. Some groups may experience stronger increases in frailty over time than do others. In cross-sectional studies, the degree of frailty has been shown to be related to various socio-demographic characteristics, such as sex and educational level (e.g. females and less educated people have higher frailty levels) [5, 6]. It is largely unknown whether these characteristics also determine changes in the degree of frailty.
Among the many operational definitions of frailty [7], the widely used frailty index (FI) quantifies the individual accumulation of health deficits, such as diseases, symptoms, signs or disabilities [8]. So far, the FI has mainly been used in cross-sectional studies or in longitudinal studies as a predictor of adverse outcomes [9]. The continuous nature of the instrument and its sensitivity to measure levels of frailty would also qualify the FI as an outcome measure and as a means of studying longitudinal frailty trajectories [4, 10, 11].
In the current study, we examine frailty trajectories over 17 years. Using data from six waves of the Longitudinal Aging Study Amsterdam (LASA), we investigated changes in the degree of frailty during later life, and the extent to which socio-demographic characteristics influence these changes.
Methods
Design and study sample
LASA is an ongoing study on physical, emotional, cognitive and social functioning of older adults in the Netherlands, based on a nationally representative sample. The study started in 1992–93 with 3,107 respondents aged 55–85 years. Follow-up visits are made approximately every three years. Data are collected in a face-to-face main interview and in a separate medical interview (including clinical tests) in the respondent’s home by trained interviewers. More details on the sampling and data collection of LASA have been published previously [12]. The study received approval by the medical ethics committee of the VU University Medical Center. Signed informed consent was obtained from all participants.
For the present study, we used the second LASA measurement wave (1995–96) as our baseline observation, since various instruments needed to measure frailty were included from this wave onwards. We used data from six consecutive measurement waves over a period of 17 years (T1 = 1995–96, T2 = 1998–99, T3 = 2001–02, T4 = 2005–06, T5 = 2008–09 and T6 = 2011–12). The sample consisted of respondents aged 65 years and older who participated in the main face-to-face interview of T1 (N = 1,738), and who had enough data available to calculate the degree of frailty (missing data for 79 respondents). This resulted in a final dataset of 1,659 respondents, who provided 5,211 observations (N = 1,659 at T1, N = 1,260 at T2, N = 930 at T3, N = 611 at T4, N = 454 at T5 and N = 297 at T6). Respondents for whom no follow-up data was available (N = 399) were older, lower educated, more often male, more often without partner and had a higher degree of frailty.
Measurements
At each measurement wave, the degree of frailty was measured with an FI, based on the deficit accumulation approach [8]. The construction of this FI in LASA and its validation for mortality have been published [10]. In summary, for the construction of the FI a standard procedure was followed [13]. The FI includes 32 health deficits from physical, mental and cognitive domains. Variables included self-reported chronic conditions (11 items); functional limitations (6 items); self-rated health (2 items); mental health (6 items from the CES-D depression scale); physical activity (1 item); cognitive health (5 items, based on self-reported memory complaints and domains of the MMSE); and physical performance measured by gait speed (1 item). All deficits were scored between 0 and 1, where 0 indicates the absence of the deficit and 1 the presence of a deficit. See Supplementary data for an overview of all included variables and cut-off values (Appendix A, available at Age and Ageing online). We did not calculate a frailty score for participants with more than 20% missing variables of the FI. This commonly used criterion allows maximum use of available data without excessive reliance on imputation procedures [14]. A frailty score was calculated for each participant by dividing the sum of the health deficit scores by the total number of health deficits measured. This resulted in a score between 0 (no deficits present) and 1 (all deficits present). For example, if a person had eight points out of 32, the FI score was 8/32 = 0.25. In the current study, the construction of the FI and cut-off values for each item were identical across all measurement waves.
Independent variables included socio-demographic variables (age, sex, educational level, partner status; all measured at baseline), and follow-up time in years since baseline. Educational level was measured with a question on highest level of education attained, on a nine-category scale. We distinguished three groups of educational level: low (elementary school or less), medium (lower vocational or general intermediate education), and high (intermediate vocational education, general secondary school, higher vocational education, college or university). Partner status indicated whether a respondent had a spouse or partner.
Statistical analysis
Descriptive statistics were calculated to describe the study sample across all measurement waves. To study longitudinal frailty trajectories over a period of 17 years, we used Generalized Estimating Equations (GEE), which takes into account the dependency between repeated measures [15]. The GEE analysis was executed with a 5-dependent correlation matrix. Because of the distributions of the FI score (slightly skewed to the right), the natural log of the FI score was used in the GEE analysis. Estimates were later back-transformed for descriptive purposes (e.g. to show trajectories in a figure). Three models were tested. In the first model, changes over time in FI score were examined, adjusted for age at baseline and sex. Based on the intercept and time slope, the doubling time of the number of deficits was calculated as an indicator of the rate of increase (relative increase). In the second model, educational level and partner status were additionally included as covariates. To study the effects of the socio-demographic factors (age, sex, educational level and partner status) on changes over time in FI score, interaction-effects between these factors and time were included in the third model. We tested non-linear change by adding a quadratic term for time, but this was not statistically significant and therefore excluded from the final models. All analyses were done in IBM SPSS Statistics 22 (IBM Corp. Armonk, NY).
Results
Table 1 shows the characteristics of the study sample. At baseline, half the sample was aged <76 years, a slight majority were female, and similarly large fractions (~43%) had low levels of education, and/or no partner. The median FI score was 0.179 and increased across subsequent measurement waves (Table 1). Note that the differences in FI scores between measurement waves presented in this table cannot be interpreted as trajectories, due to attrition between measurement waves. At baseline, higher median FI scores were seen in women (0.195), older people (0.221 in those aged 75+), and in those with low education (0.203) and without a partner (0.218).
Table 1.
Study sample characteristics at baseline and follow-ups
| T1 (1995/96) | T2 (1998/99) | T3 (2001/02) | T4 (2005/06) | T5 (2008/09) | T6 (2011/12) | |
|---|---|---|---|---|---|---|
| N | 1,659 | 1,260 | 930 | 611 | 454 | 297 |
| Age, median (IQR) | 75.7 (70.1–81.6) | 77.1 (72.4–83.0) | 78.6 (74.6–84.5) | 81.1 (77.6–85.6) | 83.3 (80.3–87.2) | 85.3 (82.9–88.9) |
| Sex, % female | 52.9 | 55.6 | 57.6 | 59.7 | 60.4 | 61.6 |
| Educational level | ||||||
| Low, % | 43.5 | 41.4 | 41.2 | 36.5 | 36.1 | 35.4 |
| Medium, % | 30.0 | 31.7 | 30.9 | 32.4 | 32.8 | 34.0 |
| High, % | 26.6 | 26.8 | 28.0 | 31.1 | 31.1 | 30.6 |
| Partner status, % without partner | 43.1 | 46.8 | 40.5 | 54.2 | 58.4 | 60.6 |
| FI score, median (IQR) | 17.9 (11.2–27.3) | 20.0 (12.2–29.6) | 21.3 (13.5–32.2) | 24.7 (17.2–35.1) | 25.9 (16.1–36.1) | 29.2 (19.7–38.8) |
IQR, interquartile range (25th–75th percentiles); FI scores are multiplied by 100 for interpretation purposes.
Model 1 of the GEE analyses (Table 2) shows that the FI score increased with ageing (B Time = 0.052, P < 0.001). Using estimated means from the GEE analysis, the overall mean FI score at baseline was 0.165 and increased to 0.388 after 17 years of follow-up. This corresponds to an average doubling time in the number of deficits of 12.6 years, which is illustrated by the line of the total population in Figure 1. Model 1 also indicates that women (B = 0.184, P < 0.001) and those with a higher age at baseline (B = 0.038, P < 0.001) had higher overall FI scores. Model 2 shows that those with medium (B = 0.078, P < 0.05) and low levels of education (B = 0.164, P < 0.001) had higher FI scores compared to respondents with a high level of education. Higher levels of frailty were also observed in people without a partner (B = 0.096, P < 0.01).
Table 2.
Generalized estimating equation analyses: changes in FI scores during 17 years of follow-up
| Model 1 | Model 2 | Model 3 | ||||
|---|---|---|---|---|---|---|
| B (95% CI) | P | B (95% CI) | P | B (95% CI) | P | |
| Time slope (years) | 0.052 (0.049–0.054) | <0.001 | 0.052 (0.049–0.054) | <0.001 | −0.011 (−0.046–0.024) | 0.53 |
| Age at baseline (years) | 0.038 (0.035–0.042) | <0.001 | 0.035 (0.031–0.039) | <0.001 | 0.033 (0.028–0.037) | <0.001 |
| Sex (female) | 0.184 (0.134–0.233) | <0.001 | 0.112 (0.057–0.167) | <0.001 | 0.130 (0.069–0.191) | <0.001 |
| Educational level | ||||||
| Medium education | 0.078 (0.012–0.143) | <0.05 | 0.072 (−0.002–0.146) | 0.06 | ||
| Low education | 0.164 (0.102–0.227) | <0.001 | 0.163 (0.093–0.233) | <0.001 | ||
| Partner status (no partner) | 0.096 (0.039–0.152) | <0.01 | 0.119 (0.055–0.183) | <0.001 | ||
| Age × Time | 0.001 (0.000–0.001) | <0.001 | ||||
| Sex × Time | −0.006 (−0.011 to 0.000) | 0.06 | ||||
| Education × Time | ||||||
| Medium education × Time | 0.001 (−0.005 to 0.008) | 0.68 | ||||
| Low education × Time | 0.001 (−0.006 to 0.007) | 0.85 | ||||
| Partner status × Time | −0.007 (−0.012 to −0.001) | <0.05 |
Analyses included N respondents = 1,659 and N observations = 5,211; Age, educational level and partner status were measured at baseline; High educational level is the reference group; The outcome measure is the log-transformed FI score.
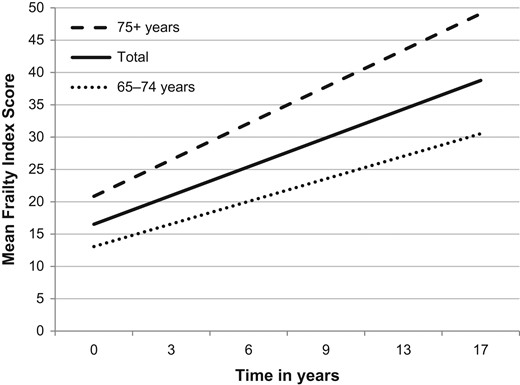
Figure 1.
Estimated changes in mean FI scores over a period of 17 years. Estimated mean FI scores based on GEE analyses for the total sample and by baseline age group; FI scores are multiplied by 100 to enhance interpretation.
Model 3 (Table 2) demonstrated a statistically significant interaction effect between age and time, indicating that the absolute increase in FI score was higher in those with a higher age at baseline (B = 0.001, P < 0.001). Furthermore, the interaction effect between partner status and time showed a lower absolute increase in FI score for people without a partner (B = −0.007, P < 0.05). Educational level and sex did not affect change in FI score. In Appendix B (available at Age and Ageing online), sex-stratified analyses are shown, indicating that differences between men and women remained the same during 17 years of follow-up.
To get insight into the stability of the rate of increase in FI score during later life, we also calculated the doubling time in the number of deficits by age group. Although the absolute change in FI score was higher in the highest age group (75+ years), the rate of increase remained relatively stable, as the doubling time in the number of deficits was 12.7 years among people aged 65–75 years (N = 785), and 12.5 years among those aged 75+ years (N = 874) (Figure 1).
Discussion
In this 17-year longitudinal study of Dutch older adults the estimated mean FI score increased from 0.17 to 0.39. Higher baseline FI scores were observed in people with a higher age, women, lower educated and people without a partner. Even so, the rate of increase in FI score was the same for all groups, except for those without a partner, in whom it increased more slowly.
In the current study, the estimated doubling time of health deficits was 12.6 years. This is faster than observed in a previous study that made use of longitudinal data without applying an analytical technique for repeated measures (15.4 years doubling time) [4]. The increase is also much faster than in cross-sectional studies, in which an age-related doubling time of 20 years or more has been observed [4]. This is crucial information for health-policy makers and healthcare professionals. However, more studies are needed to confirm our findings with regard to the doubling time. A direction for future research may be a comparison with different analytical techniques (e.g. longitudinal models accounting for the competing risk of death), using data from cohort studies in different countries and settings.
Our findings with regard to the effect of baseline age on changes in FI scores over time corroborate and extend previous cross-sectional studies. Although our analyses revealed that absolute changes in FI scores were greater among those with a higher baseline age, the rate of change, as expressed by the doubling time of health deficits, was the same for different age groups. This confirms evidence from cross-sectional studies, showing that health deficits accumulated exponentially with age [3, 16, 17]. Our study confirmed well-known sex differences in frailty, as our results showed that women have higher FI scores and accumulate more deficits than men [18]. However, sex did not affect change in FI score, which was illustrated by persisting sex differences during 17 years of follow-up.
A low level of education was associated with higher baseline frailty levels, but not with changes in frailty over time. This is in line with previous studies, which also showed persisting educational inequalities in frailty in later life, although measured with different frailty instruments [19, 20]. At the same time, given that the FI score cannot exceed a certain limit, one would expect a lower rate of increase among lower educated compared to higher educated—just like we observed in people without a partner. However, the statistically significant effect of partner status may be explained by an underlying gender effect, as women are overrepresented among those without a partner. The combination of being female and having no partner may have led to higher baseline FI scores, which lowered the chance of further increase in frailty during follow-up.
Reducing frailty and its negative health consequences is a priority for public health [21]. Our results showed that the average FI score increased from 0.17 to 0.39 over a period of 17 years, which means that a large part of the older population will ultimately reach clinically relevant levels of frailty (i.e. an FI score of at least 0.25) [22–24]. We also found that differences in frailty between subgroups are already manifest by the age of 65. This means that preventive strategies aimed at reducing the development and progression of frailty should be adopted in earlier life stages. However, additional longitudinal research is needed to get a better picture of the development of frailty over the life course. Future studies may include samples of adults in midlife, or even earlier in life to better capture the emergence of frailty in high risk groups. Future research might also focus on the impact of time-varying variables such as specific health conditions, and variables related to social vulnerability (e.g. social resources, such as support from the social network [25]), to see to what extent they shape deficit accumulation in later life.
To our knowledge, this is one of the first studies focused on longitudinal changes in the degree of frailty over an extended time period [26]. The large number of observations across a period of 17 years, with a consistently measured FI at each wave, facilitated the investigation of frailty trajectories in a representative sample of Dutch older adults. Changes in frailty with ageing were studied for the total population and for specific subgroups. Nevertheless, there were also important limitations. First, as in all longitudinal studies, there is attrition of respondents, which can lead to a relatively healthy sample and underestimation of the increase in FI scores over time. Second, LASA waves were conducted at 3-year intervals. Some participants may have dropped out from the study after a period of rapid decline, which is not captured by the data. The results of our analyses only pertain to the generation that was 65 years and over in 1995 and neglects possible period and cohort effects. This should be addressed in future research. Recent studies have shown, for example, cohort differences in the levels of frailty and in the lethality of frailty [27, 28]. Finally, our estimates evaluate only the average case, which is one of decline. Frailty itself shows considerable dynamics, typically conditioned on the starting state, so that those with fewer deficits are more likely to show stability or improvement [29, 30].
In conclusion, this 17-year longitudinal study among Dutch older adults showed that the degree of frailty increased with ageing, faster than the age-related increase previously observed in cross-sectional studies. Various socio-demographic characteristics, such as a low educational level, were associated with higher baseline frailty scores. However, the rate of increase in frailty was the same for most groups. This contains an important message for health-policy makers, as it shows that differences in frailty already develop in earlier stages of the life course. During later life, although the number of new deficits added each year grows, the rate of deficit accumulation seems to be relatively stable.
- This study investigated longitudinal frailty trajectories over a period of 17 years.
- A 32-item FI based on the deficit accumulation approach was used.
- The average doubling time in the number of deficits was 12.6 years.
- This doubling time is much faster than the age-related increase previously observed in cross-sectional studies.
- Socio-demographic characteristics determined frailty levels at baseline, not the rate of increase.
Conflict of interest
K.R. is President and Chief Science Officer of DGI Clinical, which has contracts with pharma on individualised outcome measurement. In 2017 he attended an advisory board meeting with Lundbeck. Otherwise all personal fees are for invited guest lectures and academic symposia. He is Associate Director of the Canadian Consortium on Neurodegeneration in Aging, which is funded by the Canadian Institutes of Health Research, with additional funding from the Alzheimer Society of Canada and several other charities, as well as from Pfizer Canada and Sanofi Canada. He receives career support from the Dalhousie Medical Research Foundation as the Kathryn Allen Weldon Professor of Alzheimer Research, and research support from the Nova Scotia Health Research Foundation, the Capital Health Research Fund and the Fountain Family Innovation Fund of the Nova Scotia Health Authority Foundation.
Funding
The Longitudinal Aging Study Amsterdam is largely supported by a grant from the Netherlands Ministry of Health Welfare and Sports, Directorate of Long-Term Care. The funding source did not have any role in the design, execution, analysis and interpretation of data or writing of the study.
References
1
Clegg
A
,
Young
J
,
Iliffe
S
,
Rikkert
MO
,
Rockwood
K
.
Frailty in elderly people
.
Lancet
2013
;
381
:
752
–
62
.
2
Kojima
G
,
Iliffe
S
,
Walters
K
.
Frailty index as a predictor of mortality: a systematic review and meta-analysis
.
Age Ageing
2018
;
47
:
193
–
200
.
.
3
Theou
O
,
Brothers
TD
,
Pena
FG
,
Mitnitski
A
,
Rockwood
K
.
Identifying common characteristics of frailty across seven scales
.
J Am Geriatr Soc
2014
;
62
:
901
–
6
.
4
Mitnitski
A
,
Rockwood
K
.
The rate of aging: the rate of deficit accumulation does not change over the adult life span
.
Biogerontology
2016
;
17
:
199
–
204
.
5
Romero-Ortuno
R
,
Kenny
RA
.
The frailty index in Europeans: association with age and mortality
.
Age Ageing
2012
;
41
:
684
–
9
.
6
Romero-Ortuno
R
.
Frailty Index in Europeans: association with determinants of health
.
Geriatr Gerontol Int
2014
;
14
:
420
–
9
.
7
Dent
E
,
Kowal
P
,
Hoogendijk
EO
.
Frailty measurement in research and clinical practice: a review
.
Eur J Intern Med
2016
;
31
:
3
–
10
.
8
Mitnitski
AB
,
Mogilner
AJ
,
Rockwood
K
.
Accumulation of deficits as a proxy measure of aging
.
ScientificWorldJournal
2001
;
1
:
323
–
36
.
9
Drubbel
I
,
de Wit
NJ
,
Bleijenberg
N
,
Eijkemans
RJ
,
Schuurmans
MJ
,
Numans
ME
.
Prediction of adverse health outcomes in older people using a frailty index based on routine primary care data
.
J Gerontol A Biol Sci Med Sci
2013
;
68
:
301
–
8
.
10
Hoogendijk
EO
,
Theou
O
,
Rockwood
K
,
Onwuteaka-Philipsen
BD
,
Deeg
DJH
,
Huisman
M
.
Development and validation of a frailty index in the longitudinal aging study Amsterdam
.
Aging Clin Exp Res
2017
;
29
:
927
–
33
.
11
Cesari
M
,
Gambassi
G
,
van Kan
GA
,
Vellas
B
.
The frailty phenotype and the frailty index: different instruments for different purposes
.
Age Ageing
2014
;
43
:
10
–
2
.
12
Hoogendijk
EO
,
Deeg
DJH
,
Poppelaars
J
et al. .
The longitudinal aging study Amsterdam: cohort update 2016 and major findings
.
Eur J Epidemiol
2016
;
31
:
927
–
45
.
13
Searle
SD
,
Mitnitski
A
,
Gahbauer
EA
,
Gill
TM
,
Rockwood
K
.
A standard procedure for creating a frailty index
.
BMC Geriatr
2008
;
8
:
24
.
14
Theou
O
,
Brothers
TD
,
Mitnitski
A
,
Rockwood
K
.
Operationalization of frailty using eight commonly used scales and comparison of their ability to predict all-cause mortality
.
J Am Geriatr Soc
2013
;
61
:
1537
–
51
.
15
Twisk
JW
.
Longitudinal data analysis. A comparison between generalized estimating equations and random coefficient analysis
.
Eur J Epidemiol
2004
;
19
:
769
–
76
.
16
Mitnitski
A
,
Song
X
,
Skoog
I
et al. .
Relative fitness and frailty of elderly men and women in developed countries and their relationship with mortality
.
J Am Geriatr Soc
2005
;
53
:
2184
–
9
.
17
Rockwood
K
,
Song
X
,
Mitnitski
A
.
Changes in relative fitness and frailty across the adult lifespan: evidence from the Canadian National Population Health Survey
.
CMAJ
2011
;
183
:
E487
–
494
.
18
Gordon
EH
,
Peel
NM
,
Samanta
M
,
Theou
O
,
Howlett
SE
,
Hubbard
RE
.
Sex differences in frailty: a systematic review and meta-analysis
.
Exp Gerontol
2017
;
89
:
30
–
40
.
19
Hoogendijk
EO
,
van Hout
HP
,
Heymans
MW
et al. .
Explaining the association between educational level and frailty in older adults: results from a 13-year longitudinal study in the Netherlands
.
Ann Epidemiol
2014
;
24
:
538
–
44
.
20
Stolz
E
,
Mayerl
H
,
Waxenegger
A
,
Rasky
E
,
Freidl
W
.
Impact of socioeconomic position on frailty trajectories in 10 European countries: evidence from the Survey of Health, Ageing and Retirement in Europe (2004–2013)
.
J Epidemiol Community Health
2017
;
71
:
73
–
80
.
21
Rodriguez-Artalejo
F
,
Rodriguez-Manas
L
.
The frailty syndrome in the public health agenda
.
J Epidemiol Community Health
2014
;
68
:
703
–
4
.
22
Song
X
,
Mitnitski
A
,
Rockwood
K
.
Prevalence and 10-year outcomes of frailty in older adults in relation to deficit accumulation
.
J Am Geriatr Soc
2010
;
58
:
681
–
7
.
23
Rockwood
K
,
Andrew
M
,
Mitnitski
A
.
A comparison of two approaches to measuring frailty in elderly people
.
J Gerontol A Biol Sci Med Sci
2007
;
62
:
738
–
43
.
24
Rockwood
K
,
Howlett
SE
,
MacKnight
C
et al. .
Prevalence, attributes, and outcomes of fitness and frailty in community-dwelling older adults: report from the Canadian study of health and aging
.
J Gerontol A Biol Sci Med Sci
2004
;
59
:
1310
–
7
.
25
Bunt
S
,
Steverink
N
,
Olthof
J
,
van der Schans
CP
,
Hobbelen
JSM
.
Social frailty in older adults: a scoping review
.
Eur J Ageing
2017
;
14
:
323
–
34
.
26
Armstrong
JJ
,
Godin
J
,
Launer
LJ
et al. .
Changes in frailty predict changes in cognition in older men: the Honolulu-Asia Aging Study
.
J Alzheimers Dis
2016
;
53
:
1003
–
13
.
27
Backman
K
,
Joas
E
,
Falk
H
,
Mitnitski
A
,
Rockwood
K
,
Skoog
I
.
Changes in the lethality of frailty over 30 years: evidence from two cohorts of 70-year-olds in Gothenburg Sweden
.
J Gerontol A Biol Sci Med Sci
2017
;
72
:
945
–
50
.
28
Yu
R
,
Wong
M
,
Chong
KC
et al. .
Trajectories of frailty among Chinese older people in Hong Kong between 2001 and 2012: an age-period-cohort analysis
.
Age Ageing
2018
;
47
:
254
–
61
.
.
29
Mitnitski
A
,
Bao
L
,
Rockwood
K
.
Going from bad to worse: a stochastic model of transitions in deficit accumulation, in relation to mortality
.
Mech Ageing Dev
2006
;
127
:
490
–
3
.
30
Fallah
N
,
Mitnitski
A
,
Searle
SD
,
Gahbauer
EA
,
Gill
TM
,
Rockwood
K
.
Transitions in frailty status in older adults in relation to mobility: a multistate modeling approach employing a deficit count
.
J Am Geriatr Soc
2011
;
59
:
524
–
9
.
© The Author(s) 2018. Published by Oxford University Press on behalf of the British Geriatrics Society. All rights reserved. For permissions, please email: [email protected]
Topic:
- aging
- frailty
- demography
- educational status
- netherlands
- older adult
- doubling time
- wave - physical agent
Supplementary data
I agree to the terms and conditions. You must accept the terms and conditions.
Submit a comment
Name
Affiliations
Comment title
Comment
You have entered an invalid code
Thank you for submitting a comment on this article. Your comment will be reviewed and published at the journal's discretion. Please check for further notifications by email.
Advertisement intended for healthcare professionals
Advertisement intended for healthcare professionals