Abnormal heart rate and body temperature in mice lacking thyroid hormone receptor α1 (original) (raw)
Introduction
Thyroid hormone (TH) is involved in the regulation of many physiological and developmental processes (Forrest 1994; Freake and Oppenheimer 1995; Silva 1995). The hormone (tri‐iodothyronine, T3, and its precursor thyroxine, T4) also plays a major role in the cardiovascular system, such as regulation of heart rate, cardiac output and lipid content. Hypothyroidism in man and in animal models manifests in low heart rate and cardiac output as well as hyperlipidemia. In contrast, hyperthyroidism is associated with tachycardia that can lead to arrhythmia, elevated cardiac output and hypolipidemia (Dillman, 1996).
Thyroid hormone acts through nuclear hormone receptors (TRs), which are ligand dependent transcription factors encoded by two different genes in mammals, each one giving rise to variant proteins (Lazar et al. 1988; Mitsuhashi et al. 1988). The proteins from the TRα gene have distinct properties: TRα1 binds TH and thereby regulates target gene expression, whereas TRα2 binds no known hormone. Its function is unclear, although it has been suggested that it represses TRα1 functions (Koenig et al. 1989; Katz et al. 1995). Both variant TRβ proteins bind TH and transactivate target genes although they differ in their N‐terminal regions.
The role of TRβ in mediating the effects of TH has been elucidated in part. The syndrome of generalized resistance to thyroid hormones (GRTH) is well characterized (Refetoff et al. 1993; Refetoff 1994) and has given important clues to the role of TRβ. The syndrome is associated with two different genetic abnormalities, both afflicting the TRβ gene. Heterozygous patients from ∼50 families with a transdominant negative version of the receptor often suffer from elevated levels of TH, growth and mental retardation, tachycardia and attention deficity/hyperactivity. They have surprisingly normal levels of thyroid stimulating hormone (TSH), resulting from the inability of the mutant receptor to downregulate the TSH genes. Moreover, patients and mice lacking the TRβ gene have a hearing loss and have elevated levels of thyroid hormones and TSH (Refetoff et al. 1967; Usala et al. 1991; Takeda et al. 1992; Forrest et al. 1996a, b). The studies suggest that TRβ regulates expression of the pituitary hormones TSH and growth hormone, and that TRβ is important for certain neuronal functions.
To clarify the difference between expression of a dominant‐negative receptor to that of loss of a receptor, and to determine the roles of the individual thyroid hormone receptors in development, we generated mice with a null mutation of the TRα1 locus using homologous recombination. Our results define, for the first time, specific roles for TRα in mediating the effects of TH.
Results
Generation of mice lacking TRα1
To determine the roles of the individual TRs in mediating the effects of TH, we wished to develop transgenic mice from which a functional TRα1 gene was deleted, but which still expressed the splice variant, TRα2, and the related orphan receptor, rev‐erbAα, that is transcribed on the opposite strand (Lazar et al. 1988, 1989; Miyajima et al. 1989) (Figure 1A). For this we constructed a targeting vector that would replace the TRα1‐specific coding sequence with that of TRα2 (Figure 1A). Homologous recombination, which deleted the TRα1‐specific sequence in mouse embryonal stem (ES) cells was achieved in three independent cell clones. A detailed Southern blot analysis with 5′, 3′ and internal probes shows that the DNA in one of the ES clones contained no modifications other than those of the desired recombination event (Figure 1B; for details see Materials and methods).
Figure 1
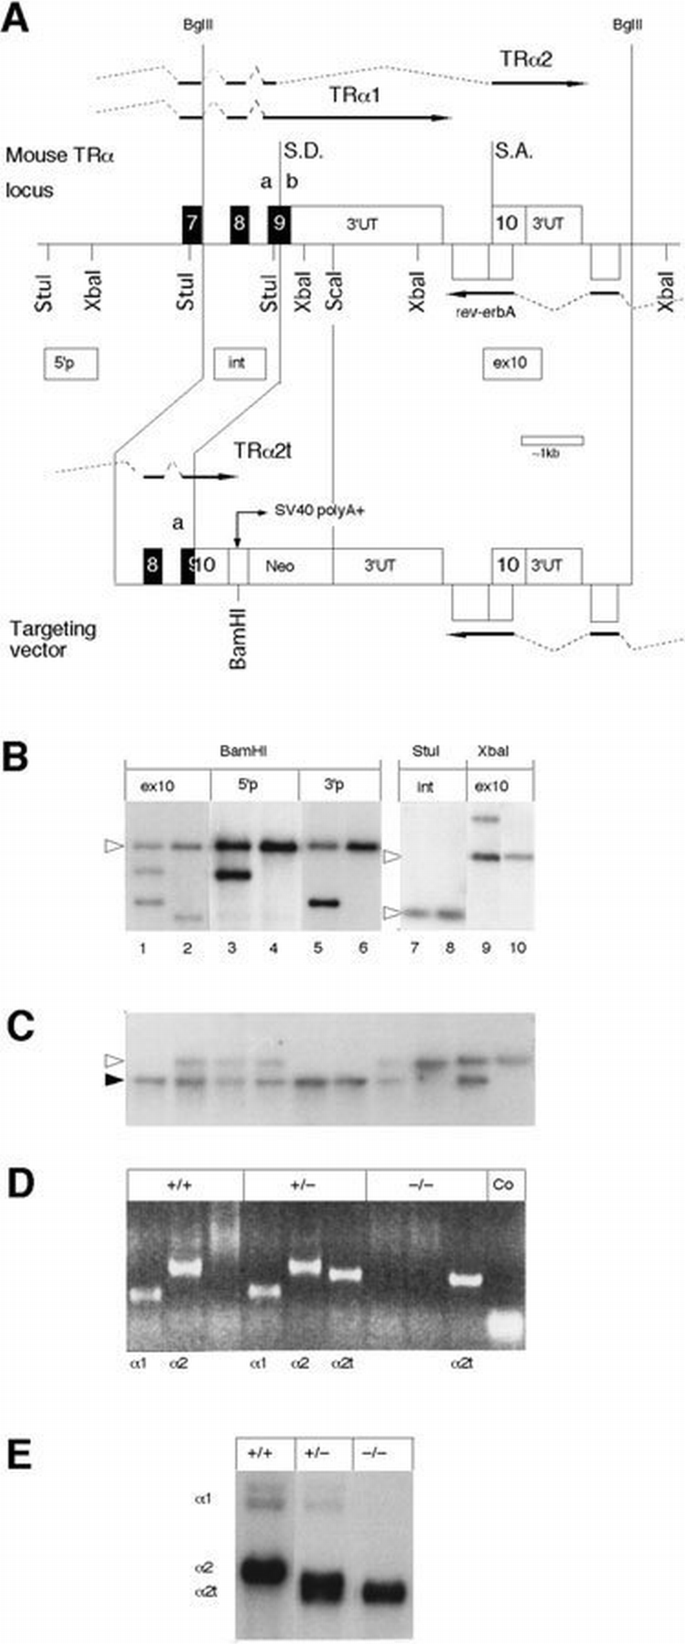
Targeting of the TRα locus. (A) shows the structure of the 3′‐end of the TRα1/rev‐erbAα locus with the targeting vector at bottom. Only the restriction sites relevant for the analysis of the recombination event are shown. The approximate locations for three of the probes used in Southern blotting are shown in boxes. 5′p: 5′ probe; int: internal probe for the 5′ half of the recombined allele; ex10: exon 10 probe. The location of the 3′ probe is not shown for space reasons. Broken lines indicate splicing events. Splice donor sites are indicated by S.D., acceptor sites by S.A. (B) shows a Southern blot analysis of the recombination event in ES cells. DNA from G418 resistant clones was digested with the indicated enzymes. The filters were hybridized, stripped and rehybridized with 5′, 3′ and internal probes as shown in the figure. Odd‐numbered lanes show DNA from targeted cells, even‐numbered lanes indicate normal cells' DNA. The open arrowhead indicates the location of the normal allele. (C) is a Southern blot analysis of _Bam_HI digested DNA from the progeny of one representative litter from a cross between heterozygotes. The 5′ probe was used for hybridization. The open arrowhead indicates the location of the normal allele, the filled arrowhead shows the mutated gene. (D) shows a RT–PCR analysis of polyadenylated brain RNA from −/−, +/− and −/− mice. The primer pairs chosen detect the RNAs for wt TRα1, TRα2 and targeted TRα2, respectively. The RNA transcribed from the targeted allele is indicated by TRα2t. The sizes of the electrophoresed products correspond to the expected sizes. (E) is a Northern blot of polyadenylated brain RNA. The cDNA probe used for hybridization contained sequences common to all forms of TRα RNAs. The TRα2 RNA from the −/− animals migrated faster than the corresponding RNA from the control animals, due to its shorter 3′ untranslated region originating from SV40 sequences in the targeted allele (see panel A).
To learn if the deletion of TRα1 affected viability, heterozygous offspring from founder animals chimeric for the targeted ES cells were mated, and their progeny tested by Southern analyses (Figure 1C). The targeted TRα1 gene was inherited in a Mendelian fashion: crosses between heterozygous female and male mice have given 25 +/+, 46 +/− and 25 −/− animals, with a 50:50 ratio between female and male offspring. This suggests that there is no lethality in −/− embryos. Homozygous animals are viable and survive to at least 18 months of age. Both female and male TRα1 −/− animals were fertile, and the resulting litter sizes were normal. Overall, the animals appear healthy, with no overt abnormalities detected at autopsy.
Next, we wished to establish that expression of TRα2 was unaffected by the TRα1 targeting. RNA from the brains of adult mice of the three genotypes was subjected to RT–PCR analyses. In all three instances, the upstream 5′ primer was complementary to sequences in exon 9a, common to all RNAs. The downstream primers annealed to 3′ untranslated sequences specific to TRα1, wild‐type (wt) TRα2, or to targeted TRα2. The results demonstrate that products of the expected lengths were found in the respective samples (Figure 1D). Furthermore, the data confirm the absence of TRα1 RNA in the −/− mice. A Northern blot analysis of polyadenylated RNAs substantiates the above results (Figure 1E) and shows that +/− animals contained ∼50% of the level of TRα1 RNA as compared with the control sample. The analysis also shows that all three samples contained levels of RNA comparable with a TRα2 protein. The expression of the TRβ gene is unaffected in brain RNA from the TRα1 −/− mice (A.Mansén and B.Vennström, data not shown), suggesting that a compensatory increase in receptor expression does not occur.
Hormonal status
TH production in the thyroid gland is induced by the pituitary thyroid stimulating hormone (TSH). Here, the ligand‐bound receptor acts as a negative regulator, particularly on the TSHβ chain gene, although effects on the α gene have also been observed. The role of TRα, if any, in the regulation of TH production via the pituitary was therefore first analyzed by determining the concentrations of free T3 and T4 in serum, an assay method that accurately reflects the availability of TH to an organism. The results (Figure 2A) show that the TRα‐deficient male mice had lower levels of free T4 than control animals: 8.5 ± 1.7 versus 12.5 ± 4.3 pmol/l (p <0.001). In contrast, no significant differences were found between the female −/− and control mice (9.3 ± 1.4 versus 11.1 ± 2.6 pmol/l; _p_ =0.04). Also, the T3 levels were normal, ranging from 4.7 to 5.1 pmol/l (SD values ± 0.4–0.6) in all mice irrespective of genotype or sex (Figure 2B). To understand this mild hypothyroidism better, the levels of RNAs for the α and β chains of TSH in male mice was determined by Northern blot analyses and quantification. Figure 2C shows that the TSHα RNA level was ∼30% lower in the TRα1−/− mice than in the control mice. In contrast, the TSHβ RNA was more abundant in the −/− animals than in wt controls. We next measured the levels of serum TSH of 4‐month‐old male animals, to determine if the lower abundance of the TSHα mRNA would reflect hormone levels. The results show that the −/− mice had a concentration of 144 ng/ml (SD ± 28, _n_=7), compared with 181 ng/ml (SD ± 18, _n_=9) for the controls (Figure 2D) The TRα1 −/− animals thus have slightly but significantly lower serum TSH levels (p >0.01). Histological analyses of the thyroid glands of the TRα −/− mice showed no abnormalities, and no goitre has been detected in any animals during an 18 month observation period (data not shown). We conclude that the hypothyroidism in the TRα1 −/− mice is a result of dysregulated TSHα production.
Figure 2
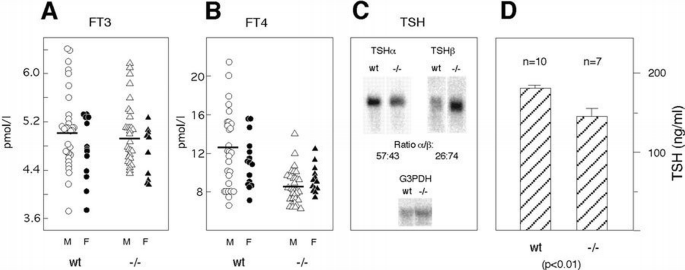
Analysis of the pituitary–thyroid axis of thyroid hormone production. (A) and (B) show the levels of free T3 and T4 in serum. (C) is a Northern blot analysis of RNAs for TSHα and β, respectively. The serum from 2½‐month‐old animals was used to determine levels of free T3 and T4 using a commercially available direct competitive radioimmunoassay from Amersham. To detect TSH RNAs, pituitaries from four animals, aged 8 weeks, were pooled and polyadenylated RNA was transferred to filters as described for Figure 1. Hybridization was done with cDNA probes specific for mouse TSHα and β, respectively (Gurr et al., 1984). The RNAs were quantified with a Phosphorimager, and the ratio of RNA levels between wt and TRα1 −/− animals was normalized against the hybridization signal obtained with a probe for G3PDH. (D) shows serum levels of TSH in 5‐month‐old male mice, as determined by a radioimmunoassay.
Cardiac function
Hyperthyroidism is usually associated with an elevated heart rate (tachycardia). To determine if TRα1 was involved in regulation of heart rate, a telemetry system involving radio transmitters with sensors that record heart rate and complete electrocardiograms in freely moving animals was implanted into 2‐month‐old male mice (Johansson and Thorén, 1997). As shown in Figure 3A, the TRα1‐deficient mice have a lower mean heart rate (bradycardia) than control animals of the same genetic background (mean value per 24 h is 515 beats/min, as compared with 632 beats/min for the wt controls). Since the TRα1−/− mice had subnormal free T4 levels that could have resulted in the low heart rate, the mice were made hyperthyroid. Daily injections of 1 mg/kg body weight of T3 resulted in an increase in heart rate in the −/− and +/+ animals (Figure 3A). The TRα1 −/− mice failed to reach the same heart rate as the control group, even after prolonged treatment of hormone. The concentrations of free T3 in serum were the same in both sets of animals at the termination of the experiments, ranging from 30 to 80 pmol/l when measured 1 day after the last injection. Results similar to these were also obtained after injection of one‐tenth and one‐quarter of the amount of T3 above (data not shown). The data suggest that ablation of TRα1 expression results in a lower intrinsic heart rate, regardless of TH status.
Figure 3
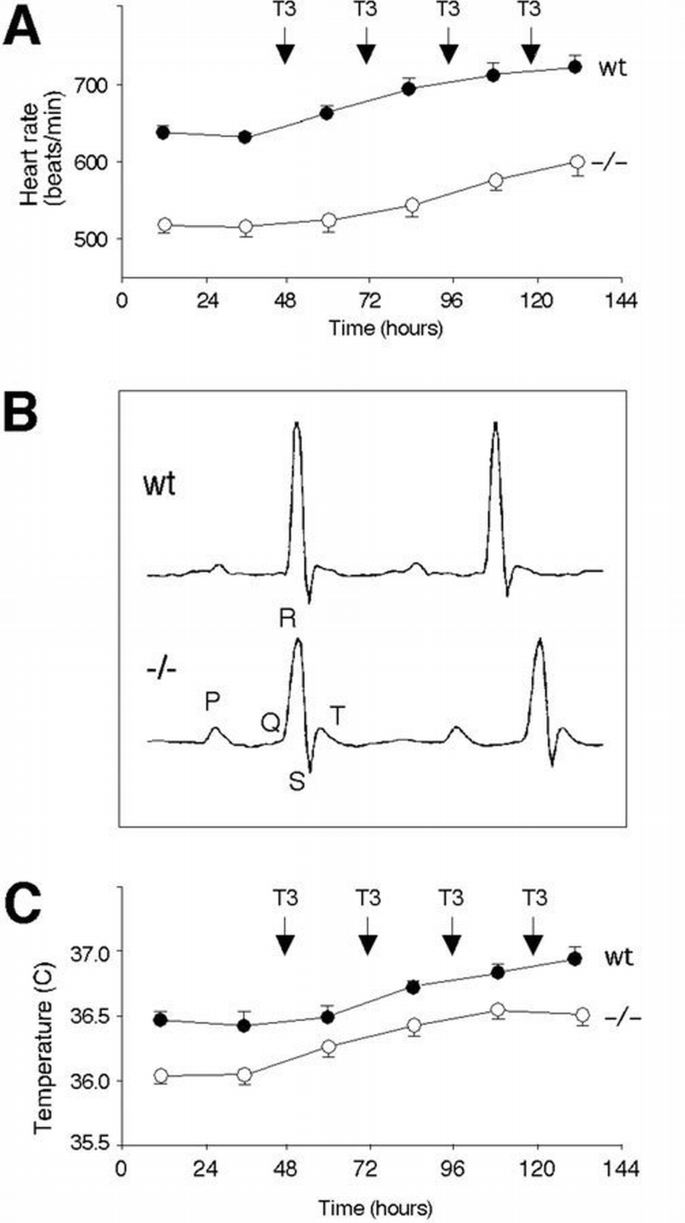
Cardiac and metabolic function abormalities. (A) is a telemetry recording of heart rate in TRα1 deficient and wild‐type mice. The diagram shows 24 h mean values. After 48 h of baseline registration, T3 (1 mg/kg body weight) was injected 1 p.m. for 4 consecutive days. The data are from nine wild‐type and eight −/− animals. (B) shows a typical example of an averaged ECG registration from a TRα1 deficient and a wild‐type mouse. (C) shows the body temperature of mice as 24 h mean values, recorded with the telemetry system.
Averaged electrocardiograms (ECG) recorded from TRα1 −/− and control animals were compared to provide an understanding of the bradycardia. Figure 3B shows that the TRα1 −/− mice have prolonged QRS‐ and QTend‐durations, also after correction for the difference in heart rate. Table I reveals that particularly the QTend duration is markedly prolonged in the homozygotes, as compared with control mice. The prolonged QTend duration suggests a slow ventricular repolarization in the myocardium.
Table I Different time intervals (ms) in the baseline ECG complex in homozygote TRα1 −/− mice (_n_=5) compared with wild‐type mice (_n_=7). 24 h mean values are shown of body temperature (presented as SEM p <0.05a and p <0.01b)
Other physiological parameters
Thyroid hormones also affect body temperature by upregulating thermogenesis in brown fat tissue and gluconeogenesis. The 24 h mean body temperature, recorded by the telemetry system, is 0.5°C lower in the TRα1‐deficient mice than the controls (Table I). When treating the mice with T3, a rapid parallel increase in body temperature was seen in both types of animals (Figure 3C). There was no significant difference in locomotor activity, also revealed by the telemetry, between the two groups, either before or after T3 treatment (data not shown).
Discussion
Targeting the TRα1 gene
Since the TRα1 and TRα2 proteins have different properties, we designed a strategy for removing the coding sequence for TRα1 while allowing continued expression of TRα2. In this way, we hoped to produce mice that allowed identification of functions attributable to TRα1 and interpretation of the phenotype. The results demonstrate that the production of an isoform‐specific knockout was successful with our strategy. We were able to selectively delete sequences which encode TRα1‐specific RNA as shown by the absence of mRNA by Northern blotting and RT–PCR. In addition, we were able to modify the locus so that a TRα2 mRNA was produced at normal levels. This demonstrates that appropriate splicing occurred between exon 8 and the modified exon 9a +10, and that the addition of an artificial polyadenylation sequence did not negatively affect the stability of the TRα2 mRNA.
Hypothyroidism
Mice and patients that lack TRβ expression have high circulating TH levels, accompanied by elevated TSH levels (Refetoff et al. 1967, Forrest et al. 1996a). Forrest et al. (1996a) showed that both the TSHβ (specific to thyrotropes) and, to a lesser extent, the TSHα (expressed in thyrotropes and gonadotropes) RNAs were upregulated in TRβ deficient mice, and therefore suggested that TRβ, highly expressed in the thyrotrophs of the pituitary, is essential for normal T3 regulation of TSH production. Our demonstration that the male TRα1 −/− mice have a mild hypothyroidism support and extend the results on the TRβ −/− mice.
Normally, elevated TH levels suppress, and low TH levels induce, expression of pituitary TSH. However, in TRα1‐deficient mice the mild hypothyroidism does not result in any increase in TSHα RNA levels but, on the contrary, it is associated with a decrease in the RNA levels. These findings run counter to expectations based on traditional experiments using hormone manipulation, and highlight the necessity of investigating the individual functions of each TR variant. These data suggest that the induction of TSH in hypothyroidism is not merely a passive mechanism of de‐repression in the absence of TH, and that TRα1 serves an important role in this process.
Furthermore, whereas TSHα RNA is reduced, there is the opposite effect on the TSHβ subunit gene, which displays a slightly increased RNA level in TRα1−/− mice. Taken together with the findings in TRβ−/− mice (Forrest et al., 1996a), a dynamic picture emerges in which individual TR variants are likely to mediate distinct aspects of positive and negative regulation of TSH expression, possibly involving differential regulation of the two TSH subunit genes in the case of the TRα1 isoform.
Although in the absence of TRα1 there may be complex underlying mechanisms of regulation, the net outcome is that serum TSH levels are only slightly reduced below normal. The fact that the elevated expression of TSHβ RNA fails to result in elevation of serum TSH suggests that there is no corresponding increase in secreted protein or that elevation of serum TSH levels cannot occur without a concomitant increase in TSHα subunit expression. The modest reduction of serum TSH is consistent with the mild hypothyroidism observed. This is further supported by our analyses of the thyroid glands from the TRα −/− mice, which revealed no abnormalities indicative of gross aberrations of the TSH response.
Cardiac function
The bradycardia of the TRα1 −/− mice could theoretically be interpreted as being due to genes specific to the 129 strain of mice used for generation of the ES cells (Gerlai, 1996). When located in the vicinity of the targeted TRα locus, such genes would be inherited along with the mutated gene in the −/− mice, but not the control mice that had been bred from Trα1 +/− mice (Gerlai, 1996). However, our experiments rule out this possibility, since mice of the 129 strain as well as mice deficient for expression of the rev‐erbAα gene do not exhibit bradycardia (C.Johansson and P.Chomez, data not shown), thus indicating that traits specific to the 129 strain cause the low heart rate. The observation that the heart rate increased in the TRα1 −/− mice upon T3 treatment indicates that TRβ can also affect heart rate via indirect mechanisms, by affecting pacemaking functions other than those of TRα1 or by substituting for TRα1 in certain aspects. The latter views are supported by our finding that both receptor isoforms are expressed in the mouse heart (A.Mansén and B.Vennström, unpublished).
The reason for the bradycardia in the TRα1 −/− mice is at present unclear. The intrisic heart rate is set by the cardiac sinoatrial node, and positive or negative stimulation is mediated by the sympathetic and vagal nervous systems respectively. A close examination of the functions of the above tissues will be required, including the expression of β‐adrenergic and muscarinic receptors that mediate effects of the sympathetic and parasympathetic nervous systems (Dillmann, 1996). It is also possible that the lack of TRα1 has perturbed the expression of ion channels and pumps. The pacemaker function is dependent on an unstable resting membrane potential, which generates the action potential necessary for depolarization across the atria. TH is known to induce the cardiac Na–K ATPase, and to concomitantly downregulate the Na+–Ca2+ exchanger (Magyar et al., 1995; Dillmann, 1996). The role of these two activities in the pacemaker function is unclear, although it is known that the sympathetic stimulus affects heart rate by causing an inward current of Na+ and Ca2+ ions (DiFranceso, 1993). A further understanding of how TRα1 causes bradycardia will thus require localization of TR expression in the different regions of the heart.
The electrocardiograms in the TRα1 −/− mice revealed prolonged QTend and QRS durations, a phenomenon similar to that seen in hypothyroid rat myocytes (Shimoni and Severson, 1993) and hypothyroid patients (Dillmann, 1996). The QTend duration is indicative of a slower ventricular repolarization, a phenomenon not normally associated with bradycardia in patients. The TRα1 −/− mice had been treated with T3, and our data therefore indicate that TRα1 is involved in regulating the ion currents mediating the ventricular repolarization. A multitude of Na+, Ca2+ and K+ ion channels and transporters are involved in regulating heart activity (Warmke and Ganetsky, 1994; Shimoni and Severson, 1995). Our unpublished data have, however, revealed that none of the well known TR target genes in the heart (sarcoplasmic Ca ATPase, Na–K ATPase, β‐adrenergic receptors) is dysregulated in the TRα1−/− mice (A.Mansén, C.Johansson and B.Vennström). Identification of novel cardiac target genes for TRs, and detailed electrophysiological studies on isolated cardiac myocytes from different TR‐deficient mice, will therefore be instrumental for dissecting the mechanism(s) by which thyroid hormones affect heart function.
Other physiological parameters
Our results also show that TRα1 deficiency leads to a reduction in body temperature of 0.5°C. Extreme hypothyroidism caused by thyroidectomy of rats causes a major reduction in body temperature, usually of several degees (Guernsey and Edelman, 1983). It is therefore possible that TRβ in addition to TRα plays a role in thermogenesis in brown fat or in other metabolic processes. The mice have normal amounts of brown adipose tissue, suggesting that the reduced body temperature is due to perturbed metabolic processes rather than aberrant tissue development. Moreover, since the TRα1 −/− mice were as active as the control mice, the data suggest that the hypothermia is due to the absence of TRα1 and not to differences in locomotor activity.
TRα1 and disease
Important clues to the function of TRβ have been provided by the >50 families with GRTH. Patients with a lack of TRβ expression display high TH and TSH levels and a loss of hearing (Refetoff et al., 1967; Forrest et al., 1996a, b). GRTH patients with the transdominant‐negative version of the receptor often have elevated levels of TH, growth and mental retardation and tachycardia. Their TSH levels are surprisingly normal, resulting from the inability of the mutant receptor to downregulate the TSH genes. Taken together, these results suggest that TRβ has important roles in cells of neuronal and neuroendocrine origin.
Only one indication of a specific role for TRα1 has emerged from the studies of GRTH patients. The combination of tachycardia and elevated TH levels in patients carrying a transdominant‐negative version of TRβ is compatible with the absence of the mutant TRβ but the presence of TRα expression in the cardiac tissue that regulates heart rate. Our study identifies specific functions for TRα1, namely in regulation of the pacemaker function and in ventricular repolarization. The TRα1 −/− mice thus provide a unique model for identification of TH regulation of ion currents in isolated cardiac pacemaker and contractile cells. The data also suggest that searches for TH agonists or antagonists for use in treating cardiac dysfunction should be targeted towards TRα1.
The fact that no patients with mutant TRα genes have been found had resulted in the hypothesis that TRα1 was indispensable. However, our data demonstrate the contrary: the mice are fertile, do not exhibit any gross deficiencies and appear to be only mildly hypothyroid. At first hand, it is puzzling that no patients with defective TRα genes have been found. However, our data raise the possibility that patients with defective TRα1 genes could have subnormal levels of TH and TSH which would contrast with the hallmarks of GRTH. The analysis of the TRα1 −/− mice potentially offers important clues to the identification of patients with mutant TRα genes.
Materials and methods
Targeting vector
We designed a targeting strategy that would ablate only TRα1 expression and leave that of TRα2 intact. The two proteins arise from alternative splicing which generates proteins with different carboxy termini (Figure 1A). TRα1 is encoded by exons 1–9, whereas TRα2 results from alternative splicing from a donor site present 128 bp after the start of exon 9 (here referred to as exon 9a) to an acceptor site for exon 10. This alternative splicing event replaces the 40 C‐termial amino acids encoded by TRα1 with 120 amino acids specific for TRα2. A targeted disruption of any of the exons 1–9a would consequently ablate both receptor variants, whereas deletion of nucleotides in exon 9, which are after the splice site (here referred to as exon 9b), would selectively disrupt TRα1. However, the orphan hormone receptor rev‐erbAα is encoded by the opposite strand of the TRα locus and its last coding exon overlaps exon 10 of the TRα locus (Figure 1A). Therefore, the targeting construct was designed as shown in Figure 1A so that (i) the coding sequence specific to TRα1was removed, (ii) the production of a TRα2 mRNA with a normal coding sequence was possible, and (iii) the region of the TRα exon 10 which overlaps the rev‐erbAα locus was undisturbed.
The targeting vector was made from two independent phage λ clones which contained a total of 19 kb of 3′ TRα locus from the FVB mouse strain. A 6.6 kb _Bgl_II fragment, including the region of TRα from intron 7 to exon 10, was isolated and subcloned into the SP70 vector (Promega). A _Sca_I site in the 3′ UT region of exon 9 was converted into a _Sal_I site. To change exon 9a+b to an exon encoding 9a + exon 10, RT–PCR was performed on poly(A) selected RNA from mouse brain using polyd(T) as the reverse primer. The PCR primers had sequences encoding a _Sal_I site followed by a sequence corresponding to either the beginning of exon 9 (5′SAL) (5′‐GGAGTCGACCGAGAAGAGTCAGGAG‐3′) or the 3′ UT region of exon 10, 47 nucleotides after the stop codon (3′SAL) (5′‐GCTACTCCTTCTCCCGTCGACAAC‐3′). The resulting PCR product (9a+10) was purified and cloned into pGEM 3Zf(+) vector at a _Sal_I site (pGEM 9a+10) and sequenced. The 1100 bp sequence just upstream of the splice donor site in exon 9 to part of the 3′ UT region after exon 9 was excised from the pSP70_Bgl_II vector containing the genomic fragment by cleavage with _Stu_I and _Sal_I, and replaced with the _Stu_I–_Sal_I fragment of pGEM 9a+10, containing exon 9a downstream of the _Stu_I site and exon 10, 47 bp after the stop codon. This yielded the clone pmTRαex9a+10. To allow for selection and proper processing, the SV40 poly(A) signal was cloned into the _Bam_HI site of pMCneo/poly(A) (Stratagene). _Sal_I/_Xho_I digestion released the fused SV40‐neomycin selectable marker, which was cloned into the _Sal_I site of pmTRαex9a+10 to give a targeting vector with the neomycin transcriptional unit in the opposite orientation. All molecular manipulations were done according to standard procedures (Bensen‐Chanda, 1995).
Probes
The 5′ probe (5′p) was isolated by restriction digestion using the _Bam_HI site in the plasmid intermediate and a _Kpn_I site in the clone. The 3′ probe (3′p) corresponds to a _Bam_HI–_Hind_III fragment distal to exon 10. The exon 10 probe (ex10) was generated by PCR using a 5′ primer with the sequence GCGGAATTCAAGCTTTGGGGAAGACGACAGCAGTG (the underlined portion represents 1377–1401 of mTRα2 cDNA) and the 3′SAL primer described above to generate the PCR fragment used in the targeting construct. The 568 bp internal probe (int) was generated by PCR using a 5′ primer specific to exon 8 (nucleotides 961–980 in the mouse cDNA) and a 3′ primer corresponding to the beginning of exon 9 (nucleotides 1002–1024 in the mouse cDNA).
ES cells
E14 ES cells were grown on mitomycin C‐treated primary mouse embryo fibroblasts from neomycin‐resistant mice and grown in standard ES media (Muller et al., 1991) supplemented with 1000 U/ml leukemia inhibitory factor. The targeting vector was electroporated (BioRad Gene Pulser at 250 V, 960 mF) into ES cells after cleavage with _Bgl_II. Neomycin‐resistant (375 μg/ml G418) clones were screened for homologous recombination events by Southern blotting, after digestion with _Bam_HI, and hybridized with the 5′ probe. Three clones that had undergone homologous recombination were identified. The accuracy of the recombination was assessed by Southern blot analyses (Figure 1B). DNA was digested with _Bam_HI which generated a 23 kb fragment from the normal locus. In contrast, the recombined locus has two _Bam_HI sites 226 bp apart which divides the 23 kb fragment into a 13 kb 5′ fragment and a 9.9 kb 3′ fragment. The filter was hybridized consecutively with four different probes: (i) an internal probe (denoted ex10 in Figure 1A) specific for exon 10 sequences, (ii) a 5′ probe (5′p) which recognizes sequences 5′ to the targeting vector, (iii) an internal probe (int) detecting the 5′ half of the recombined locus and (iv) a 3′ probe (3′p) recognizing sequences 3′ to the targeting vector. As shown in Figure 1B, the ex10 probe detects, as expected, one 23 kb band (indicated by an open arrowhead) in DNA from control cells (even numbered lanes), whereas the targeted ES cell DNA (odd numbered lanes) gave three fragments corresponding to the 13 and 9.9 kb fragments from the recombined gene, in addition to the 23 kb normal allele. Moreover, the ex10 probe gave no extra bands, indicating that no additional, non‐homologous integration had occurred. Hybridization with the 5′ and 3′ probes detected the 23 kb normal allele and the 13 kb and 9.9 kb recombined alleles, respectively. To verify that the 5′ and 3′ recombination sites remained intact, the DNA was digested with _Stu_I or _Xba_I and probed with the internal probe for analysis of the 5′ event and with the ex10 probe for the 3′. The appropriate recombination gave one band with the 5′ probe and two bands with the 3′ probe, as expected (Figure 1B). We conclude that an accurate homologous recombination had occurred.
Generation of mice
Blastocysts from C57bl females were collected to generate the transgenic mice, injected with ES cells and implanted into pseudopregnant F1(B6CBA) females. Male offspring with coat color chimerism were bred with _Bal_bC females, and germline transmission was scored by coat color. Trα1 +/− mice were identified by PCR and were then interbred to obtain homozygotes. DNA was prepared from tail clips as described (Laird et al., 1991), and analyzed by PCR using the 5′SAL primers described above or by Southern blotting using the 5′p probe. The 3′ primers were different for each paired reaction. The 3′ primer (3′rvTRα1) corresponds to nucleotides 1349–1362 of mTRα1 cDNA and the 3′ primer (3′SV40) corresponds to the sequence 5′‐ACCACAACTCGAATGCAGTG‐3′ of the SV40 poly(A) tail. All three ES lines that had undergone homologous recombination yielded viable mice homozygous for deletion of TRα1.
Analysis of RNA
RT–PCR was done using polyd(T) as a primer for cDNA synthesis. The 5′ primer, 5′SAL, and 3′ primers, 3′ rvTRα1 and 3′SV40 are described above. In addition, a primer specific for the most 3′ end of exon 10, called 3′ex.10 (5′‐GAACCAAGTAAGCACAGACGAC‐3′) was used to identify wild‐type TRα2. Polyadenylated RNA (5 μg/lane) was used for Northern blotting. Filters were hybridized with a full length mouse TRα1 cDNA probe which recognizes both TRα isoforms. cDNA clones for detecting the TSHα and ‐β RNAs were prepared from the respective cDNA clones (Gurr and Kourides, 1984).
Hormone assays
The serum from 2‐ to 4‐month‐old males was used to determine levels of free T3 and T4 using a commercially available, direct competitive radioimmunoassay from Amersham (Amerlex‐MAB FT3 and FT4 Kit). Serum from 4‐month‐old males was used for the determination of TSH levels with a specific mouse TSH radioimmunoassay using a mouse TSH/LH reference preparation (AFP51718mp), a mouse TSH antiserum (AFP98991), and rat TSH antigen for radio‐iodination (NIDDK‐rTSH‐I‐9). All reagents were obtained from Dr A.F.Parlow (Harbor University of California at Los Angeles Medical Center, Torrance, CA). 25 μl serum in triplicate determinations were used for the radioimmunoassay. The limit of sensitivity was 0.6 ng and the intra‐assay variation <6%. Full details will be published elsewhere.
Telemetry
The telemetric device and its sensors for ECG (Data Sciences) were implanted as described previously (Johansson and Thorén, 1997). Monitoring of physiological parameters was initiated 7 days after the operation. The recordings were done continuously for up to 14 days in unstressed, freely moving mice kept in a separate animal room. All TH injections were subcutaneous. QRS and QTend durations were calculated from computer‐averaged ECG recordings by manual placing of cursors. The QTend was defined as the timepoint at which the T‐wave reached the isoelectric line.
References
- Bensen‐Chanda V (1995) Current Protocols in Molecular Biology. John Wiley and sons, Inc.
Google Scholar - DiFrancesco D (1993) Pacemaker mechanisms in cardiac tissue. Annu Rev Physiol, 55, 455–472.
Google Scholar - Dillman WH (1996) Thyroid hormone and the heart: basic mechanistic and clinical issues. Thyroid, 19, 1–11.
Google Scholar - Forrest D (1994) The erbA/thyroid hormone receptor genes in development of the central nervous system. Semin Cancer Biol, 5, 167–176.
Google Scholar - Forrest D, Hanebuth E, Smeyne RJ, Everds N, Stewart CL, Wehner JM and Curran T (1996a) Recessive resistance to thyroid hormone in mice lacking thyroid hormone receptor beta: evidence for tissue‐specific modulation of receptor function. EMBO J, 15, 3006–3015.
Google Scholar - Forrest D, Erway LC, Ng L, Altschuler R and Curran T (1996b) Thyroid hormone receptor beta is essential for development of auditory function. Nature Genet, 13, 354–357.
Google Scholar - Freake HC and Oppenheimer JH (1995) Thermogenesis and thyroid function. Annu Rev Nutr, 15, 263–291.
Google Scholar - Gerlai R (1996) Gene‐targeting studies of mammalian behavior: is it the mutation or the background phenotype? Trends Neurosci, 19, 177–181.
Google Scholar - Guernsey DL and Edelman IS (1983) Regulation of thermogenesis by thyroid hormone. In Oppenheimer,J.H. and Samuels,H.H. (eds), Molecular Basis of Thyroid Hormone Action. Academic Press, New York.
Google Scholar - Gurr JA and Kourides IA (1984) Ratios of alpha to beta TSH mRNA in normal and hypothyroid pituitaries and TSH‐secreting tumors. Endocrinol, 115, 830–832.
Google Scholar - Johansson C and Thorén P (1997) The effects of triidothyronine (T3) on heart rate, temperature and ECG measured with telemetry in freely moving mice. Acta Physiol Scand, 160, 133–138.
Google Scholar - Katz D, Reginato MJ and Lazar MA (1995) Functional regulation of thyroid hormone receptor variant TR alpha 2 by phosphorylation. Mol Cell Biol, 15, 2341–2348.
Google Scholar - Koenig RJ, Lazar MA, Hodin RA, Brent GA, Larsen PR, Chin WW and Moore DD (1989) Inhibition of thyroid hormone action by a non‐hormone binding c‐erbA protein generated by alternative mRNA splicing. Nature, 337, 659–661.
Google Scholar - Laird PW, Zijderveld A, Linders K, Rudnicki MA, Jaenisch R and Berns A (1991) Simplified mammalian DNA isolation procedure. Nucleic Acids Res, 19, 4293.
Google Scholar - Lazar MA, Hodin RA, Darling DS and Chin WW (1988) Identification of a rat c‐erbA alpha‐related protein which binds deoxyribonucleic acid but does not bind thyroid hormone. Mol Endocrinol, 2, 893–901.
Google Scholar - Lazar MA, Hodin RA, Darling DS and Chin WW (1989) A novel member of the thyroid/steroid hormone receptor family is encoded by the opposite strand of the rat c‐erbA alpha transcriptional unit. Mol Cell Biol, 9, 1128–1136.
Google Scholar - Magyar CE, Wang J, Azuma KK and McDonough AA (1995) Reciprocal regulation of cardiac Na‐K‐ATPase and Na/Ca exchanger: hypertension, thyroid hormone, development. Am J Physiol, 269, C675–82.
Google Scholar - Mitsuhashi T, Tennyson G and Nikodem V (1988) Nucleotide sequence of novel cDNAs generated by alternative splicing of a rat thyroid hormone receptor gene transcript. Nucleic Acids Res, 24, 16(12):5697.
Google Scholar - Miyajima N, Horiuchi R, Shibuya Y, Fukushige S, Matsubara K, Toyoshima K and Yamamoto T (1989) Two erbA homologs encoding proteins with different T3 binding capacities are transcribed from opposite DNA strands of the same genetic locus. Cell, 57, 31–39.
Google Scholar - Muller W, Kuhn R and Rajewsky K (1991) Major histocompatibility complex class II hyperexpression on B cells in interleukin 4‐transgenic mice does not lead to B cell proliferation and hypergammaglobulinemia. Eur J Immunol, 21, 921–925.
Google Scholar - Refetoff S (1994) Resistance to thyroid hormone: an historical overview. Thyroid, 4, 345–349.
Google Scholar - Refetoff S, DeWind LT and DeGroot L (1967) Familial syndrome combining deaf mutism, stippled epiphyses, goiter, and abnormally high PBI: possible target organ refractoriness to thyroid hormone. J Clin Endocrinol Metab, 27, 279–294.
Google Scholar - Refetoff S, Weiss RE and Usala SJ (1993) The syndromes of resistance to thyroid hormone. Endocr Rev, 14, 348–399.
Google Scholar - Shimoni Y and Severson DL (1995) Thyroid status and potassium currents in rat ventricular myocytes. Am J Physiol, 268 (Heart and Circ. Physiol. 37), H576–H583.
Google Scholar - Silva JE (1995) Thyroid hormone control of thermogenesis and energy balance. Thyroid, 5, 481–492.
Google Scholar - Takeda K, Sakurai A, DeGroot LJ and Refetoff S (1992) Recessive inheritance of thyroid hormone resistance caused by complete deletion of the protein‐coding region of the thyroid hormone receptor‐beta gene. J Clin Endocrinol Metab, 74, 49–55.
Google Scholar - Usala SJ et al. (1991) A homozygous deletion in the c‐erbA beta thyroid hormone receptor gene in a patient with generalized thyroid hormone resistance: isolation and characterization of the mutant receptor. Mol Endocrinol, 5, 327–335.
Google Scholar - Warmke JW and Ganetzky B (1994) A family of potassium channel genes related to eag in Drosophila and mammals. Proc Natl Acad Sci USA, 941, 3438–3442.
Google Scholar