FGF-2 Antagonizes the TGF-β1-Mediated Induction of Pericyte α-Smooth Muscle Actin Expression: A Role for Myf-5 and Smad-Mediated Signaling Pathways | IOVS (original) (raw)

November 2003
Volume 44, Issue 11
Figure 1.

FGF-2 and TGF-β1 modulated pericyte growth and contractile phenotype. Proliferation assays were performed in triplicate 24-well plates over a 4-day time course. FGF-2, FGF-2+heparin, TGF-β1, or serum alone was added, and the number of cells was counted directly. The mean counts ± SE from triplicate wells and several experiments (n > 6) are shown.
Figure 1.
FGF-2 and TGF-β1 modulated pericyte growth and contractile phenotype. Proliferation assays were performed in triplicate 24-well plates over a 4-day time course. FGF-2, FGF-2+heparin, TGF-β1, or serum alone was added, and the number of cells was counted directly. The mean counts ± SE from triplicate wells and several experiments (n > 6) are shown.
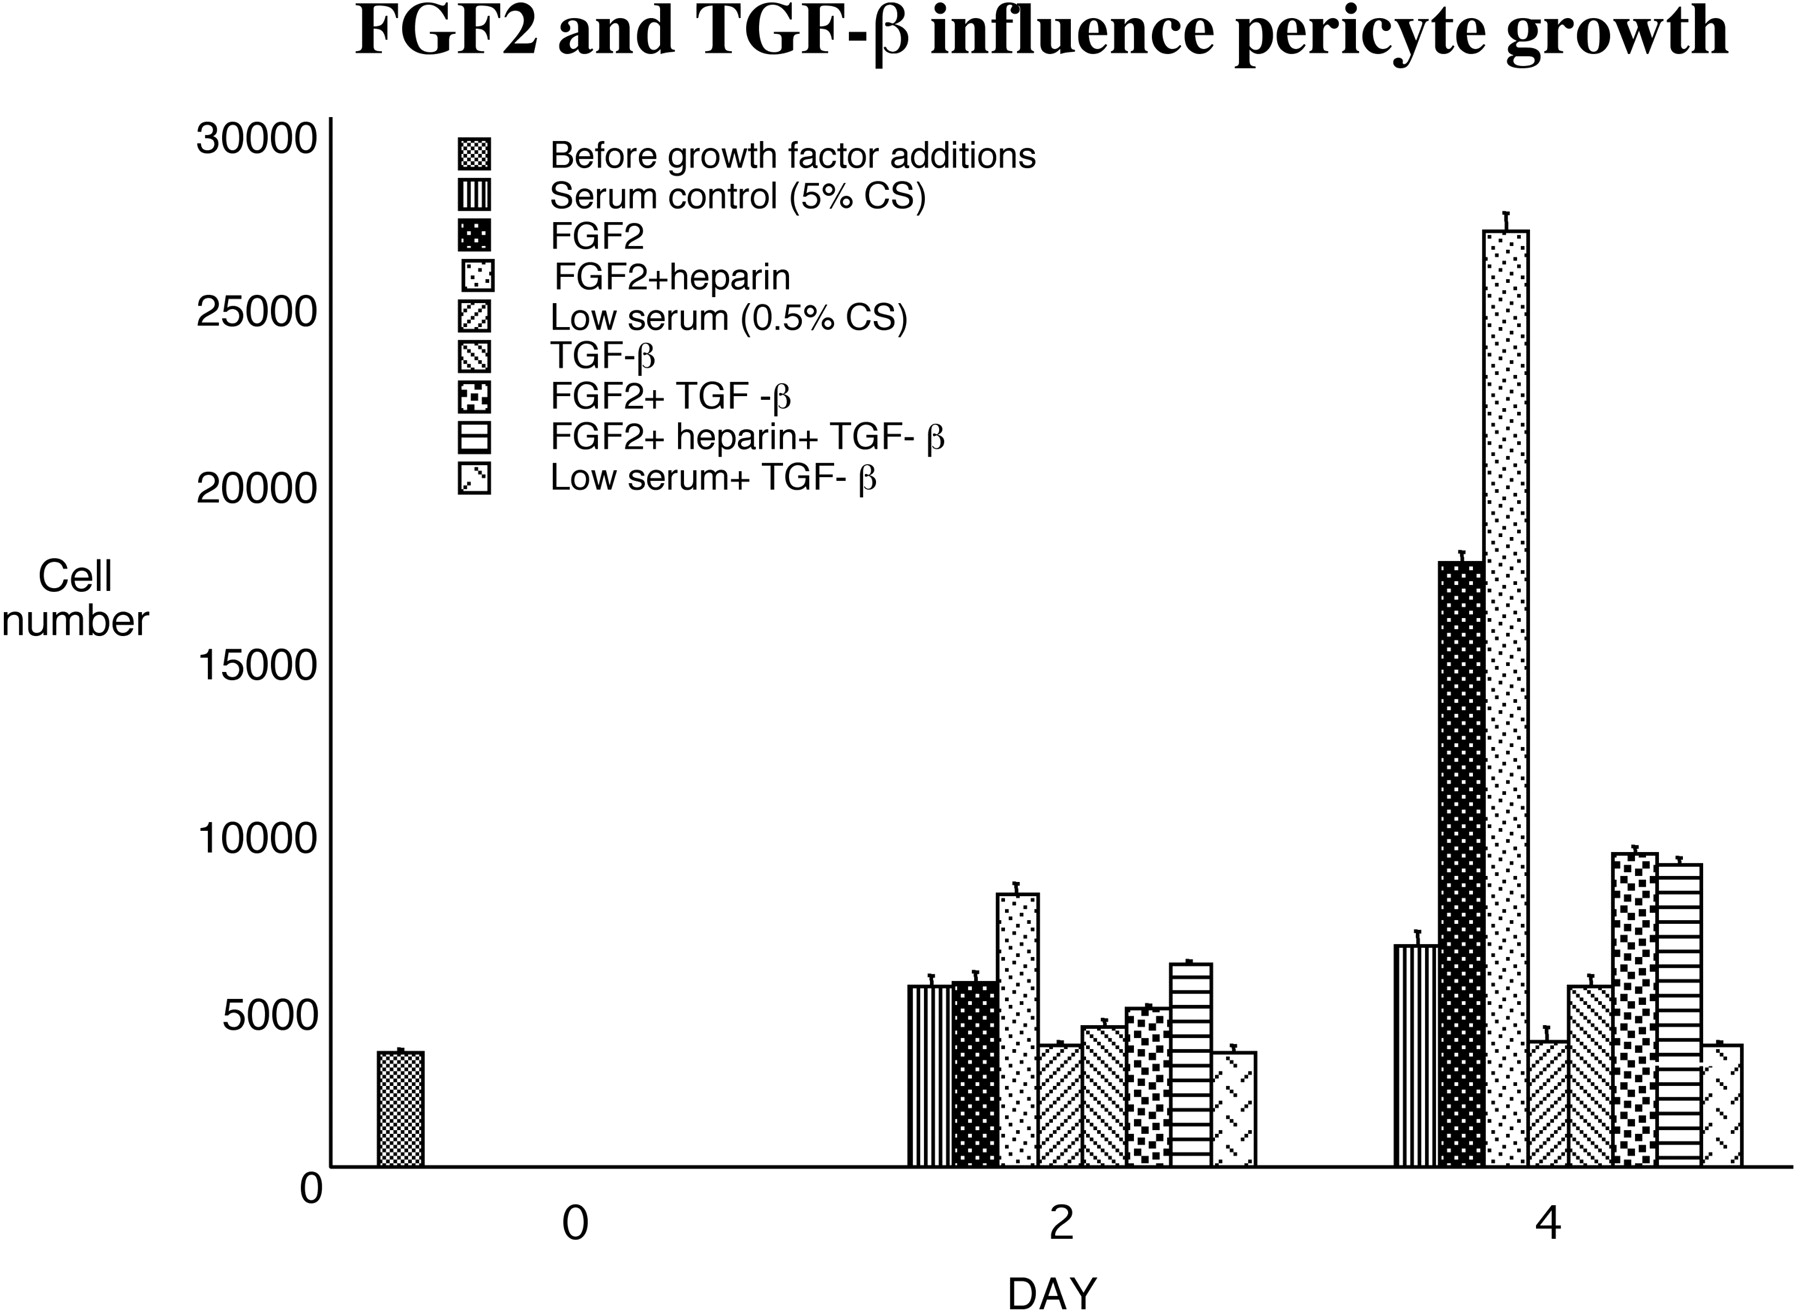
Figure 2.

Addition of TGF-β1 induced pericyte expression of α-SMA. Shown are bovine retinal pericytes cultured as described and stained for α-SMA, after being grown in DMEM with 10% serum (A) or in low serum in the presence of 1 ng/mL TGF-β (B), which caused an increase in the formation of α-SMA-containing stress fibers.
Figure 2.
Addition of TGF-β1 induced pericyte expression of α-SMA. Shown are bovine retinal pericytes cultured as described and stained for α-SMA, after being grown in DMEM with 10% serum (A) or in low serum in the presence of 1 ng/mL TGF-β (B), which caused an increase in the formation of α-SMA-containing stress fibers.
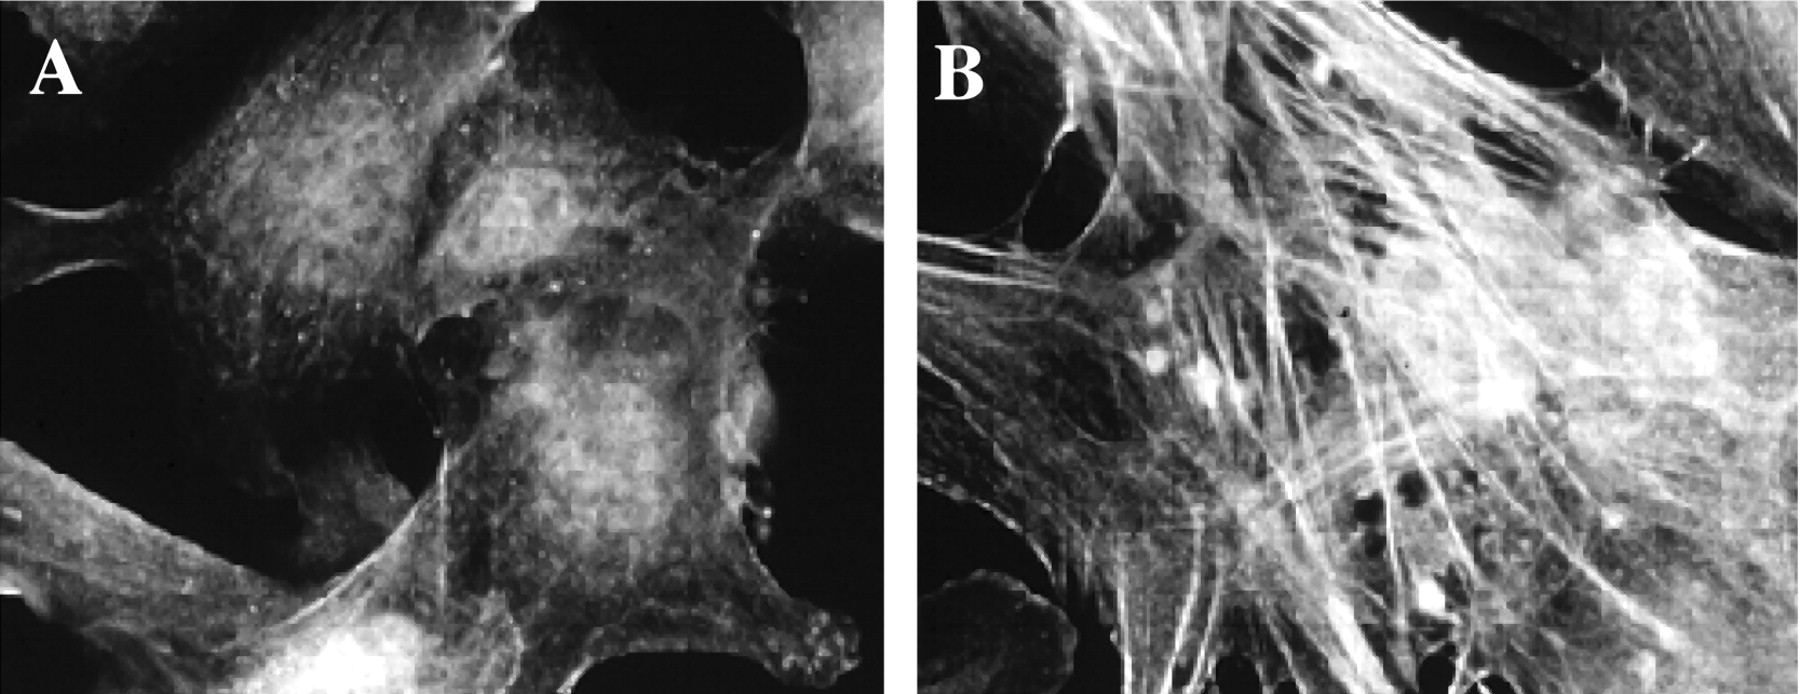
Figure 3.
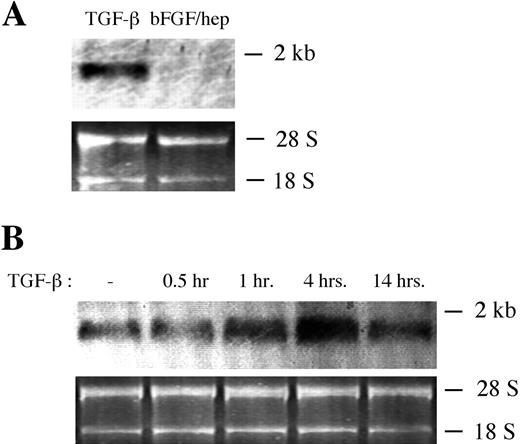
TGF-β1 induced an increase in α-SMA mRNA in retinal pericytes. Bovine retinal pericytes were cultured in 10% bovine calf serum/DMEM and were downshifted to 0.01% serum/DMEM for 48 hours. (A) Downshifted pericytes were cultured in the presence of either 1 ng/mL TGF-β1 or 5 ng/mL FGF-2+1 mg/mL heparin for 3 hours, and Northern blot analysis was performed on approximately 1 mg of RNA from each condition, using a 32P-labeled probe specific for α-SMA. (B) The cells were then cultured in the presence of 1 ng/mL TGF-β1 for the indicated lengths of time, and Northern blot analysis was performed, as in (A).
Figure 3.
TGF-β1 induced an increase in α-SMA mRNA in retinal pericytes. Bovine retinal pericytes were cultured in 10% bovine calf serum/DMEM and were downshifted to 0.01% serum/DMEM for 48 hours. (A) Downshifted pericytes were cultured in the presence of either 1 ng/mL TGF-β1 or 5 ng/mL FGF-2+1 mg/mL heparin for 3 hours, and Northern blot analysis was performed on approximately 1 mg of RNA from each condition, using a 32P-labeled probe specific for α-SMA. (B) The cells were then cultured in the presence of 1 ng/mL TGF-β1 for the indicated lengths of time, and Northern blot analysis was performed, as in (A).

Figure 4.

Proteins from TGF-β1-treated retinal pericytes bind the α-SMA promoter. (A) Bovine retinal pericytes were cultured in 5% serum+5 ng/mL FGF-2+1 μg/mL heparin for 48 hours. The cells were then washed and treated with 1 ng/mL TGF-β1 for the times indicated. Nuclear lysates were incubated with the 32P-labeled α-SMA promoter fragment p125, and DNA complexes were separated on 4.5% polyacrylamide gels by native-PAGE. Where indicated, reactions included a 100× molar excess of unlabeled promoter fragment p125. Arrowhead: free probe; arrow: shifted complex. (B) EMSA was performed as in (A), but pericytes were first incubated in 10% serum+5 ng/mL FGF-2+1 μg/mL heparin, and nuclei from pericytes treated with 1 ng/mL TGF-β1 for 30 minutes were incubated with the indicated 23P-labeled α-SMA promoter fragments. Where indicated, reactions included a 100× molar excess of unlabeled specific promoter fragment. Arrowhead: free probe. (C) EMSA was performed as in (B), but reactions included a 100× molar excess of the unlabeled nonspecific promoter fragment indicated. Arrow and arrowhead in (B) and (C) show band shifts created by probes 30 to 59 and 90 to 125, respectively, that were not completely competed by excess E-box1.
Figure 4.
Proteins from TGF-β1-treated retinal pericytes bind the α-SMA promoter. (A) Bovine retinal pericytes were cultured in 5% serum+5 ng/mL FGF-2+1 μg/mL heparin for 48 hours. The cells were then washed and treated with 1 ng/mL TGF-β1 for the times indicated. Nuclear lysates were incubated with the 32P-labeled α-SMA promoter fragment p125, and DNA complexes were separated on 4.5% polyacrylamide gels by native-PAGE. Where indicated, reactions included a 100× molar excess of unlabeled promoter fragment p125. Arrowhead: free probe; arrow: shifted complex. (B) EMSA was performed as in (A), but pericytes were first incubated in 10% serum+5 ng/mL FGF-2+1 μg/mL heparin, and nuclei from pericytes treated with 1 ng/mL TGF-β1 for 30 minutes were incubated with the indicated 23P-labeled α-SMA promoter fragments. Where indicated, reactions included a 100× molar excess of unlabeled specific promoter fragment. Arrowhead: free probe. (C) EMSA was performed as in (B), but reactions included a 100× molar excess of the unlabeled nonspecific promoter fragment indicated. Arrow and arrowhead in (B) and (C) show band shifts created by probes 30 to 59 and 90 to 125, respectively, that were not completely competed by excess E-box1.
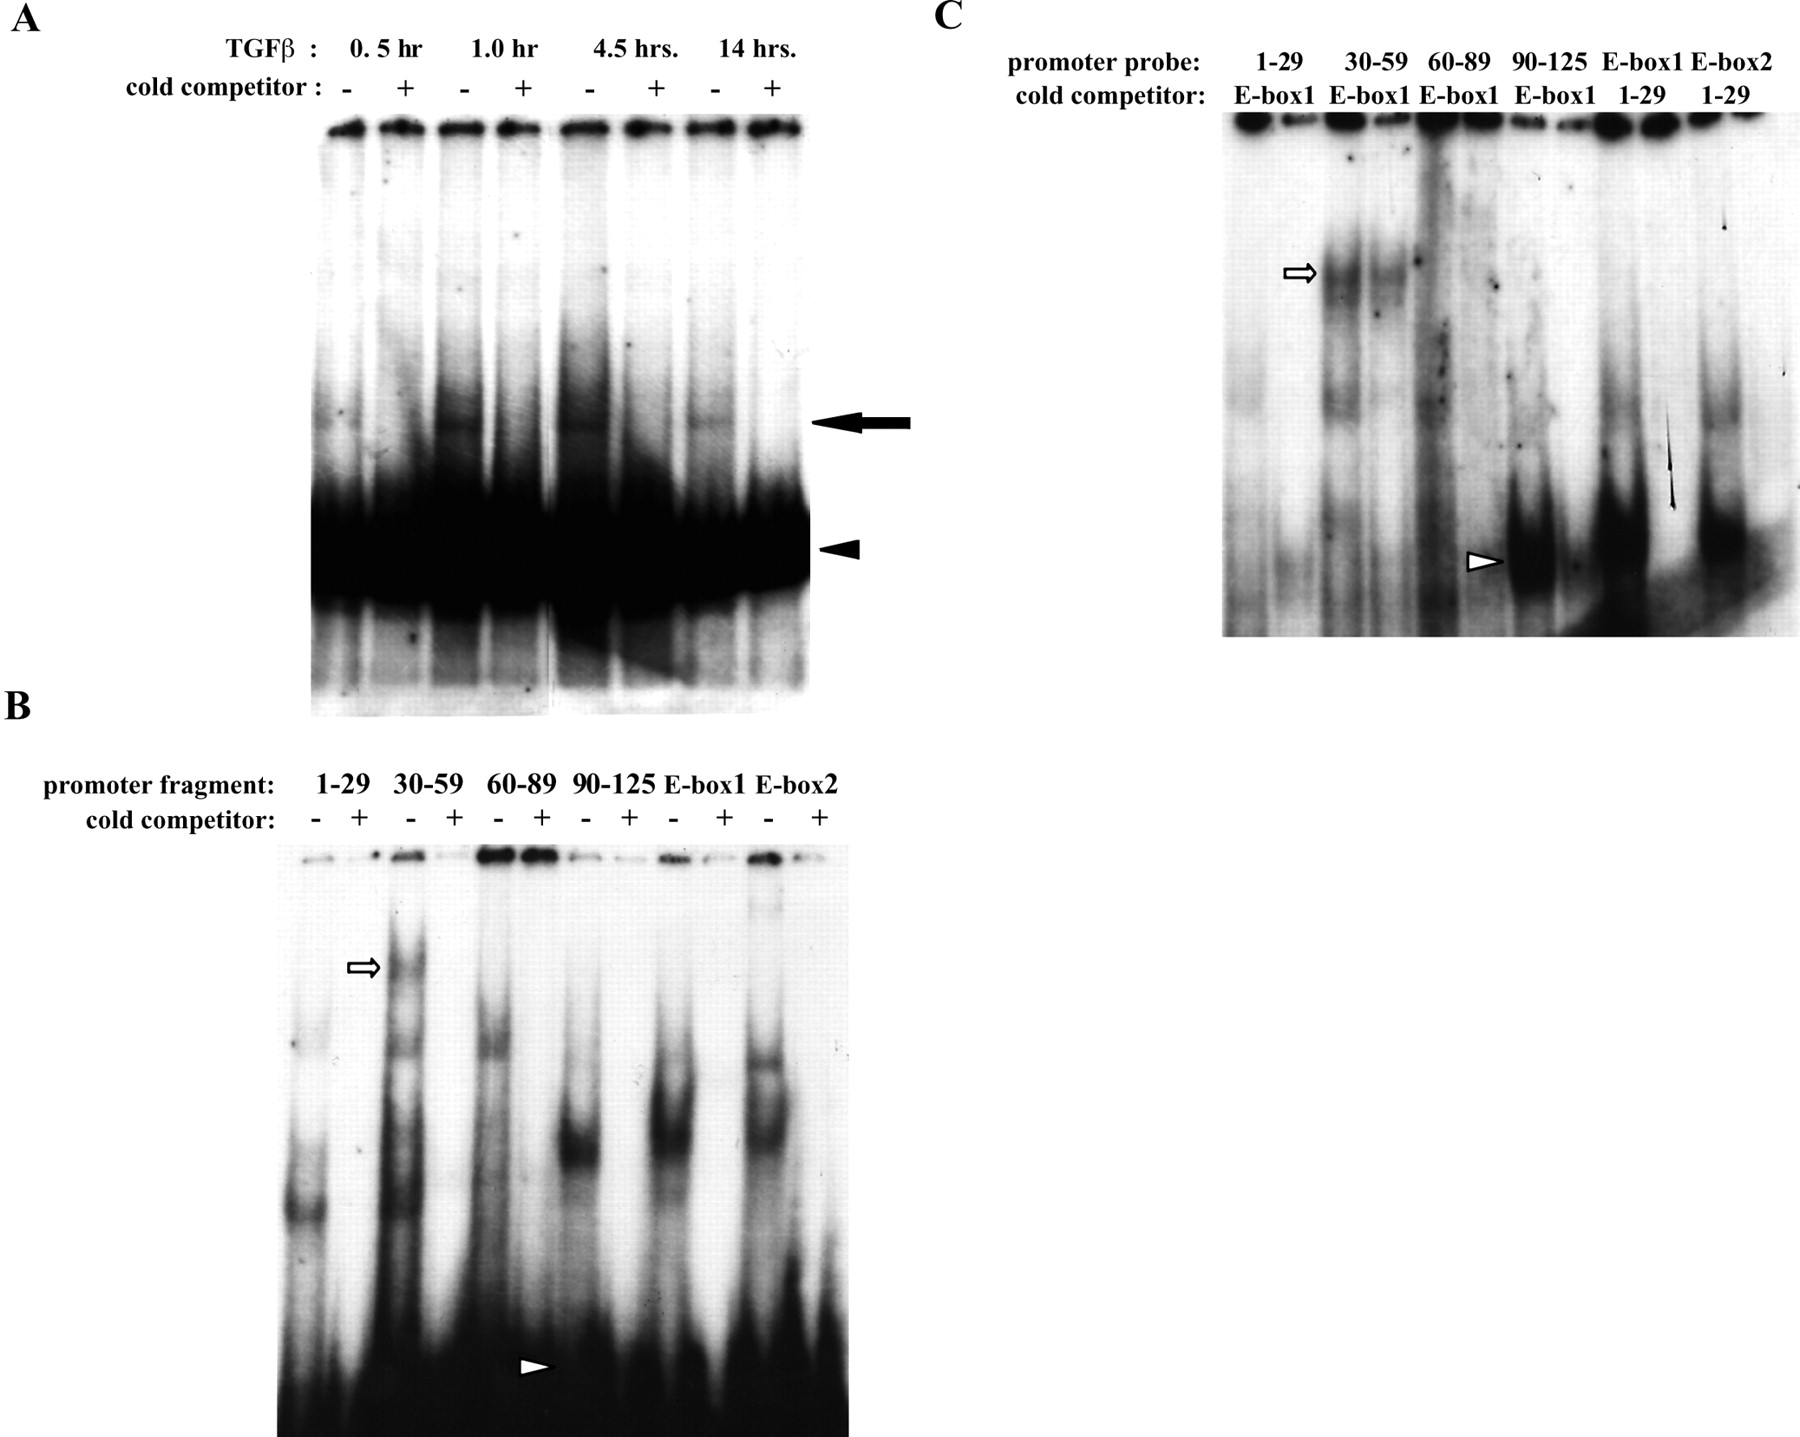
Figure 5.

Myf-5 induction coincides with pericyte growth-arrest. Primers were designed, RNA purified and RT-PCR. Top: myf-5; bottom: β-actin. Lane 1: 100 bp ladder; lane 2: 10% calf serum; lane 3: FGF-2; lane 4: FGF-2 treatment before growth factor and serum withdrawal (0.2%); lane 5: FGF-2+heparin; lane 6: FGF-2+heparin treatment before growth factor and serum withdrawal; lane 7: endothelial cells; lane 8: vascular smooth muscle cells. Note the induction of the myf-5 PCR product (732 bp) after the withdrawal of FGF-2 or FGF-2 and heparin. Neither endothelial cells nor smooth muscle cells expressed myf-5. β-Actin control shows 373-bp PCR product. Ethidium bromide staining.
Figure 5.
Myf-5 induction coincides with pericyte growth-arrest. Primers were designed, RNA purified and RT-PCR. Top: myf-5; bottom: β-actin. Lane 1: 100 bp ladder; lane 2: 10% calf serum; lane 3: FGF-2; lane 4: FGF-2 treatment before growth factor and serum withdrawal (0.2%); lane 5: FGF-2+heparin; lane 6: FGF-2+heparin treatment before growth factor and serum withdrawal; lane 7: endothelial cells; lane 8: vascular smooth muscle cells. Note the induction of the myf-5 PCR product (732 bp) after the withdrawal of FGF-2 or FGF-2 and heparin. Neither endothelial cells nor smooth muscle cells expressed myf-5. β-Actin control shows 373-bp PCR product. Ethidium bromide staining.
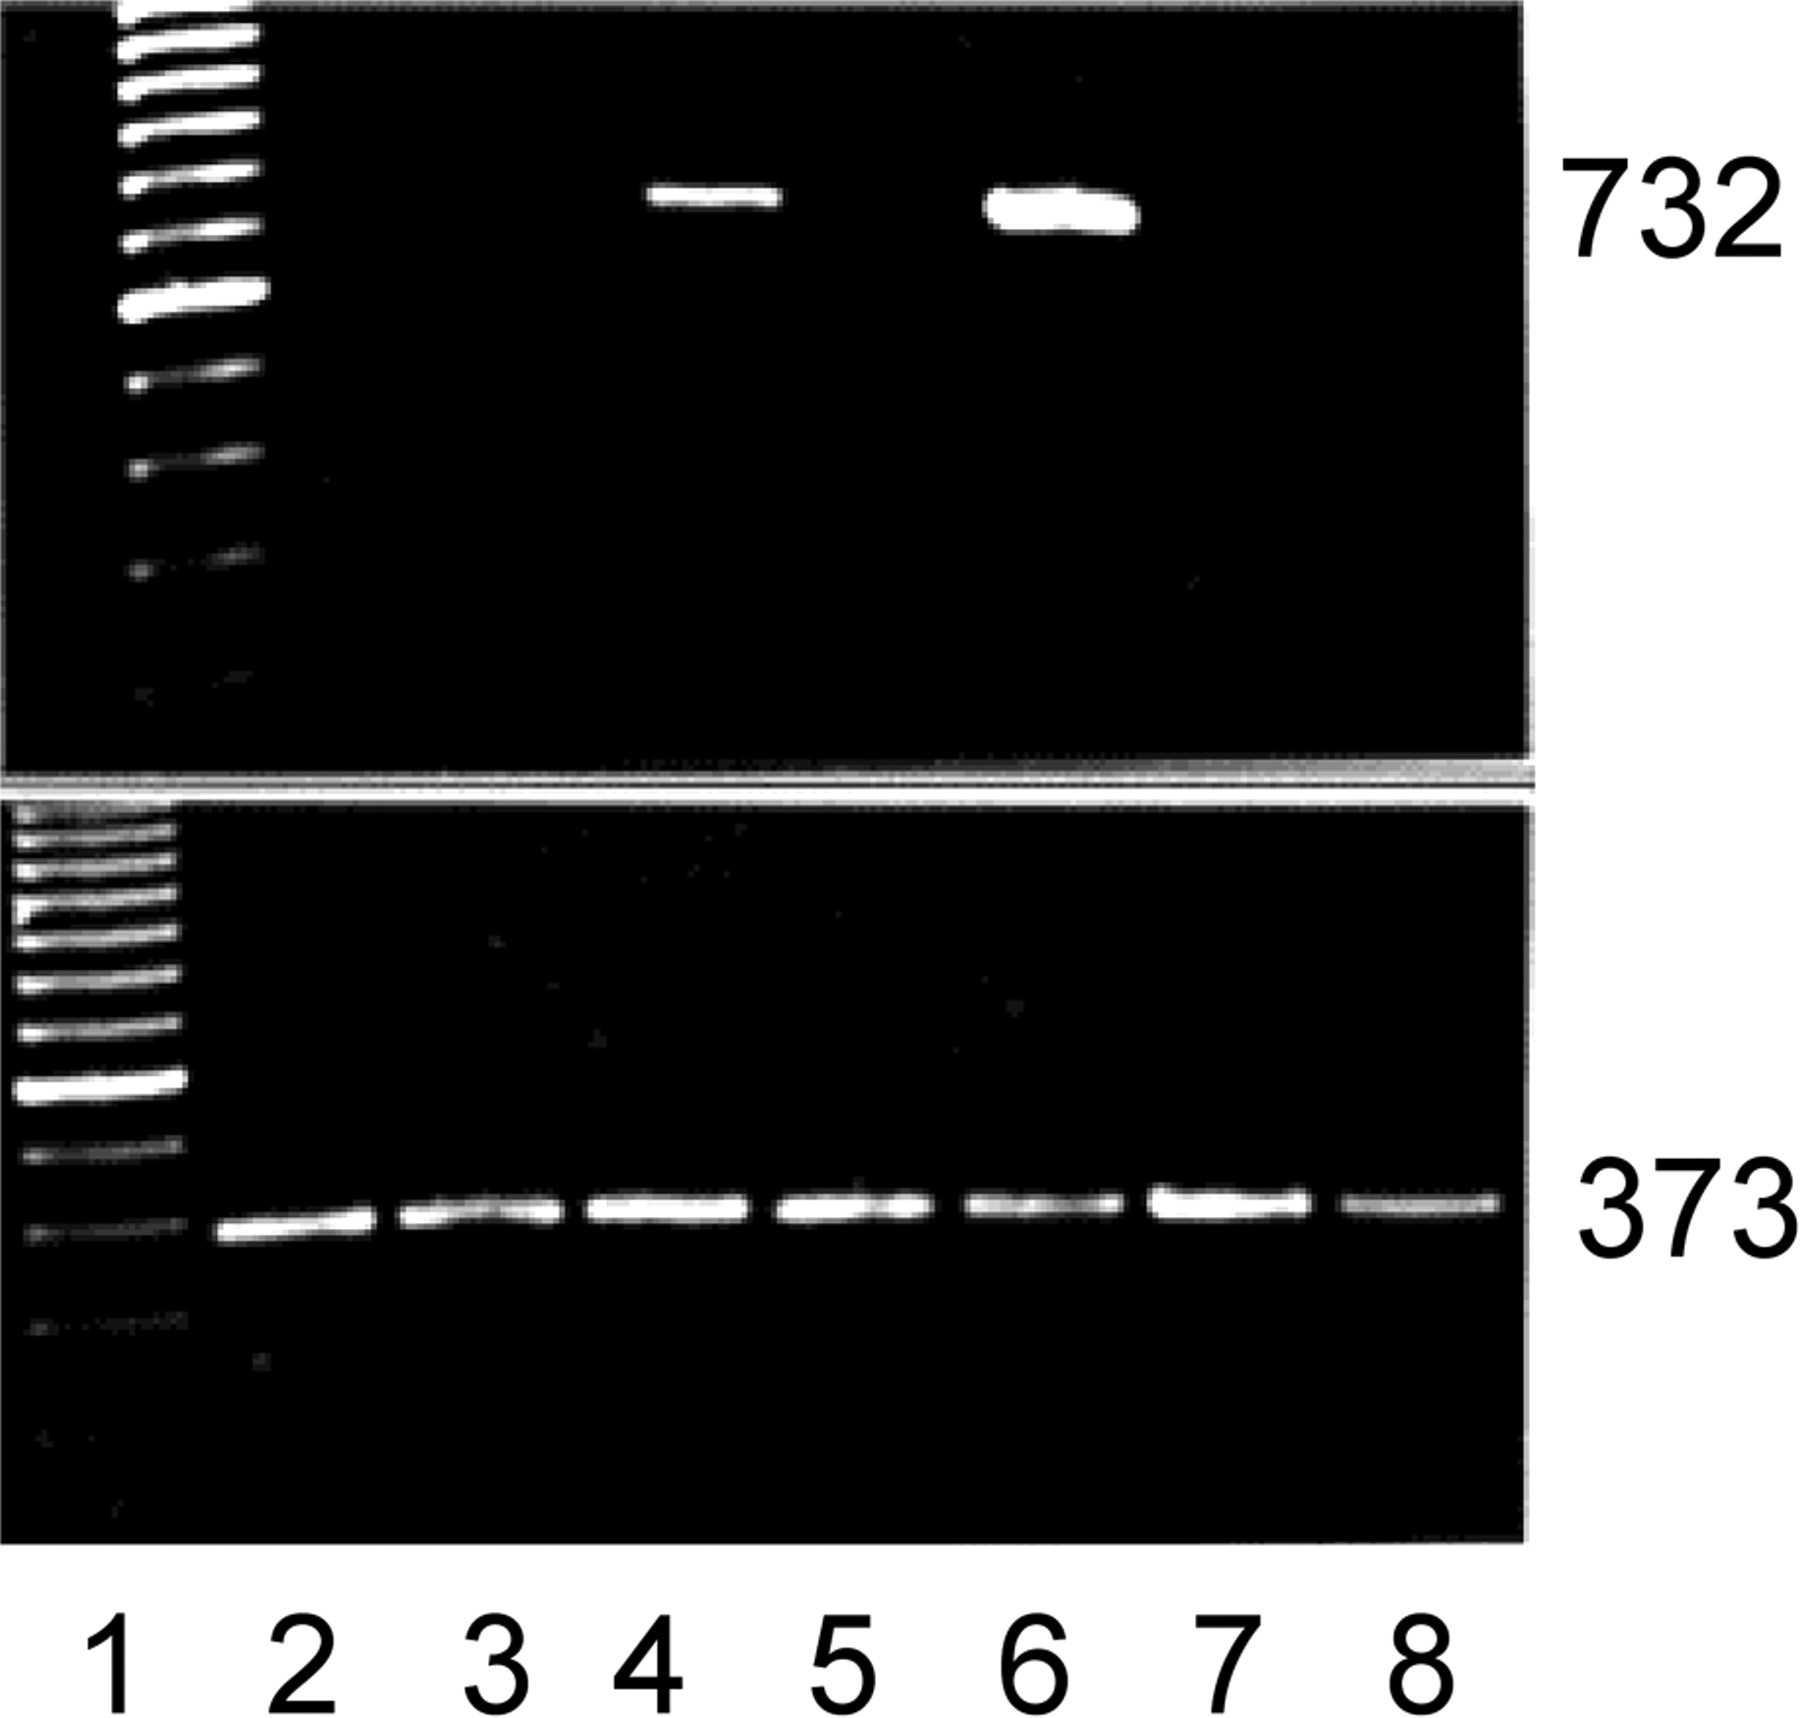
Figure 6.

Quantitative analysis of myf-5 expression. Anti-myf-5 immunofluorescence was performed (Figs. 8 9) . After fixation and viewing, cells expressing nuclear myf-5 were digitized. Cells that possessed nuclear myf-5 were then expressed as a percentage of the total population counted. Results are from several experiments (n > 5) in which more than 100 cells were counted for each condition, plated in triplicate. Error bars denote SE. Note that FGF-2 and heparin treatment of pericytes blocked nuclear myf-5 accumulation, whereas TGF-β1 treatment induced myf-5 nuclear localization.
Figure 6.
Quantitative analysis of myf-5 expression. Anti-myf-5 immunofluorescence was performed (Figs. 8 9) . After fixation and viewing, cells expressing nuclear myf-5 were digitized. Cells that possessed nuclear myf-5 were then expressed as a percentage of the total population counted. Results are from several experiments (n > 5) in which more than 100 cells were counted for each condition, plated in triplicate. Error bars denote SE. Note that FGF-2 and heparin treatment of pericytes blocked nuclear myf-5 accumulation, whereas TGF-β1 treatment induced myf-5 nuclear localization.
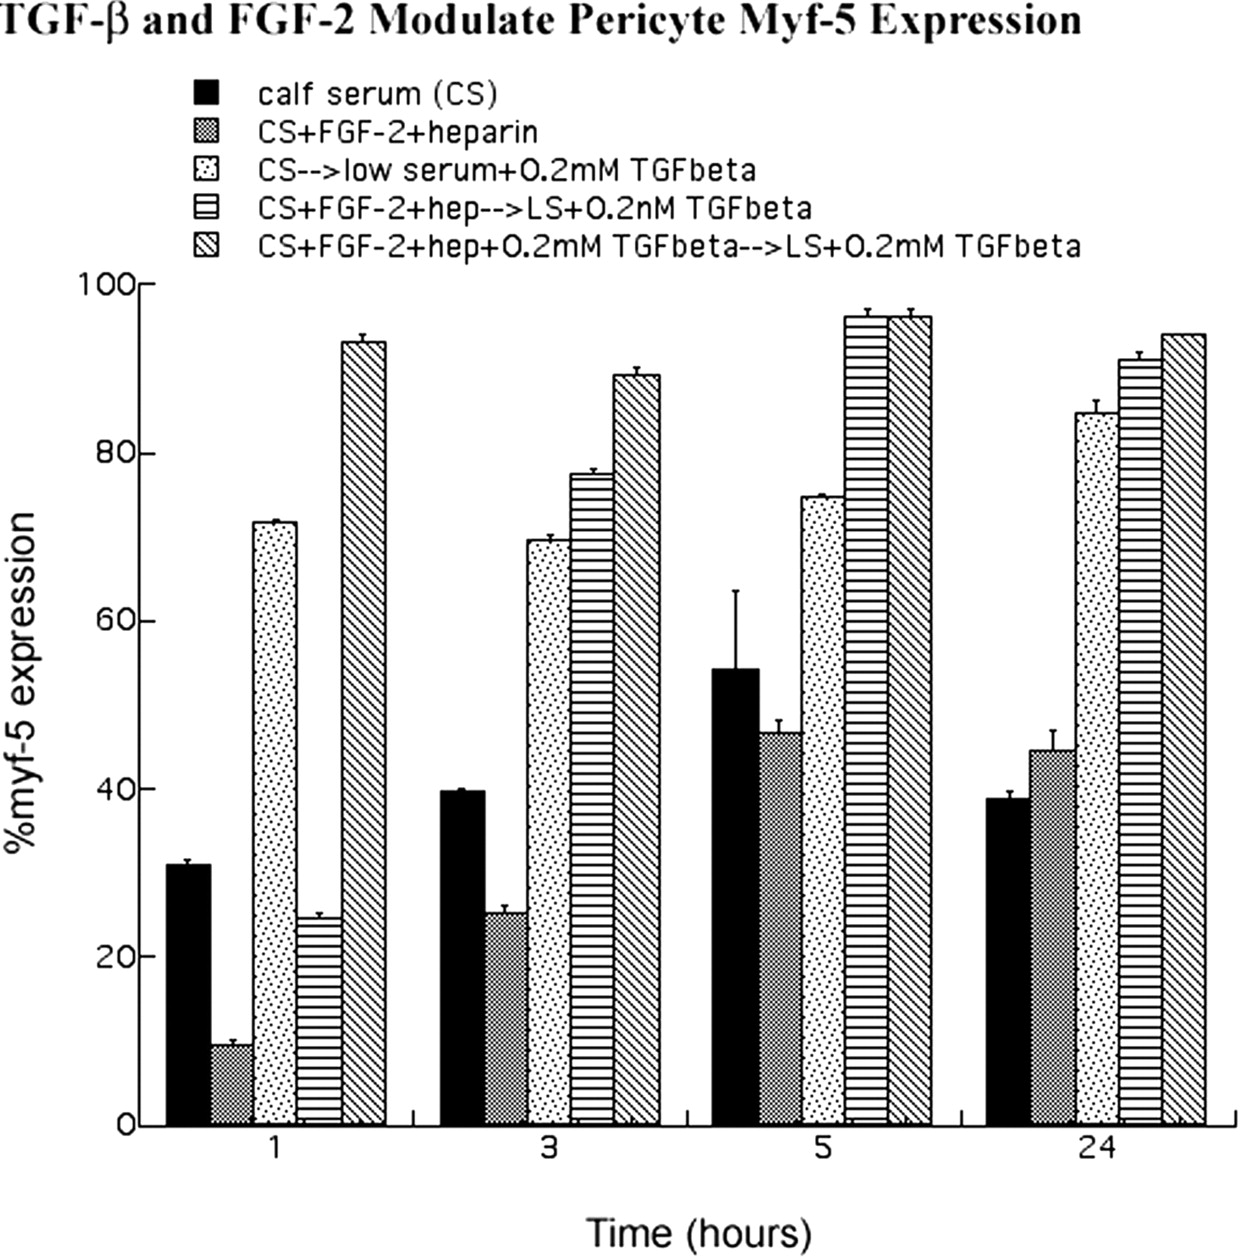
Figure 7.
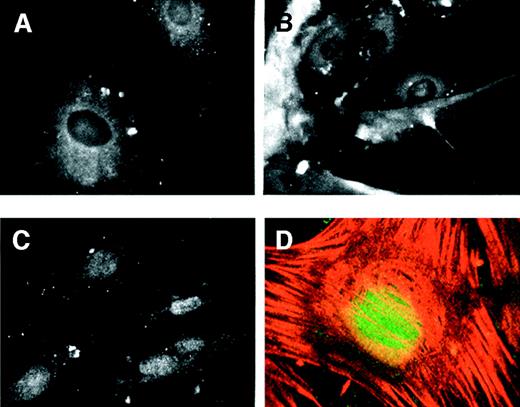
Myf-5 accumulated in the nucleus concomitant with growth arrest. Pericytes were grown in the presence of 10% serum or FGF-2/heparin. Cells were either maintained under these conditions or washed and changed to TGF-β1-containing medium. Cells were then fixed and prepared for anti-myf-5 immunofluorescence. When pericytes were cultured in the presence of serum (A) or FGF-2/heparin (B), anti-myf-5 fluorescence was cytoplasmic. However, after the switch from 10% serum to TGF-β1-containing medium (C), anti-myf-5 fluorescence was nuclear. Confocal imaging confirmed the nuclear localization of myf-5 in pericytes treated with TGF-β1 (D), and stained simultaneously for myf-5 (green) and α-SMA (red).
Figure 7.
Myf-5 accumulated in the nucleus concomitant with growth arrest. Pericytes were grown in the presence of 10% serum or FGF-2/heparin. Cells were either maintained under these conditions or washed and changed to TGF-β1-containing medium. Cells were then fixed and prepared for anti-myf-5 immunofluorescence. When pericytes were cultured in the presence of serum (A) or FGF-2/heparin (B), anti-myf-5 fluorescence was cytoplasmic. However, after the switch from 10% serum to TGF-β1-containing medium (C), anti-myf-5 fluorescence was nuclear. Confocal imaging confirmed the nuclear localization of myf-5 in pericytes treated with TGF-β1 (D), and stained simultaneously for myf-5 (green) and α-SMA (red).
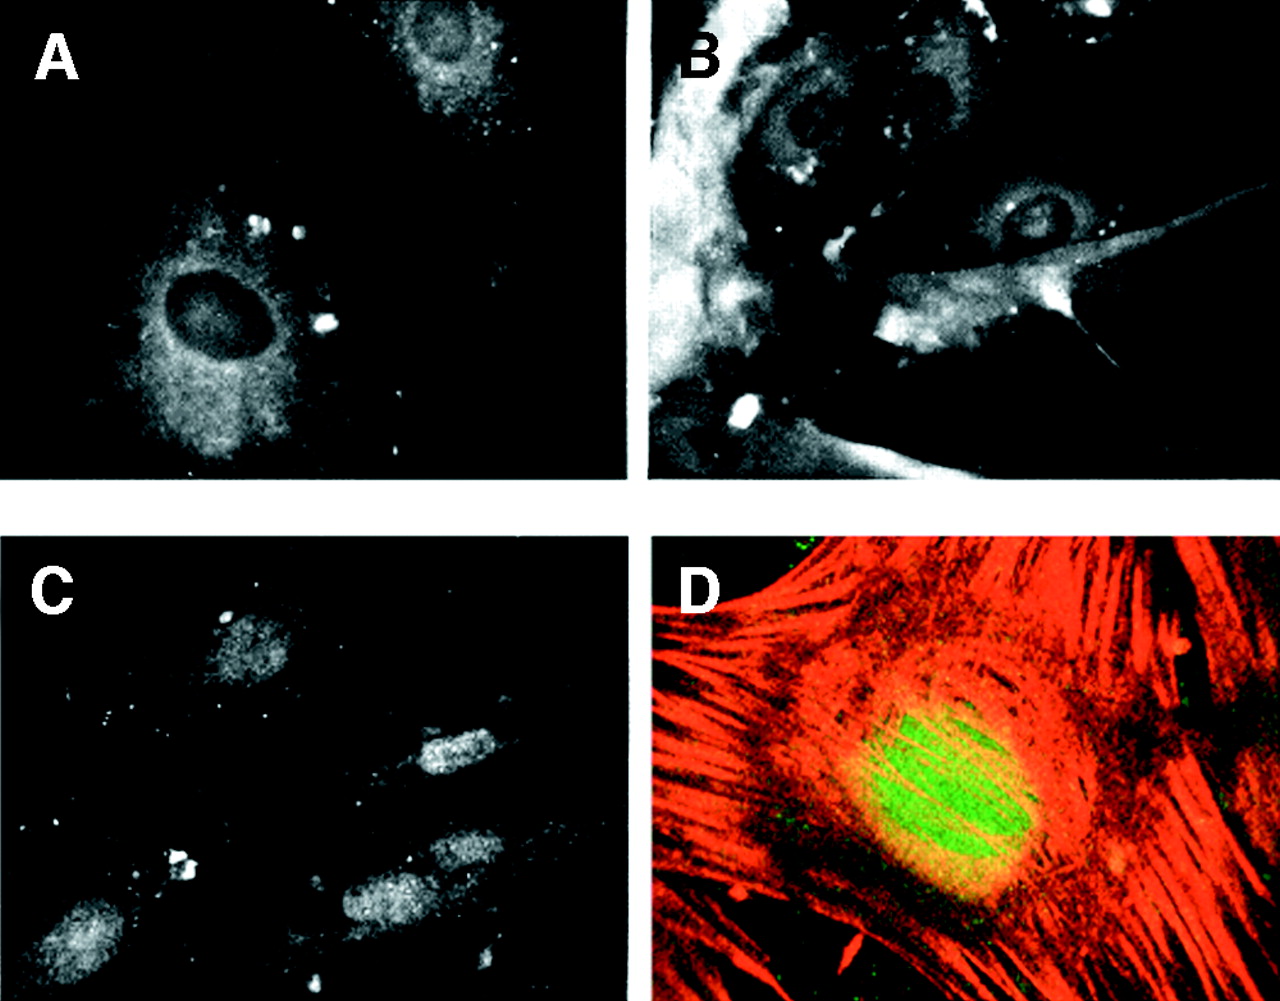
Figure 8.
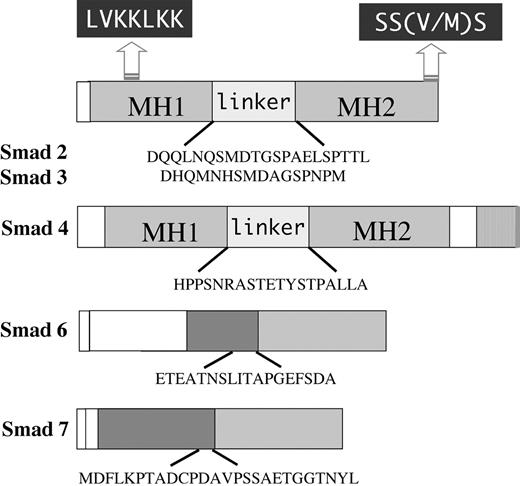
Schematic of peptides used for rabbit injections to generate polyclonal Smad antibodies. Generalized domain structures of Smad2, -3, -4, -6, and -7 are shown. LVKKLKK represents the conserved nuclear localization signal present in Smad2 and -3, and SS(V/M)/S is the conserved C-terminal site of phosphorylation by TGF-β receptor type I. MH1 and MH2 refer to the highly conserved N- and C-terminal domains of Smad2, -3, and -4. The divergent linker regions between MH1 and MH2 regions are also shown. Sequences of synthesized peptides used to inject rabbits for antibodies are indicated below each diagram.
Figure 8.
Schematic of peptides used for rabbit injections to generate polyclonal Smad antibodies. Generalized domain structures of Smad2, -3, -4, -6, and -7 are shown. LVKKLKK represents the conserved nuclear localization signal present in Smad2 and -3, and SS(V/M)/S is the conserved C-terminal site of phosphorylation by TGF-β receptor type I. MH1 and MH2 refer to the highly conserved N- and C-terminal domains of Smad2, -3, and -4. The divergent linker regions between MH1 and MH2 regions are also shown. Sequences of synthesized peptides used to inject rabbits for antibodies are indicated below each diagram.

Figure 9.

TGF-β1 induced Smad2 nuclear accumulation in retinal pericytes. (A) Western blot, performed on whole-cell lysates from transfected COS cells, demonstrating the specificity of rabbit anti-Smad2 antibody. (B) Bovine retinal pericytes were seeded onto glass coverslips and continuously grown in the presence of 10% serum. Arrowheads: diffuse cytoplasmic localization of Smad2. (C) Cells were grown in 10% serum and downshifted to 0.01% serum for 48 hours. The downshifted cells were then treated with 1 ng/mL TGF-β1 for the periods indicated. Arrowheads: punctate perinuclear staining of anti-Smad2; arrow: diffuse cytoplasmic Smad2 localization.
Figure 9.
TGF-β1 induced Smad2 nuclear accumulation in retinal pericytes. (A) Western blot, performed on whole-cell lysates from transfected COS cells, demonstrating the specificity of rabbit anti-Smad2 antibody. (B) Bovine retinal pericytes were seeded onto glass coverslips and continuously grown in the presence of 10% serum. Arrowheads: diffuse cytoplasmic localization of Smad2. (C) Cells were grown in 10% serum and downshifted to 0.01% serum for 48 hours. The downshifted cells were then treated with 1 ng/mL TGF-β1 for the periods indicated. Arrowheads: punctate perinuclear staining of anti-Smad2; arrow: diffuse cytoplasmic Smad2 localization.
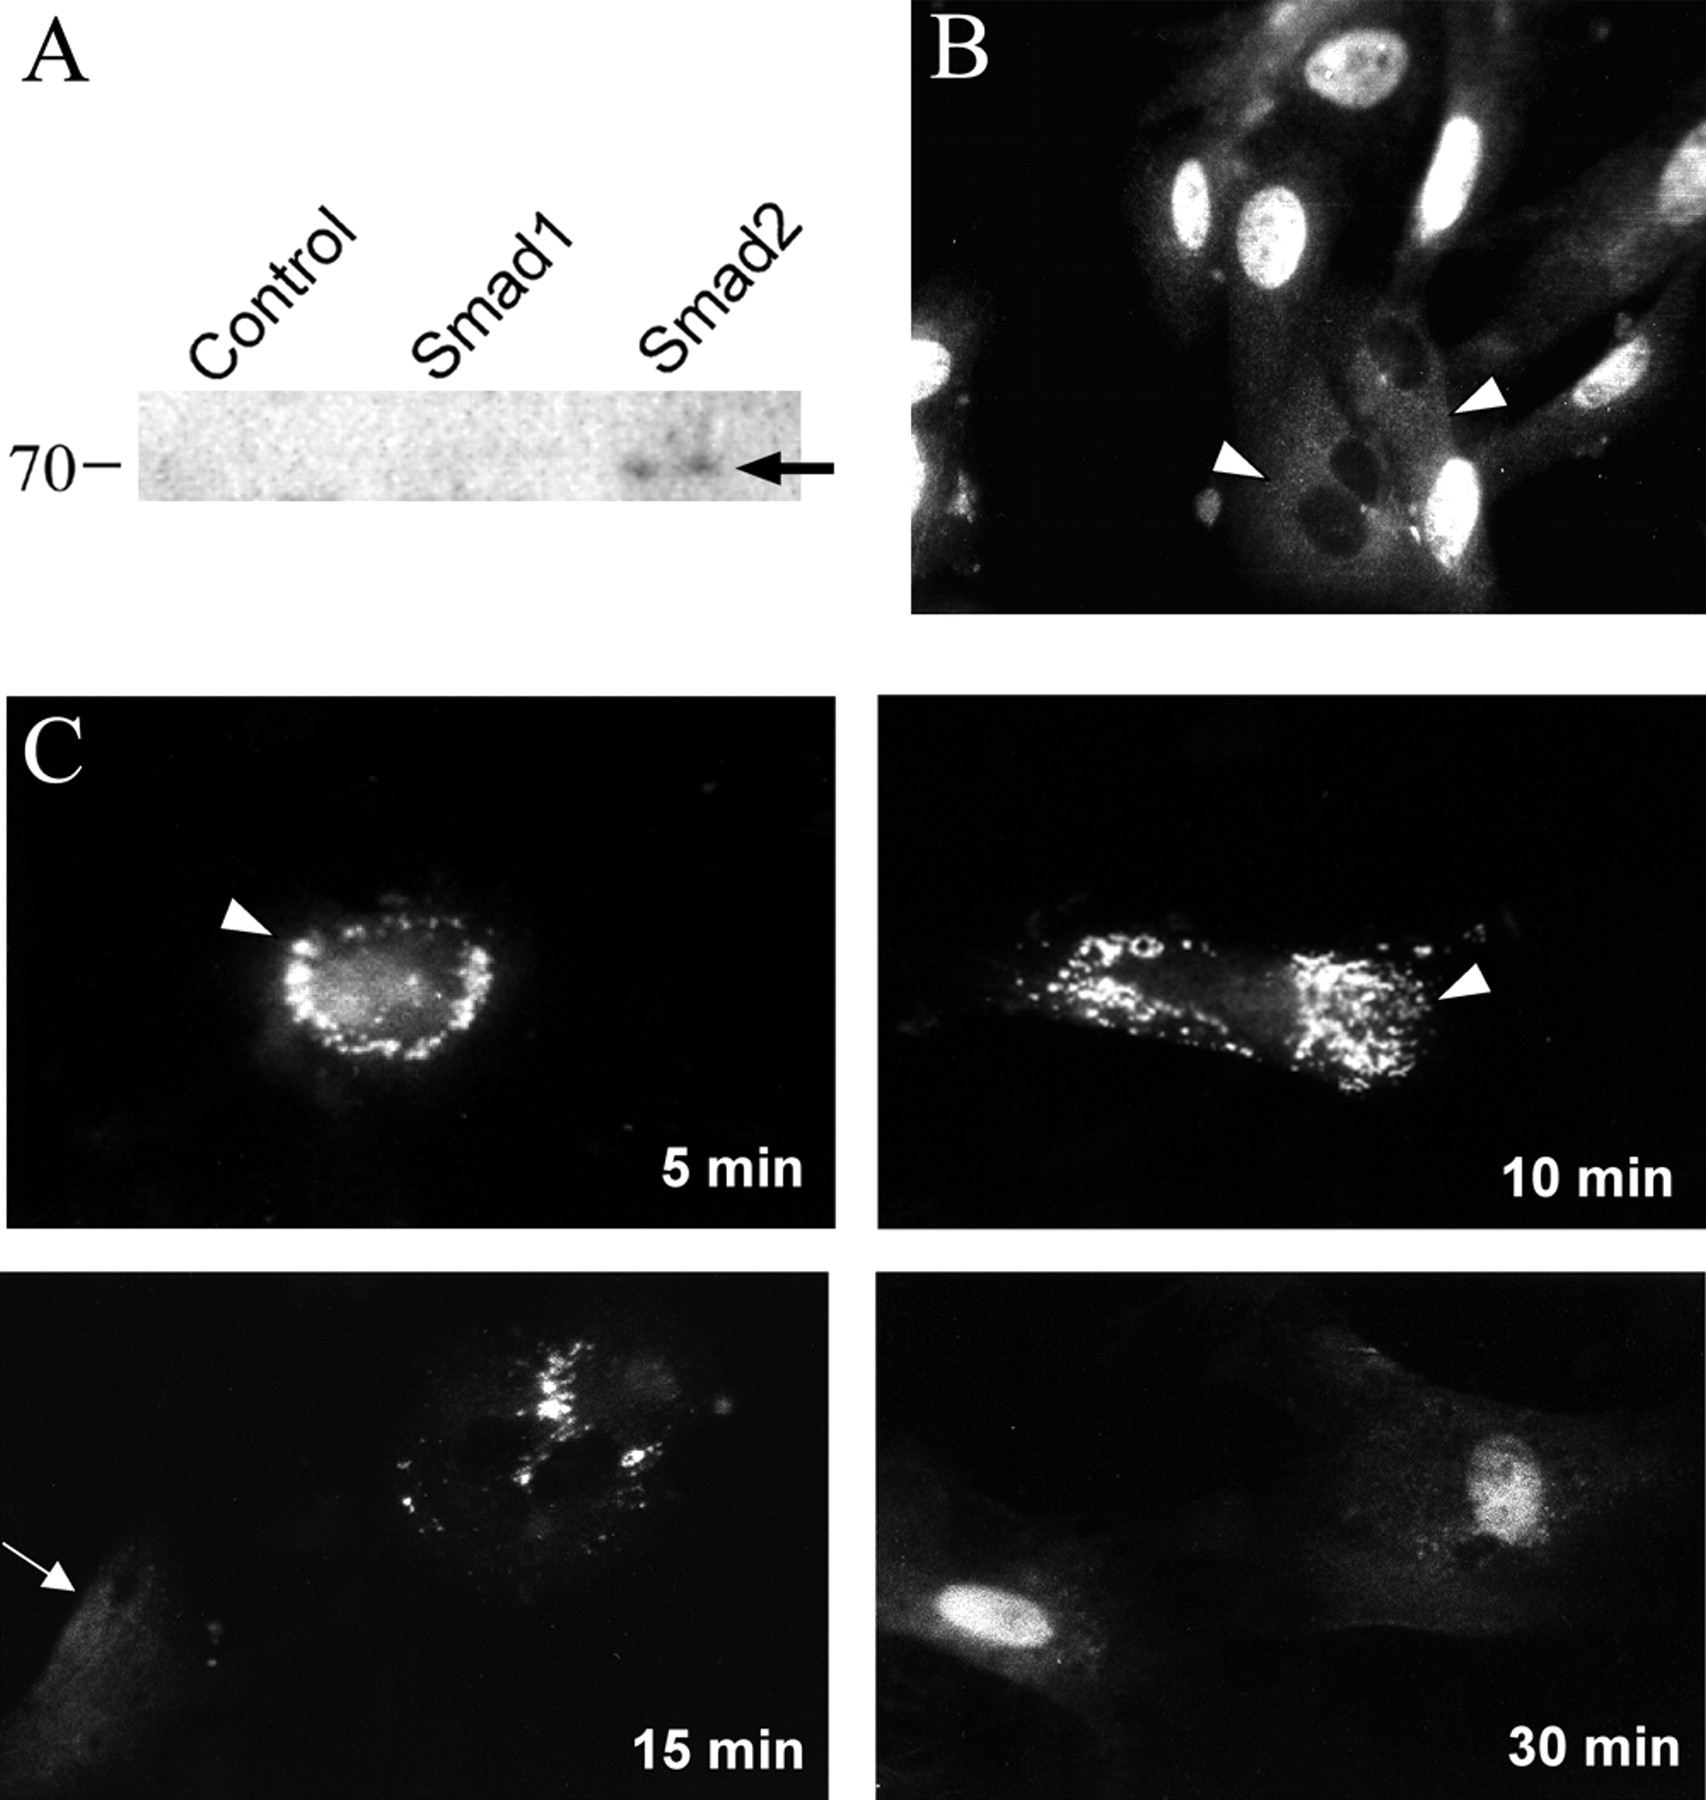
Figure 10.
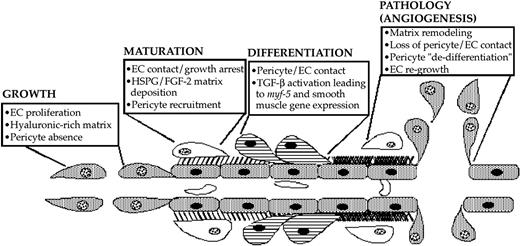
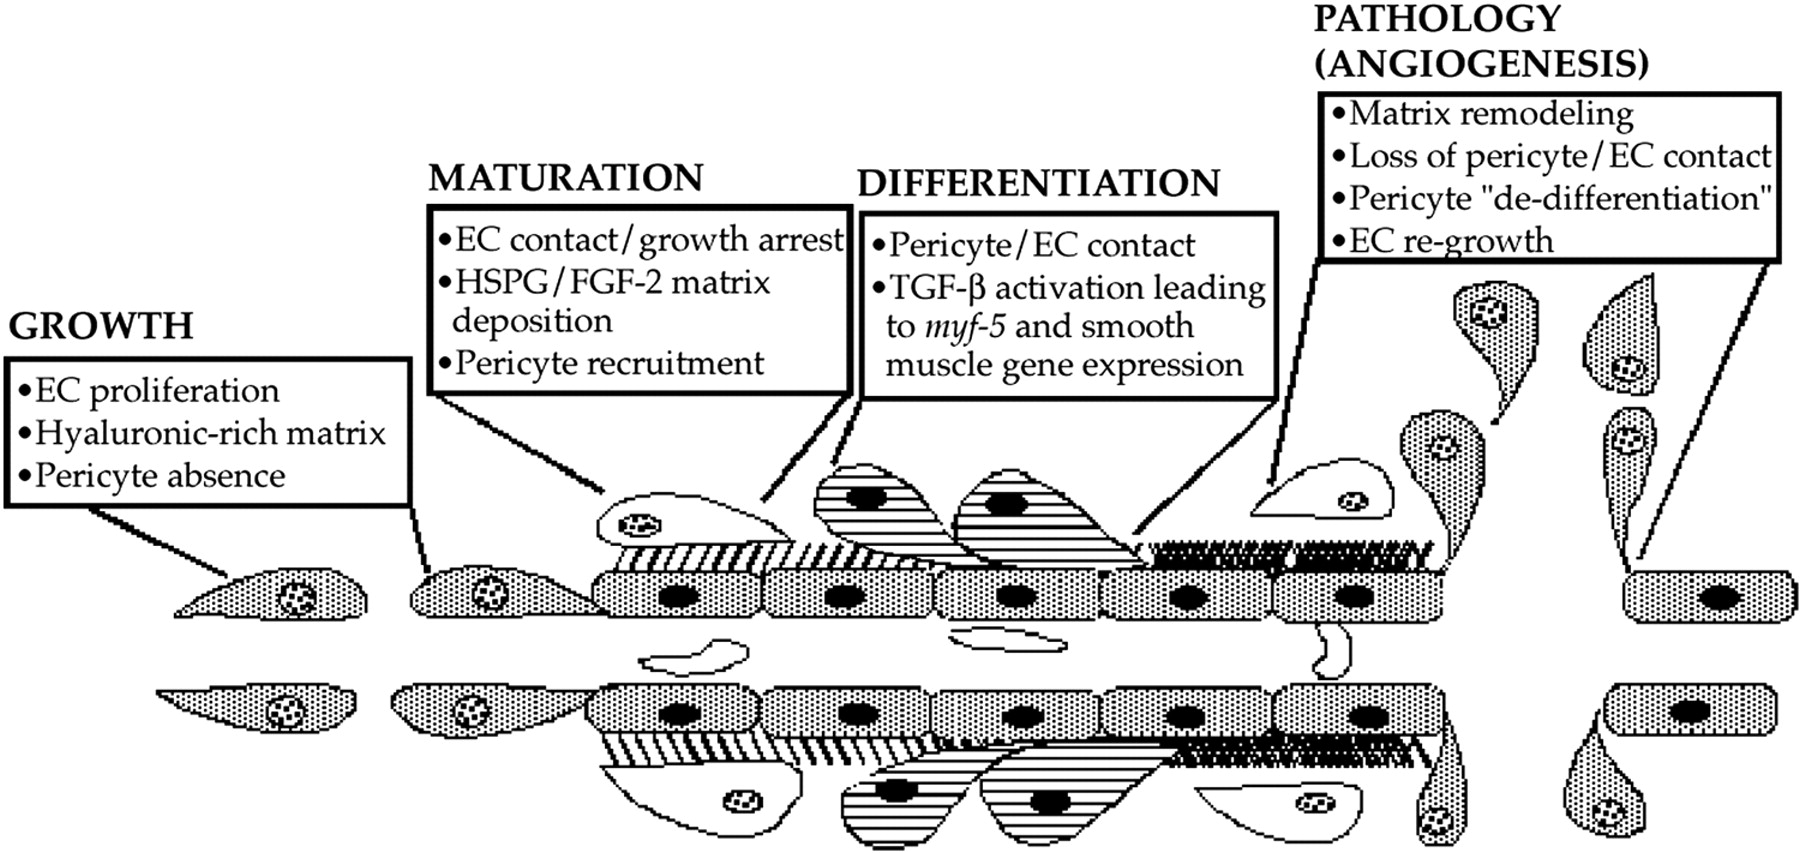
Diagram depicting a suggested pathway of FGF-2 and TGF-β1 induction of pericyte growth and differentiation during microvascular morphogenesis. Pericyte recruitment occurs after endothelial deposition of FGF-2 in the extracellular basement membrane. As pericytes begin contacting endothelial cells, TGF-β1 becomes activated, therein fostering endothelial growth arrest as well as causing the induction of myf-5 and pericyte smooth muscle contractile protein gene expression. This smooth muscle contractile phenotype maintains the endothelium in its growth-arrested state until aberrations in the extracellular compartment prevent endothelial cell-pericyte contacts. In turn, pericyte and endothelial cell proliferation ensues, launching recurrent rounds of pathologic angiogenesis.
Figure 10.
Diagram depicting a suggested pathway of FGF-2 and TGF-β1 induction of pericyte growth and differentiation during microvascular morphogenesis. Pericyte recruitment occurs after endothelial deposition of FGF-2 in the extracellular basement membrane. As pericytes begin contacting endothelial cells, TGF-β1 becomes activated, therein fostering endothelial growth arrest as well as causing the induction of myf-5 and pericyte smooth muscle contractile protein gene expression. This smooth muscle contractile phenotype maintains the endothelium in its growth-arrested state until aberrations in the extracellular compartment prevent endothelial cell-pericyte contacts. In turn, pericyte and endothelial cell proliferation ensues, launching recurrent rounds of pathologic angiogenesis.
Copyright 2003 The Association for Research in Vision and Ophthalmology, Inc.