The Relationship Between Diabetic Retinopathy and Diabetic Nephropathy in a Population-Based Study in Korea (KNHANES V-2, 3) | IOVS (original) (raw)
Figure
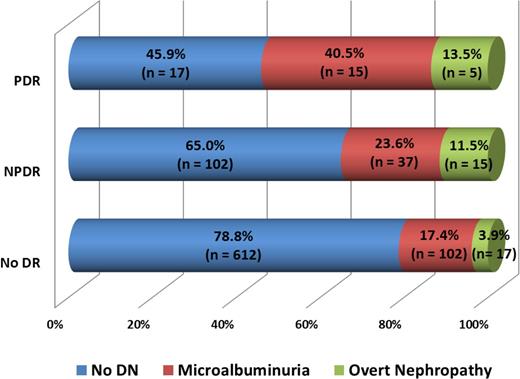
Distribution of stages of nephropathy (DN) among patients with different degrees of DR.
Figure
Distribution of stages of nephropathy (DN) among patients with different degrees of DR.
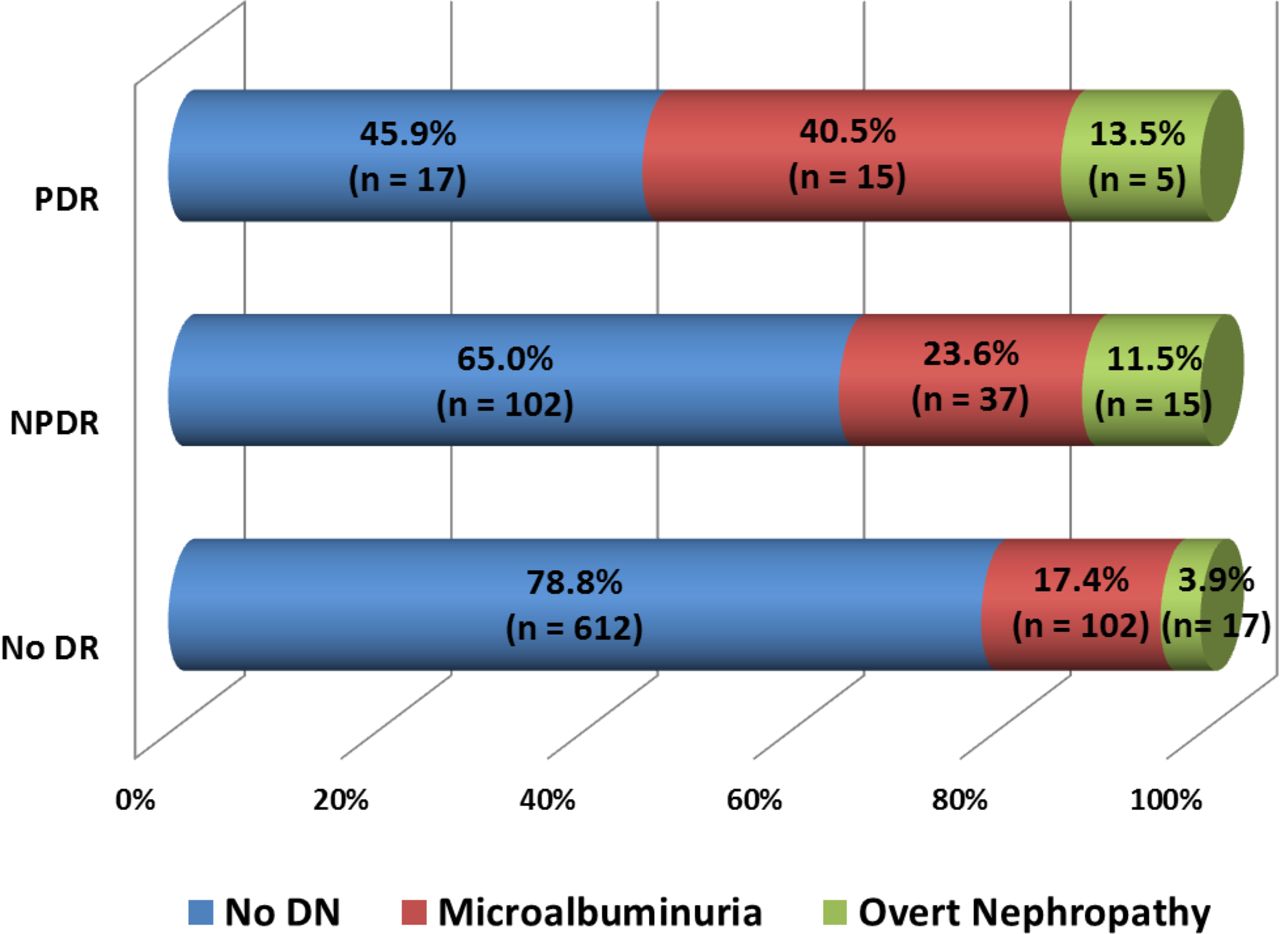
Table 1
Comparison of Characteristics Among No-DN, MA, and ON Groups in DM Patients
Table 1
Comparison of Characteristics Among No-DN, MA, and ON Groups in DM Patients
| | No-DN, n = 731 | MA, n = 187 | ON, n = 53 | P Value | | | | ------------------------ | ------------------ | ----------------- | ----------------- | ------ | ------ | | (1) | (2) | | | | | | Men, % | 51.3 | 48.7 | 60.4 | 0.244 | 0.202 | | Age, y | 61.91 (10.97) | 64.51 (11.47) | 64.74 (10.92) | 0.004 | 0.070 | | HTN, % | 57.7 | 73.0 | 79.2 | <0.001 | 0.002 | | Duration of HTN, y | 8.00 (7.90) | 8.53 (8.10) | 8.71 (8.74) | 0.506 | 0.582 | | SBP, mm Hg | 126.6 (16.0) | 132.7 (17.8) | 137.3 (21.4) | <0.001 | 0.001 | | DBP, mm Hg | 75.7 (9.9) | 76.3 (13.2) | 76.6 (11.7) | 0.571 | 0.605 | | Duration of DM, y | 6.2 (7.5) | 8.2 (8.4) | 10.3 (9.1) | 0.003 | 0.002 | | FBG, mg/dL | 139.5 (41.1) | 144.8 (43.6) | 153.1 (54.3) | 0.116 | 0.023 | | HbA1c, % | 7.32 (1.39) | 7.56 (1.50) | 8.04 (1.68) | 0.041 | 0.004 | | Triglycerides, mg/dL | 169.6 (143.6) | 180.3 (127.9) | 217.3 (174.1) | 0.353 | 0.056 | | Total cholesterol, mg/dL | 185.2 (42.1) | 186.3 (37.8) | 200.4 (41.1) | 0.752 | 0.011 | | LDL cholesterol, mg/dL | 111.4 (38.6) | 105.2 (33.9) | 126.5 (32.1) | 0.292 | 0.168 | | BUN, mg/dL | 15.7 (4.4) | 17.2 (6.7) | 18.8. (6.2) | 0.005 | 0.001 | | Creatinine, mg/dL | 0.86 (0.21) | 0.93 (0.45) | 1.07 (0.45) | 0.069 | 0.002 | | eGFR, mL/min/1.73m2 | 87.21 (18.33) | 83.36 (22.70) | 77.02 (26.09) | 0.033 | 0.007 | | ACR, μg/mg | 8.00 (7.37) | 86.94 (65.67) | 1213.98 (166.75) | <0.001 | <0.001 | | Ever smoker* | 48.3 | 44.4 | 56.6 | 0.341 | 0.242 | | Current smoker | 20.7 | 18.7 | 35.8 | 0.545 | 0.010 | | DR, % | 16.3 | 27.8 | 43.4 | <0.001 | <0.001 | | PDR, % | 2.3 | 8.0 | 9.4 | <0.001 | 0.002 | | CSME, % | 0.5 | 2.1 | 1.9 | 0.059 | 0.296 |
Table 2
Risk Factors Associated With MA in Korean DM Patients
Table 2
Risk Factors Associated With MA in Korean DM Patients
| Variable | Univariate | Multivariate | ||||
|---|---|---|---|---|---|---|
| OR | 95% CI | P Value | aOR | 95% CI | P Value | |
| Men | 0.83 | 0.60–1.14 | 0.244 | |||
| Age, y | 1.02 | 1.01–1.04 | 0.004 | 1.01 | 0.99–1.03 | 0.318 |
| HTN | 1.98 | 1.39–2.83 | <0.001 | 1.53 | 1.01–2.32 | 0.043 |
| Duration of HTN, y | 1.01 | 0.98–1.03 | 0.505 | |||
| SBP, mm Hg | 1.02 | 1.01–1.03 | <0.001 | 1.02 | 1.01–1.03 | <0.001 |
| DBP, mm Hg | 1.01 | 0.99–1.02 | 0.504 | |||
| Duration of DM, y | 1.03 | 1.01–1.05 | 0.002 | 1.01 | 0.99–1.03 | 0.453 |
| FBG, mg/dL | 1.00 | 1.00–1.01 | 0.117 | |||
| HbA1c, % | 1.12 | 1.00–1.24 | 0.042 | 1.18 | 1.05–1.32 | 0.006 |
| Triglycerides, mg/dL | 1.00 | 1.00–1.00 | 0.359 | |||
| Total cholesterol, mg/dL | 1.00 | 1.00–1.01 | 0.751 | |||
| LDL cholesterol, mg/dL | 1.00 | 0.99–1.00 | 0.291 | |||
| BUN, mg/dL | 1.06 | 1.02–1.09 | 0.001 | 1.04 | 1.01–1.08 | 0.013 |
| Creatinine, mg/dL | 2.06 | 1.13–3.76 | 0.018 | 1.55 | 0.49–4.85 | 0.455 |
| eGFR, mL/min/1.73m2 | 0.99 | 0.98–1.00 | 0.016 | 1.01 | 0.99–1.02 | 0.453 |
| Ever smoker | 0.86 | 0.62–1.18 | 0.341 | |||
| Current smoker | 0.88 | 0.59–1.33 | 0.545 | |||
| DR | 1.98 | 1.36–2.88 | <0.001 | 1.18 | 0.74–1.88 | 0.488 |
| PDR | 3.66 | 1.79–7.48 | <0.001 | 3.03 | 1.44–6.40 | 0.004 |
| CSME | 3.97 | 0.98–16.04 | 0.053 | 2.61 | 0.55–12.29 | 0.225 |
Table 3
Risk Factors Associated With ON in Korean DM Patients
Table 3
Risk Factors Associated With ON in Korean DM Patients
| Variable | Univariate | Multivariate | ||||
|---|---|---|---|---|---|---|
| OR | 95% CI | P Value | aOR | 95% CI | P Value | |
| Men | 1.45 | 0.82–2.56 | 0.204 | |||
| Age, y | 1.03 | 1.00–1.05 | 0.071 | 1.01 | 0.97–1.05 | 0.576 |
| HTN | 2.80 | 1.42–5.53 | 0.003 | 2.24 | 0.94–5.35 | 0.070 |
| Duration of HTN, y | 1.01 | 0.97–1.05 | 0.581 | |||
| SBP, mm Hg | 1.04 | 1.02–1.05 | <0.001 | 1.03 | 1.01–1.05 | 0.001 |
| DBP, mm Hg | 1.01 | 0.98–1.04 | 0.548 | |||
| Duration of DM, y | 1.06 | 1.03–1.09 | <0.001 | 1.04 | 1.00–1.08 | 0.029 |
| FBG, mg/dL | 1.01 | 1.00–1.01 | 0.025 | 1.00 | 0.99–1.01 | 0.804 |
| HbA1c, % | 1.31 | 1.12–1.53 | 0.001 | 1.30 | 1.07–1.57 | 0.007 |
| Triglycerides, mg/dL | 1.00 | 1.00–1.00 | 0.041 | 1.00 | 1.00–1.00 | 0.177 |
| Total cholesterol, mg/dL | 1.01 | 1.00–1.01 | 0.012 | 1.001 | 1.00–1.02 | 0.008 |
| LDL cholesterol, mg/dL | 1.01 | 1.00–1.02 | 0.171 | |||
| BUN, mg/dL | 1.12 | 1.07–1.18 | <0.001 | 1.07 | 1.00–1.14 | 0.067 |
| Creatinine, mg/dL | 9.00 | 3.70–21.88 | <0.001 | 8.54 | 3.13–23.34 | <0.001 |
| eGFR, mL/min/1.73m2 | 0.97 | 0.96–0.99 | <0.001 | 1.01 | 0.97–1.04 | 0.720 |
| Ever smoker | 1.40 | 0.80–2.45 | 0.244 | |||
| Current smoker | 2.14 | 1.19–3.86 | 0.011 | 1.90 | 0.91–3.96 | 0.085 |
| DR | 3.94 | 2.21–7.03 | <0.001 | 2.11 | 1.04–4.26 | 0.038 |
| PDR | 4.38 | 1.55–12.37 | 0.005 | 1.48 | 0.39–5.59 | 0.561 |
| CSME | 3.50 | 0.38–31.84 | 0.267 |
Table 4
Risk of CKD in Patients With Presence of DR and PDR Relative to Those With No-DR
Table 4
Risk of CKD in Patients With Presence of DR and PDR Relative to Those With No-DR
| | ORs for CKD (P Value) | | | | | | ---------------------------------- | -------------------------- | ------------------------- | --------------------------- | ------------- | | No-DN, n = 731 | MA, n = 187 | ON, n = 53 | All, n = 971 | | | No-DR | 1.00 (ref) | 1.00 (ref) | 1.00 (ref) | 1.00 (ref) | | DR | 1.35 (0.441) | 2.95 (0.009) | 1.80 (0.356) | 2.02 (0.004) | | PDR | 2.13 (0.325) | 4.32 (0.011) | 1.80 (0.546) | 4.07 (<0.001) |
Copyright 2014 The Association for Research in Vision and Ophthalmology, Inc.