The majority of intestinal IgA+ and IgG+ plasmablasts in the human gut are antigen-specific (original) (raw)
Features of intestinal human IgA and IgG plasmablast antibodies. To characterize the IgA and IgG antibody repertoire of intestinal plasmablasts, we isolated single lamina propria IgA+CD38+CD27+ and IgG+CD38+CD27+ plasmablasts from terminal ileum of 3 healthy donors (HD1–HD3) and cloned their Ig heavy chain locus (IGH), Ig κ chain locus (IGK), and Ig λ chain locus (IGL) genes (Supplemental Figure 1 and Supplemental Tables 1–3; supplemental material available online with this article; doi:10.1172/JCI44447DS1). Intracellular FACS staining showed that nearly all IgA+ intestinal plasmablasts were also surface IgA+, whereas the majority of intracellular IgG+ intestinal B cells lacked surface IgG expression (Supplemental Figure 1B; 80%–100% surface expression for IgA vs. 7%–25% for IgG). Dominant expression of IGA2 in IgA+ plasmablasts (70.8% ± 1.7% expression) reflects the low ratio of IgA1 to IgA2 in secretory IgA from distal parts of human gut (Figure 1A and ref. 22). IgG+ plasmablasts predominantly expressed IGG1 (51.8% ± 32.4% expression), followed by IGG2 (35.9% ± 23.4% expression), IGG4 (9.9% ± 8.7% expression), and IGG3 (2.5% ± 2.3% expression) genes (Figure 1A). Independent of the isotype, all antibodies showed high numbers of somatic mutations and high ratios of replacement to silent mutations in complementarity determining region 1 (CDR1) and CDR2 compared with those in framework regions 1–3 (FWR1–FWR3) as signs of antigen-mediated selection in their IGH and/or IGK and IGL chain genes (Figure 1, B and C, and Supplemental Figure 3). V genes of IgA+ plasmablasts carried on average 22.7 IGH, 13.3 IGK, and 13.9 IGL V gene mutations equivalent to nucleotide exchange rates of 7.1%, 3.6%, and 3.7%, respectively. IgG+ plasmablasts carried on average 22.9 IGH, 15.0 IGK, and 13.7 IGL V gene mutations and thus showed mutation rates comparable to those of IgA+ plasmablasts (mutation frequency: 7.6% for IGH, 4.0% for IGK, 4.4% for IGL; Figure 1, B and C, and Supplemental Figure 3). Clonally related antibodies with identical IGH V-D-J and IGK and IGL V-J rearrangements and shared somatic mutations were identified in IgA+ and IgG+ plasmablasts from all 3 donors (Figure 1D and Supplemental Tables 1–3). About 3.7% of all IgA antibodies (8 out of 216 antibodies) and 11.8% of all IgG antibodies (17 out of 144 antibodies) belonged to expanded clones, but clonally related B cells were not shared between the IgA+ and IgG+ plasmablast compartments in any of the donors (Figure 1D and Supplemental Tables 1–3). No significant differences in IGH gene usage and IgH CDR3 length and positive charges were observed between IgA+ and IgG+ plasmablasts (Figure 1E and Supplemental Figure 2A). VH3 genes were expressed by more than 50% of IgA+ plasmablasts in all donors and were also dominant in antibodies from IgG+ plasmablasts. IGK and IGL light chain gene usage was also comparable, with the exception that IgA+ plasmablasts showed relatively more Jκ1 and less Jκ4 usage than IgG+ plasmablasts (Figure 1F and Supplemental Figure 2B).

Ig gene analysis of intestinal IgA+ and IgG+ plasmablasts. The IGH gene sequences of IgA+ and IgG+ plasmablasts from the terminal ileum of HD1–HD3 were analyzed for (A) isotype subclass usage, (B) frequency of replacement (black) and silent (white) mutations in FWRs and CDRs, (C) absolute number of somatic mutations in V genes, (D) clonal relationships, (E) IGH V family and J gene usage and IgH CDR3 aa length and positive charges, and (F) IGK and IGL V family and J gene usage. The absolute number of sequences analyzed is indicated over each graph. Error bars in bar graphs indicate standard deviation of means for individual patients. Average means of IgH CDR3 length and of V gene somatic mutations are indicated by horizontal lines in the respective graphs. Gray bars indicate standard deviation of means of individual donors (each donor is indicated by an individual symbol). The number of tested antibodies is indicated in the pie chart center. Shaded areas in pie charts indicate clonally related sequences. P values were calculated to compare data from IgA and IgG plasmablasts but did not reach values below 0.05 and thus are not indicated.
We conclude that intestinal lamina propria IgA and IgG plasmablast antibodies show similar Ig gene features and undergo strong antigen-mediated clonal expansion and diversification but are not clonally related.
Polyreactive lamina propria IgA and IgG plasmablast antibodies. Polyreactive antibodies are considered to contribute substantially to the intestinal antibody repertoire and to mediate regulatory functions by immune exclusion of luminal antigens (4, 20). To determine the frequency of polyreactive intestinal antibodies, we cloned the matching IGH, IGK, and IGL chains genes of 137 IgA+ and 85 IgG+ plasmablasts into expression vectors and produced the recombinant monoclonal antibodies in vitro (23, 24). Polyreactivity was measured by ELISA with structurally different antigens, including dsDNA, LPS, and insulin (Figure 2A and refs. 23, 24). We observed interindividual variation in the frequency of polyreactive plasmablasts in both compartments, but, on average, 26% of IgA antibodies (20% for HD1, 29% for HD2, 34% for HD3) and 26% of IgG antibodies (40% for HD1, 19% for HD2, 13% for HD3) were reactive with at least 2 antigens in this assay and were thus considered polyreactive (Figure 2B and refs. 23, 24). In summary, one-fourth of human intestinal IgA+ and IgG+ plasmablasts from terminal ileum expressed polyreactive antibodies that showed cross-reactivity with structurally diverse self and non-self antigens.

Polyreactivity of intestinal IgA and IgG plasmablast antibodies. IgA and IgG plasma cell antibodies from HD1–HD3 (solid lines) were tested for polyreactivity with dsDNA, ssDNA, insulin, and LPS by ELISA in at least 3 independent experiments. (A) Representative graphs for dsDNA, LPS, and insulin are shown. Dotted lines represent the high positive control antibody ED38 (40). Red and green lines show the low positive control antibody JB40 and the negative control antibody mGO53, respectively (23). The number and frequency of polyreactive antibodies with reactivity to at least 2 structurally different antigens out of all tested IgA and IgG antibodies is indicated below the respective graphs for each donor (23, 24). (B) Pie charts summarize the frequency of nonpolyreactive (white) and polyreactive (black) antibodies out of all tested IgA and IgG antibodies from all donors as measured in 3 independent experiments. The number of tested antibodies is indicated in the pie chart center. Other numbers in pie charts represent the frequency of polyreactive and nonpolyreactive antibodies, respectively.
Self-reactivity of lamina propria IgA+ and IgG+ plasmablasts. To test whether antibody polyreactivity was also associated with self-reactivity, we performed indirect immunofluorescence assays (IFAs) with the human epithelial cell line HEp-2, which is commonly used to detect self-reactive antibodies in serum of patients with autoimmune diseases (Figure 3, A and B, and refs. 23, 24). Antibodies that showed reactivity in this assay were categorized into anticytoplasmic, antinuclear, and antinuclear and anticytoplasmic antibodies, according to their HEp-2 subcellular staining patterns (Figure 3A). We again observed interindividual variation, but, on average, 21% of IgA+ plasmablasts (10% for HD1, 29% for HD2, and 32% for HD3) and 27% of IgG+ plasmablasts (26% for HD1, 19% for HD2, and 38% for HD3) expressed HEp-2 cell–reactive antibodies (Figure 3B). The majority of HEp-2–reactive antibodies recognized cytoplasmic antigens (14% of IgA, 22% of IgG), and 3% of IgA and IgG antibodies, respectively, showed nuclear and cytoplasmic staining patterns (Figure 3, B and C). True antinuclear antibody (ANA) staining patterns were observed with 4% of IgA and 1% of IgG antibodies, respectively (Figure 3, B and C). About 50% of HEp-2 binding antibodies were polyreactive (48% for IgA and 52% for IgG), and such antibodies showed predominantly cytoplasmic or nuclear and cytoplasmic staining (Figure 3C and ref. 23). Thus, self-reactivity of intestinal plasmablast antibodies is associated with polyreactivity, but antibodies with reactivity for defined HEp-2 cell self antigens, including ANAs, comprise about 7% of the intestinal IgA+ and 9% of the intestinal IgG+ plasmablast repertoire. To determine whether lamina propria–derived antibodies also bind to intestinal tissue self antigens that are not represented by HEp-2 cells, we tested all antibodies by IFA for reactivity with murine small intestine tissue sections (Figure 3, D–F). Hoechst staining was performed in parallel to detect cell nuclei (Figure 3D). A variety of different staining patterns against defined intestinal tissue structures and cells but also unspecific staining patterns were identified (Figure 3D). On average, 14% of IgA (10% for HD1, 16% for HD2, 19% for HD3) and 24% of IgG (29% for HD1, 26% for HD2, 13% for HD3) plasmablast antibodies showed reactivity in this assay (Figure 3E). Again polyreactive antibodies contributed to more than 50% of tissue-reactive IgA and IgG antibodies (Figure 3F). However, 3% of IgA and 6% of IgG plasmablast antibodies showed specific binding, with defined cellular or extracellular intestinal tissue structures, and were not polyreactive or self-reactive as tested by ELISA and HEp-2 cell IFA (Figure 3, C and F, data not shown, and Supplemental Tables 1–3).
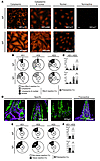
Self-reactivity of IgA and IgG lamina propria plasmablasts. IgA and IgG plasma cell antibodies from HD1–HD3 were tested for self-reactivity (A–C) by IFA with HEp-2 cells and (D–F) on intestinal tissue sections. (A) Representative cytoplasmic, cytoplasmic and nuclear, and nuclear HEp-2 cell staining patterns. A non-HEp-2 cell–reactive antibody is shown for comparison. Scale bars: 20 μm. (B) Pie charts summarize the frequency of non-HEp-2 cell–reactive (white) and HEp-2 cell–reactive antibodies, with cytoplasmic (light gray), cytoplasmic and nuclear (dark gray), and nuclear (black) reactivity. The number of tested antibodies is indicated in the pie chart center. Other numbers in each section represent the frequency of antibodies for each condition, respectively. (C) Bar graphs summarize the frequency of antinuclear (black), anticytoplasmic and antinuclear (dark gray), anticytoplasmic (light gray), and non-self-reactive (white) antibodies for HD1–HD3. Hatched areas indicate polyreactive antibodies. Standard deviation of means is indicated. (D) Representative specific and polyreactive intestinal tissue staining patterns (purple). Hoechst-stained nuclei are shown in green. Scale bars: 50 μm. (E) Pie charts show the frequency of non-intestinal tissue–reactive antibodies (white) and intestinal tissue–reactive antibodies (black) for each HD. The number of tested antibodies is indicated in the pie chart center. Other numbers in each section represent the frequency of antibodies for each condition, respectively. (F) Bar graphs summarize the frequency of tissue reactive (black) and non-tissue reactive (white) IgA and IgG antibodies, respectively, for HD1–HD3. Hatched areas indicate polyreactive antibodies. Standard deviation of means is indicated.
In summary, 14% of intestinal IgA+ and 19% of IgG+ plasmablasts, respectively, expressed HEp-2 cell– or intestinal tissue–reactive antibodies. Thus, we conclude that self-reactive IgA+ and IgG+ plasmablasts are part of the normal intestinal plasmablast compartment, including cells that express antibodies with specificity for nuclear and intestinal tissue antigens.
Reactivity of lamina propria IgA and IgG plasmablast antibodies with commensal and pathogenic microorganisms. Exposure to commensal and pathogenic microorganisms can induce antigen-specific intestinal B cell responses. To identify IgA and IgG antibodies from lamina propria plasmablasts that show reactivity with specific intestinal microorganisms, using whole cell ELISA, we tested all 222 antibodies for binding to a panel of representative commensal bacteria: E. coli, Enterobacter cloacae, Enterococcus faecalis, Morganella morganii, Bacteroides thetaiotaomicron, the probiotic strains E. coli Nissle 1917 and Lactobacillus reuteri, and the enteropathogenic bacterium Salmonella typhimurium (Figure 4, Supplemental Tables 1–3, and data not shown). In addition, all antibodies were tested for ELISA binding to virus-like particles (VLPs) of enteritis-causing rotavirus (Figure 4 and Supplemental Tables 1–3).

Reactivity of IgA and IgG lamina propria plasmablast antibodies with intestinal microbes. IgA and IgG plasma cell antibodies from HD1–HD3 were tested for reactivity with a panel of nonpathogenic and enteropathogenic intestinal microbes. The data shown are representative for at least 2 independent experiments. (A) ELISA graphs show the reactivity profile (black line) of a representative bacteria-polyreactive antibody (HD2g348) with E. coli, M. morganii, E. cloacae, and E. faecalis. High positive (dashed line, ED38; ref. 40), low positive (red line, JB40; ref. 23), and nonreactive (green line, mGO53; ref. 23) antibodies were included in each assay for comparison. Horizontal lines indicate the cutoff OD405 in each assay. (B) Bar graphs summarize the frequency of bacteria polyreactive antibodies (black) and non-bacteria polyreactive IgA and IgG antibodies (white) in each donor as determined by ELISA as in A. (C) Representative ELISA graphs show the reactivity of E. coli, M. morganii, E. cloacae, and rotavirus-specific IgA and IgG plasma cell antibodies from HD1–HD3. Clone names of bacteria-specific antibodies are indicated in the graphs. Additional high positive (dashed line, ED38; ref. 40), low positive (red line, JB40; ref. 23) and nonreactive (green line, mGO53; ref. 23) control antibodies were included in each assay for comparison. Horizontal lines indicate the cutoff OD405 in each assay. (D) Histograms show binding of _E. coli_–specific (HD3g76, HD3g144) and _M. morganii_–specific (HD3g71) antibodies to whole bacteria as measured by FACS. Secondary antibody only (neg. control) was included as control in all assays.
On average 7% of IgA antibodies and 6% of IgG antibodies showed low levels of cross-reactivity with several bacterial species but were not reactive with dsDNA, LPS, and insulin and were thus considered bacteria polyreactive (Figure 4, A and B, and Supplemental Tables 1–3). In contrast, 4 IgA and 7 IgG antibodies from all 3 donors showed high reactivity with individual microbes or rotavirus in the ELISAs (Figure 4C and Supplemental Tables 1–3). Four antibodies were highly reactive with E. coli (HD2g36, HD3g76, HD3g144λ, HD3g149λ), 2 recognized E. cloacae (HD1a57, HD3a55) and M. morganii (HD3g71, HD3a159), respectively, and 3 showed specificity to rotavirus (HD2a53, HD3g26, HD3g94). FACS analysis confirmed that the antibodies HD3g76, HD3g144λ, and HD3g71 reacted specifically with E. coli and M. morganii, respectively (Figure 4D). By Western blotting, we could identify LPS as specific target antigen of 2 E. coli_–reactive antibodies (Supplemental Figure 4). Surprisingly, none of the antibodies with specificity for the same microbe that were cloned from B cells of the same individual were clonally related (Supplemental Tables 1–3). Specificity for E. coli was limited to IgG antibodies, whereas anti–_E. cloacae antibodies were IgAs, and M. morganii and rotavirus-reactive antibodies, respectively, were cloned from IgA+ and IgG+ plasmablasts (Figure 4C and Supplemental Figure 4). Specific antibodies against E. faecalis, S. typhimurium, B. thetaiotaomicron, E. coli Nissle, and L. reuteri were not identified (Supplemental Tables 1–3 and data not shown).
We concluded that, despite the enormous diversity of the intestinal flora, individual members of the commensal flora and intestinal pathogens elicit strong intestinal IgA and IgG plasmablast responses.
Antibody reactivity profile of the intestinal IgA+ and IgG+ plasmablast repertoire. Overall, IgA+ and IgG+ plasmablasts in lamina propria of the terminal ileum showed similar reactivity profiles (Figure 5). On average, 26% of IgA and of IgG antibodies were polyreactive with diverse self and foreign antigens, including bacteria. Cross-reactivity with diverse bacterial strains in the absence of broad levels of polyreactivity was observed for 7% of IgA and 5% of IgG antibodies. We conclude that in total about one-third of IgA+ and IgG+ lamina propria plasmablast antibodies are polyreactive or cross-reactive with bacteria, whereas the majority of intestinal plasmablasts (66% of IgA+ and 70% of IgG+ cells) express nonpolyreactive and non-cross-reactive antibodies, including self-reactive antibodies that react with nuclear or intestinal tissue antigens and antibodies specific for common intestinal microbes and pathogens.

Antibody reactivity of human IgA+ and IgG+ lamina propria plasmablasts. Pie charts summarize the frequency of IgA+ and IgG+ plasmablasts of unknown specificity (white), of plasmablasts with specificity for intestinal microbes (blue, E. coli; yellow, M. morganii; red, E. cloacae; green, rotavirus) or self antigens (light gray, HEp-2 or intestinal tissue), and of unspecific bacteria-reactive (hatched dark gray) and polyreactive (black) plasmablasts as percentages of all tested IgA and IgG antibodies, respectively, from HD1–HD3. The number of tested antibodies is indicated in the pie chart centers.
In summary, the data suggest that the majority of intestinal IgA and IgG plasmablast antibodies are generated in a specific response to antigenic stimulation and do not show unspecific binding to intestinal microbes or are polyreactive with diverse self and foreign antigens.