OXBench: A benchmark for evaluation of protein multiple sequence alignment accuracy (original) (raw)
The results of this study consider the development of a database of reference alignments; the definition of evaluation measures for multiple alignment accuracy; the identification of the most informative evaluation measures by application to the AMPS [13, 14] multiple alignment method; the application of the training data set to find good parameters for the AMPS multiple alignment program and investigation of different features of this hierarchical alignment method; exploration of the accuracy of alignment for AMPS on the different OXBench test sets and application and comparison of the OXBench benchmark to eight different multiple alignment methods.
Development of reference alignments and evaluation measures
Structural alignments
Reference proteins for alignment were drawn from the 3Dee database of structural domains [23, 24]. 3Dee contains domain definitions for proteins of experimentally determined three-dimensional structure in the Protein Data Bank (PDB) up to July 1998. The domains are organised into a hierarchy of structurally similar protein domain families classified by the "S c score" [25] from the automatic multiple structure alignment program STAMP [25]. S c scores greater than 3.0 indicate clear structural similarity. STAMP not only provides the multiple structure alignment, but also gives a measure of reliability to each structurally aligned position. Thus, STAMP alignments provide a convenient way to filter out positions that are not structurally equivalent or where structural alignment can be ambiguous.
We started with 729 domain structure families at the S c 5.0 level which contained 9,015 domains. Families with only one member were removed, as were structures of resolution poorer than 3.2 Å and domains with less than 40 residues. Domains with more than 5% unknown residues and any domain for which the secondary structure could not be defined by DSSP [26] were also removed. The stereochemical quality of the structures was assessed by running PROCHECK v.3.4.4 on each chain [27]. PROCHECK examines a range of stereochemical features of protein structures and identifies torsion angles that deviate significantly from the distributions seen in protein structures solved at a similar resolution. The PROCHECK G-factor encapsulates these quality measures in a single figure. Accordingly, we filtered the domains to exclude any protein with an overall PROCHECK G-factor ≤ -1. These refinements left 465 families containing 7,217 domains. All multiple segment domains were then excluded to leave 5,428 domains in 381 families.
Highly similar domains (≥ 98% identity) provide limited information for assessing alignment quality and so were removed from the data set by the following procedure. Within each family, the domains were compared by pairwise sequence alignment and clustered by percentage sequence identity [14], then one domain whose structure was solved at high resolution was selected from the clusters formed at 98% identity. Thus, the data set reduced to 1,168 domains in 218 families; where no two sequences in a family share ≥ 98% identity. We chose this relatively high PID cut-off since obtaining accurate alignment of sequences that are very similar is of critical importance in protein modelling and function prediction studies.
Throughout this work the PID for two domains was calculated from the reference structural alignment as the number of identical amino acid pairs in the alignment divided by the length of the shortest sequence.
The STAMP multiple structure comparison algorithm [25] provides good reference alignments for testing sequence alignment methods since it can generate both pairwise and multiple alignments from structure and automatically identify SCRs (Structurally Conserved Regions). STAMP implements several alternative iterative hierarchical methods for finding the structural alignment of two or more proteins. All alternative methods were tried for all families, and the alignment with the highest structural similarity score (S c ) was selected [25]. Alignments produced by STAMP are usually at least as good as those by a human expert, but as structural similarity drops, alignments by any method become less easy to define [28, 29]. For these reasons, the few alignments found with unusually high or low S c values compared to their PID were carefully inspected and where structural alignments were thought to be in error, alternative STAMP parameters were tried to obtain more satisfactory results.
Structural alignments for every sequence pair in the families of the data set were also generated by STAMP as for the multiple structure alignments. This pairwise reference data set allows comparisons between pairwise and multiple alignment accuracies to be made.
Master data set
For some families in the unique data set of 218 families, the sequence identity between a subset of domains is < 10% and it is difficult for sequence alignment methods to align these families as a whole. An example is the immunoglobulin superfamily, where structure comparison puts C-type and V-type domains together, even though there is little sequence similarity. Although alignments of the complete families presents a useful test, alignments of sub-families within these families are also a challenge to methods. Accordingly, the families were sub-divided on the basis of sequence identity and structural similarity.
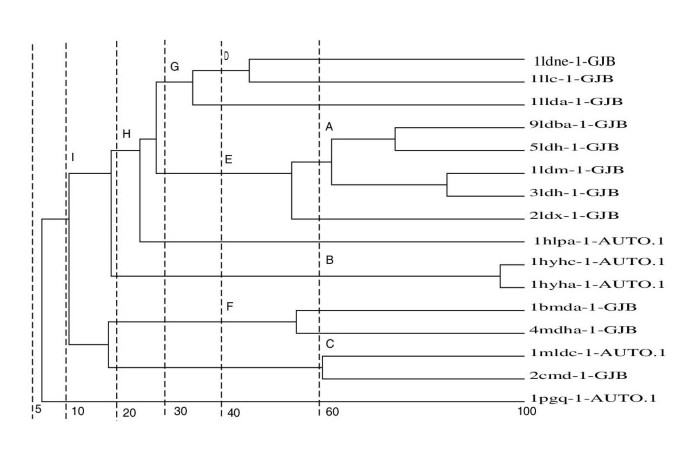
In order to generate sequence similar sub-families we first calculated the PID between every pair of sequences from its structural alignment. The family was then clustered on PID between domains by complete linkage with the program OC [[30](/articles/10.1186/1471-2105-4-47#ref-CR30 "Barton G: OC – A cluster analysis program.1993. [ http://www.compbio.dundee.ac.uk/Software/OC/oc.html
]")\]. The domain clusters formed at PID cut-offs of 60, 40, 30, 20, 10 and 5 were used as sub-families as illustrated in Figure [1](/articles/10.1186/1471-2105-4-47#Fig1) for the dehydrogenase family (Family 10). The sub-families formed between the given PID cut-off were extracted as shown by the sub-divisions labelled A, B, C, D, E, F, G, H and I. For example, sub-family B comprises domain 1hya-AUTO and Ihyb-AUTO. A total of 391 sequence sub-families were created. The structural alignment of these sub-families was optimised by STAMP. In a similar manner, sub-families were generated on structural similarity at S _c_ cut-offs of 7, 6, 5, 4, 3 and 2.Figure 1
An example of the creation of sequence similar sub-families for Family 10 showing the families created at different cut-offs. For a full explanation see "Master data set" in the Results section.
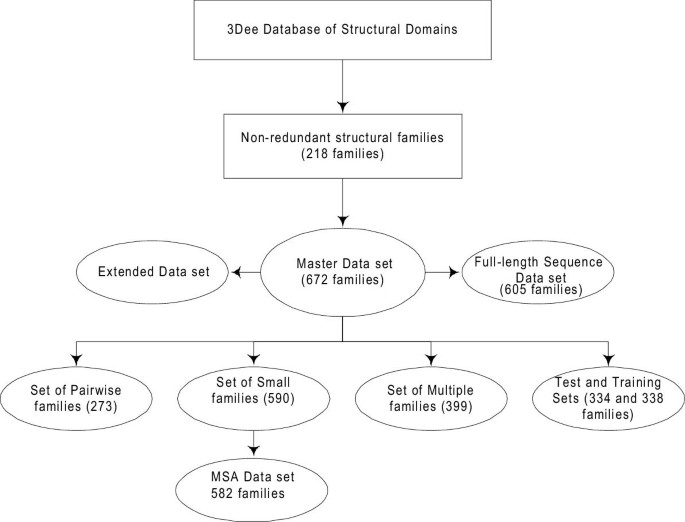
The creation of sequence sub-families and structure sub-families were independent, so it was possible for there to be sub-families containing identical members. One of each pair of identical sub-families was removed to leave a total of 672 families and sub-families. This set included the 218 unique families and is referred to as the Master data set. Figure 2 summarises the further data sets and subsets that were derived from the Master data set and are described in the following sections.
Figure 2
Flowchart outlining the relationship between the OXBench data sets and subsets. A non-redundant set of 218 structural domain families leads to the Master data set of 672 families by following the method outlined in Figure 1. The Master Data Set has additional sequences added to it to make the "Extended Data Set" and the sequences in the Master Data Set are made full-length in order to create the "Full-length Sequence Data Set". The Master Data Set is subdivided to create the test and training data sets as well as a set of two-sequence families (Pairwise Families), families with 8 or less sequences (MSA Data Set) and a set of families with more than two sequences in each family (Multiple Families). These families provide a range of different test data for multiple and pairwise alignment methods.
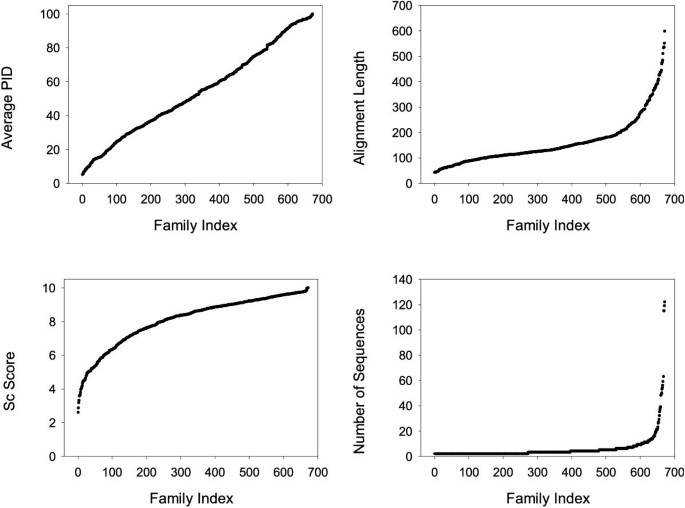
The distribution of of the 218 families in percentage identity (PID) bins is shown in Table 1 and Figure 3. The families include a wide range of numbers of sequences (from 2 to 122) and a wide distribution of length and PID. The percentage of structurally conserved residues in the families ranges from 2.5% to 100%.
Table 1 Summary statistics for the Master data set. NDom: Number of domains. LenAln: Length of alignment. PID a : Average pairwise percentage identity. PID w : Percentage identity across all members of a family. S c : The structural similarity score. PSCR: Percentage of positions in a structurally conserved region.
Figure 3
The families in the Master Data Set ordered by a) Percentage Identity (PID); b) STAMP [25] S c structural similarity score; c) length of alignment; and d) number of domains/sequences in the family.
Extended data set
It has been observed in previous studies that a multiple alignment will often yield better alignments than a pair of sequences taken in isolation [14, 17]. The Master data set only contains sequences of known three-dimensional structure, but for each family in the Master data set there may be many more known sequences. In order to understand the effect on alignment accuracy of increasing the number of sequences in an alignment, we extracted all clearly similar sequences to each family from the SWALL [31] sequence database.
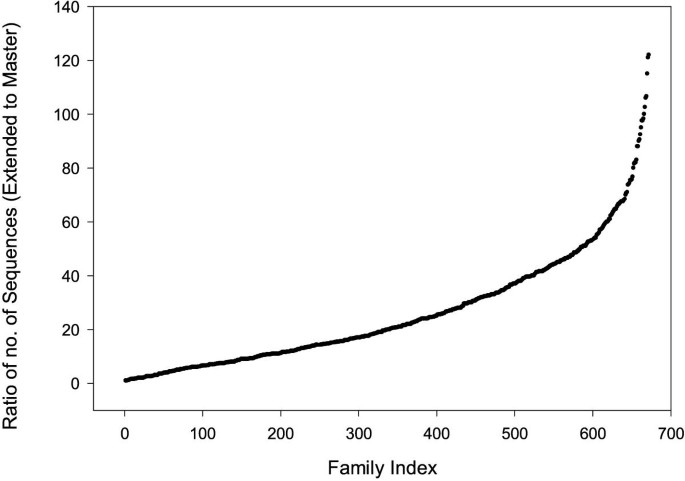
The ratio of the number of sequences in the extended family to the number of sequences in the master family is shown in Figure 4. Approximately half the extended families are more than twenty times the size of the master families.
Figure 4
Graph showing the ratio of number of sequences in each family extended by adding additional sequences to the sequences in the family in the Master Data Set.
Full-length sequence data set
The above data sets are based on isolated domains. In practice, the domain boundaries may be unknown. Accordingly, we generated a data set of families which contain the full-length protein sequences rather than just the domain sequences. Full-length sequences were obtained by cross-reference to SWISS-PROT annotations [32] and sequence comparison to the corresponding full-length sequences.
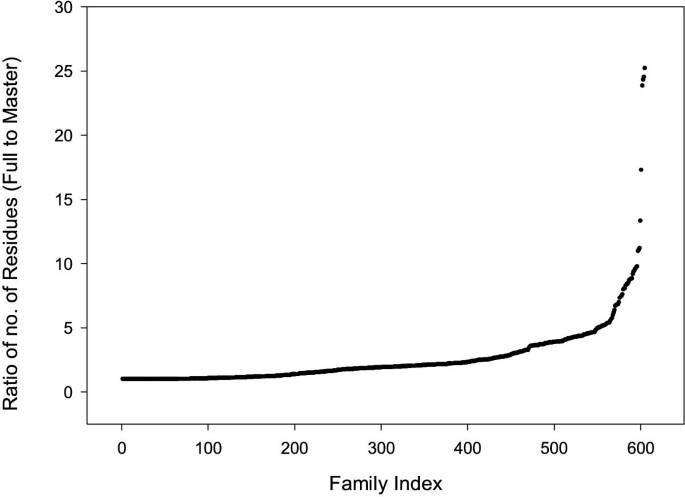
The ratio of the number of residues in each full-length sequence data set family to the number of residues in the equivalent master sequence family is shown in Figure 5. For most sequences, the ratio is between 1:1 and 5:1. The full-length sequence data set contains fewer families (605) than the master data set because it was not possible to identify full-length sequences for all the domain sequences in the master data set.
Figure 5
Graph showing the ratio of the number of residues in the family in the full-length sequence family to the number of residues in the family in the Master Data Set.
Set of pairwise families
The set of 273 families which contain only two sequences was extracted from the Master data set. This set may be used to evaluate alignment methods that work for only two sequences (pairwise methods) and the performance of multiple sequence alignment techniques when aligning pairs.
Set of multiple families
The set of 399 families with more than two members was extracted from the Master data set. This set allows the study of alignment algorithms and parameters on families having more than 2 sequences.
Set of small families
The set of 590 families, containing eight or fewer domains was extracted from the Master data set. This set can be used to assess multiple alignment methods that are not suitable for large families or are too time consuming to use on large families [7, 33].
MSA data set
In testing on the set of small families, DIALIGN and T-COFFEE were able to align all 590 families but MSA failed to align 8 families. Most of these families had either PID<10 or length of alignment >150 which suggests that MSA is not suitable for aligning sequences with low PID or long sequences. Accordingly, we generated a further data set that excludes these 8 families and call this the MSA data set (582 families.)
Test and training sets
So that a fair assessment of performance may be performed, it is necessary that separate, independent training and testing data sets should exist. Ideally a full, leave-one-out jack-knife test would be performed but for multiple sequence alignments this would normally be too time consuming. Accordingly, a simple two-fold cross-validation method was adopted.
The Master data set was split into two sets in such a way that there was no domain in one set that shared sequence similarity with domains in the other set and the PID distribution in both sets were equal. The two sets were created as follows: the PIDs across the whole alignment of each family of the master data set were computed. These families were sorted into ascending order by PID, then the families with odd indices were placed in one set and the complement in the other.
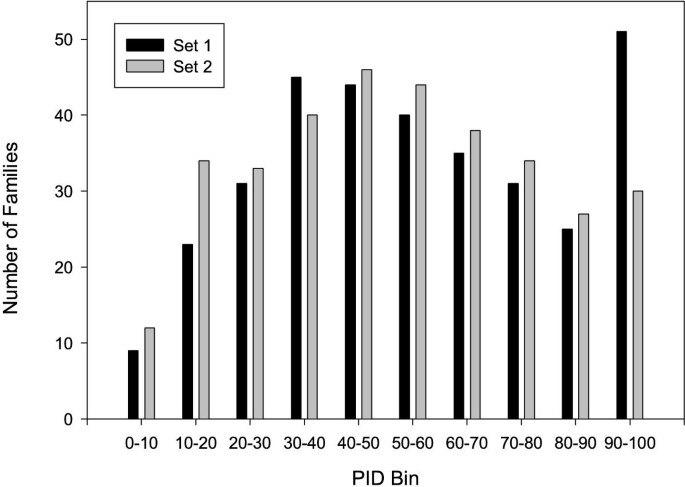
The number of families in each of the test and training sets when the families are binned on PID is shown in Figure 6.
Figure 6
Distribution of families in the two test/training subsets of the Master data set sorted by percentage identity (PID).
Alignment accuracy evaluation measures
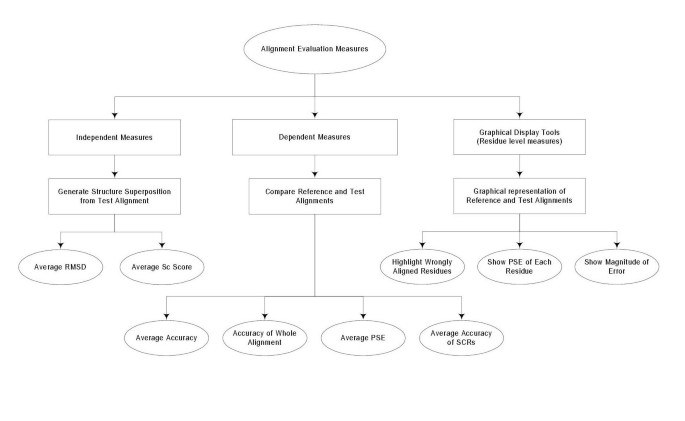
The three different approaches to the evaluation of alignment accuracy developed in this study are summarised in Figure 7. The three approaches are: (i) dependent measures that compare an alignment to a reference alignment; (ii) independent measures that compare the three dimensional structures implied by an alignment; and (iii) visualisation tools that highlight differences between alignments on a colour display.
Figure 7
Summary of the measures used to evaluate alignment quality that are discussed in this paper. "Independent Measures" are those that do not compare an alignment to a reference alignment, but compare the superimposed structures implied by an alignment. "Dependent Measures" compare an alignment to a reference alignment. The Graphical Display Tools highlight differences in alignment between the reference alignment and a test alignment. An example output is shown in Figure: 8. For definitions of terms used in this Figure, see Results.
Dependent measures: evaluation of the complete alignment
Dependent measures which compare an alignment to a reference alignment have long been used in the evaluation of alignment quality [14, 17].
Multiple alignments can be assessed either by considering the alignment as a whole, or by examining the quality of each pairwise alignment within the multiple alignment. Thus, the accuracy of multiple alignment as a whole (AC w ) and average accuracy AC a of all pair alignments were computed by Equations 1, 2 & 3.


where n is the number of sequences in the alignment. The parameters AC w or AC a only consider correctly aligned residues, not the magnitude of the error. The Position Shift Error (PSE) was introduced at the Second Meeting on the Critical Assessment of Techniques for Protein Structure Prediction (CASP2) [[34](/articles/10.1186/1471-2105-4-47#ref-CR34 "Moult J, Hubbard T, Bryant SH, Fidelis K, Pedersen JT: Critical assessment of methods of protein structure prediction (CASP): round II. Proteins 1997, Suppl 1: 2–6. Publisher Full Text
10.1002/(SICI)1097-0134(1997)1+%3C2::AID-PROT2%3E3.3.CO;2-K")\] to measure the magnitude of error in alignments. However, the PSE described in CASP2 does not consider the gaps in an alignment, so here we calculate PSE as follows. An index value is assigned to each residue in the alignment (Table [2](/articles/10.1186/1471-2105-4-47#Tab2)). For example, **1** for the first residue and **n** for the **n** th residue of the sequence. A gap is assigned to the mean of the index values for first left and right residues. The PSE was calculated by Equation 4 Table 2 Example calculation of Position Shift Error (PSE). See Equation: 4 and associated text for explanation.

where IR and IT are the index values for the reference and test alignments corresponding to the index position i. PSE p and LA p are the mean position shift error and alignment length of the pair respectively. The PSE p for the alignment shown in Table 2 would be  if we take the first sequence as the reference and would be
  if we take the second sequence as reference. The mean PSE is calculated over all
  pairs of sequences.
Dependent measures: evaluation of structurally conserved regions
Assessing accuracy of the complete alignment assumes that every position in the reference alignment is equally valid. However, not every position in a protein sequence has an equivalence in a homologue. In particular, a loop region may be structurally very different and so no alignment is valid at that position. For this reason we also calculate the accuracy of alignment only within SCRs. SCRs were obtained directly from STAMP [25]. The regions with STAMP P ij [25] > 6.0 for 3 or more residues were considered as SCRs. The average accuracy of each SCR was calculated within each alignment, then the average Acc SCR was calculated over all SCRs in an alignment.
Independent measures
One limitation of the dependent accuracy measures is that the quality of evaluation is dependent upon the quality of the reference alignment. Errors in the reference alignment may reflect badly on a good sequence alignment method. For this reason evaluation measures that are independent of any reference alignment were also developed. To do this, the structure superposition implied by the test alignment was computed. The quality of the test alignment was then calculated from this structure superposition by computing the RMSD [35, 36] and S c [25] values.
For multiple alignment the RMSD between each pair of domains was calculated as well as the average RMSD over all the pairs in the alignment. Since the RMSD is dependent on the number of atoms fitted [28, 29], the percentage of equivalenced atoms (Pfit) was also calculated.
The Rossmann and Argos [37] probability is an alternative criterion for computing similarity between structures [25, 37] that combines both distance and conformational terms to give the probability, P ij that residue i in one structure and residue j in the other structure are equivalent. This value was computed for all the equivalent residues of the superimposed structures that were obtained from the sequence alignment by least squares fitting of the main chain Cα atoms. The average sum of pairs (S p ) was calculated from Equation 5:

Since these scores are a function of alignment length, it is necessary to normalise them so that domains of different size may be compared [25]. Equation 6 provides a more useful measure of alignment quality:

where S c , n, L a , L b , I a , I b are structural similarity score, number of equivalent residues, length of alignment of sequence a, length of alignment of sequence b, length of gap introduced in a and length of gap introduced in b respectively.
Substitution matrices and statistics
The substitution matrices investigated by Vogt et al. [38] were tested. To be consistent with early work on AMPS and the work of Vogt et al., matrices containing negative scores were made positive by subtracting the most negative number in the matrix from all elements. The scores were made integer by multiplying all the elements by an appropriate power of 10.
Significance in the difference of performance between two sets of alignment parameters or two weight matrices was determined by the Wilcoxon Signed Rank Pair test as coded in the statistics package R [39].
Web server and database
An important goal of this work was to make the reference alignment sets, evaluation test alignments and results, and analysis software readily available to developers and users. Accordingly, we have developed WWW tools to permit the reference alignment data sets to be interrogated and to allow new alignments to be compared to the reference alignments. The facilities available from the OXBench web server (accessible via http://www.compbio.dundee.ac.uk) are described in detail in the on-line documentation, but summarised here.
The server includes a database of more than 400 sets of alignments generated by different sequence alignment methods where each set consists of alignments of the Master data set of 672 families. The database also contains full statistics on these sets of alignments. All the evaluation results and family statistics are stored in a relational database managed by the PostgreSQL system, while the sequence alignments are stored as flat files.
The reference alignment of an individual family or the whole data set can be downloaded. In addition, the sequences of any family, or of all families are also available for download. The details of each family in the OXBench reference data set are available on the server. This information can be searched by PDB code, PDB header and PDB compound. The OXBench evaluation software can be downloaded from the server, and used locally to study alignment quality. The code is written C and R and was developed on the Linux platform.
Identification of the most informative evaluation measures
In this section we sought to find which of the different evaluation measures we examined were most able to discriminate between different alignments. To do this, we applied the AMPS multiple alignment method with a range of parameters chosen deliberately to generate very varied alignments.
AMPS implements multiple sequence alignment methods based on a progressive approach [13, 14]. Multiple alignment is achieved in three steps. First, all pairs of sequences are compared. Next, the order in which they should be aligned (i.e. most similar pair through to least similar pair) is determined by cluster analysis. Finally, the sequences are aligned in that order by performing two-sequence, sequence-to-profile or profile-profile comparisons as required. AMPS has a number of options. Any substitution matrix may be employed, but the default before the work described in this paper was PAM250 [40]. The order of alignment may either follow the simple addition of one sequence at a time (single-order) or follow a tree (tree-order). Ordering may be determined by a range of alternative measures such as PID, SD score (Z-score) or Normalised Alignment Score (NAS) [14]. Optionally, for single-order, the method can iterate to refine the alignment [14].
In identifying the most informative evaluation measures we were keen to work with the complete Master data set of alignments since this provided the largest sample. Clearly, working with all the data presented a possible problem with optimisation on the test data when subsequently evaluating AMPS alongside other methods. In order to minimise the risk of bias, we tested the evaluation measures by applying AMPS with its original standard protocol of PAM250 [40] matrix and following a guide tree calculated from Z scores obtained from 100 randomisations. This protocol had been found to be effective in 10 years experience of using the program in practical applications to many different sequence families and from tests on a small number of alignments [13, 14].
Since big changes in alignment can happen when the gap-penalty is varied, we varied this single parameter over a large range and examined the effect on alignment as judged by the different evaluation measures. This was not an exhaustive attempt to find the best gap-penalty for AMPS with PAM250, but rather to generate a set of scores to highlight the differences in the evaluation measures.
Evaluation of dependent measures of alignment quality
Each family in the Master data set was aligned by AMPS [14] with the PAM250 weight matrix and a range of gap-penalties. Table 3 summarises the comparison of performance for AMPS at different gap-penalties. A gap-penalty of 9 produced the most accurate alignments as measured in the structurally conserved regions (Acc SCR ) with an average accuracy of 88.60%. The results for this penalty were not significantly better than those for a penalty of 12 (p = 0.46), but were significantly better than for all other penalties. The worst alignments were produced with gap-penalties of 0 and 30 at the two extremes, with average accuracies of 84.71% and 85.40% respectively.
Table 3 Dependent measure accuracies (i.e. comparison of test to reference alignment) for AMPS run on the Master data set at various gap-penalties sorted by Acc SCR – Clustering was performed on SD score (from 100 randomisations) with the PAM250 matrix. Acc SCR : Accuracy of Structurally Conserved Regions. AC a : Accuracy average (pairwise). AC w : Accuracy of whole alignment. PSE : Position Shift Error. NA in columns marked p indicates the highest accuracy in the preceding column, p gives the Wilcoxon Signed Rank test probability that the difference to the highest scoring row occured by chance.
The AC a and AC w show similar trends in this test, with the best AC a of 82.49% and best AC w of 74.52% both for a penalty of 12, but not significantly different to accuracies for a penalty of 9. The PSE did not discriminate between the different alignments quite as well as Acc SCR , with only the alignments generated with penalties of 18, 21, 24, 27, 30 and 0 showing significantly worse PSE values than the best alignments with a penalty of 12.
These results suggest that all the measures provide a useful ranking of quality for the alignments. However, since some regions of protein sequences usually share no common structural features and are unalignable, in the following studies, we chose the Acc SCR as the primary measure of quality.
Evaluation of independent measures of alignment quality
The performance of AMPS with default parameters judged by the independent measures RMSD, S c and Pfit on the Master data set are summarised in Table 4. As might be expected, the RMSD does not discriminate as well between the different alignment sets as S c , with penalties of 9, 12 and 15 showing no significance differences (p > 0.05). In contrast, the S c independent measure provided a better level of discrimination. The best alignments judged by S c are for a penalty of 9 (S c = 7.245) and show significant differences in S c to alignments from all gap-penalties considered, except those with a gap-penalty of 6.
Table 4 Independent accuracy measures for AMPS runs on the Master data set at various gap-penalties. Clustering was performed on significance score (from 100 randomisations) with the PAM250 matrix. S c : Scoring method based on STAMP S c [25]. RMSD: Score based on Root Means Squared Deviation. Pfit: Percentage of aligned positions without gap used in fit.
Table 3 and Table 4 show that the S c independent measure is comparable to Acc SCR at discriminating alignment quality. However, since it is simpler to understand, we focus on the dependent measure Acc SCR in the remainder of this paper.
Visualisation of alignment differences
The various measures of alignment quality provide an overall picture of different performance between methods, or parameter combinations. However, even small changes to an alignment can be critical to its utility, so a straightforward way of visualising differences between alignments is important when identifying possible improvements. We have developed scripts to to generate either HTML or input for the PostScript alignment annotating program ALSCRIPT [41] that highlights differences between alignments. Figure 8 shows one example of ALSCRIPT output, which illustrates a comparison of the sequence alignment, obtained from AMPS with the PAM250 matrix at gap-penalty 6, and the reference alignment of family 75 (Ferredoxin-like). The residues aligned differently in the two alignments are shown in yellow. The two alignments agree in the large SCR at positions 10 to 19, but disagree in the small SCRs at positions 26 to 29 and 43 to 45 where gaps have been inserted by the sequence alignment algorithm in the middle of a β-strand. Insertions in the middle of secondary structures are unusual unless they form a β-bulge and alignment quality can in general be improved by reducing the likelihood of gaps in secondary structures [5].
Figure 8
Comparison of an alignment generated by AMPS (PAM250 matrix, gap-penalty 6, tree order) and the reference structural alignment of Family 75 (Ferredoxin-like). The top block shows the AMPS alignment which contains the name of each domain, average PSE (in brackets) and the multiple alignment. The second block shows the reference multiple alignment obtained by 3D-structure comparison with STAMP [25]. The third block shows the secondary structure as determined by DSSP [26] and aligned in the same way as for the reference alignment. The Structurally Conserved Regions (SCRs) as determined by the STAMP multiple structure alignment program are boxed. Symbol 'H' in the "Pij" row indicates a STAMP [25] P ij value of 10 or higher when aligning the least similar pair of structural sub-familes in the alignment. Thus, the boxed regions show regions where the reference alignment is most reliable. Outside these regions, the proteins either do not share the same conformation, or STAMP will not label them as confidently aligned. Residues where the alignment agrees with the reference are shown with a blue background, while residues that disagree are shown with a yellow background. The Figure is produced by ALSCRIPT [41] from commands generated by OXBench software. See text for further discussion of this alignment.
The SCRs reported by STAMP and exploited in this benchmark are deliberately conservative to avoid the need to inspect every structural alignment for errors. As a consequence, some SCRs in Figure 8 could be extended by one or two residues. For example, positions 21 and 22 in Figure 8 are structurally equivalent, as is position 25 (column: DNDDG). However, positions 22–24 are less straightforward to align structurally due to the insertion in 1fdn and 1fca. Inspection of the structure superposition in this region shows that despite its position in the sequence, the proline at position 24 in 2fxb is not structurally equivalent to the prolines in 1fdn and 1fca, while the valine at position 24 in 1fdn and 1fca should be shown as an insertion.
Application of the training data set to find good parameters for the AMPS multiple alignment program
As a test of OXBench, we applied the suite to the AMPS program to see if pair-score matrices developed since 1986 might give better alignments with AMPS than the original defaults of PAM250 [40] and 8 [14].
The alignment of families in the training set was generated by AMPS with various combinations of pair-score matrix and gap-penalty by following a tree generated by clustering on Z-scores. In summary, the BLOSUM75 [42] matrix with gap-penalty 10 gave the maximum Acc SCR of 89.90% on the training set while the next best combination was the BENNER74 matrix [43] with a gap-penalty of 100 (89.7%). Application of AMPS with the best parameters from the training set (BLOSUM75 matrix, gap-penalty 10 and tree mode) gave an average Acc SCR for the test set of 90.3%. Exchanging the test and training sets did not alter the parameters that gave the best performance. While one would normally keep test and training data completely separate, since the performance of the AMPS alignments appeared to be unaffected by which training set was used, we felt it was safe for results on this method to be reported for the complete data set in all subsequent discussions and comparisons. The accuracy on the complete Master set for these parameters was lower (89.9%) than on either test set (90.3%) which gave us further confidence that comparison on the complete Master set was unlikely to enhance the apparent accuracy of AMPS over the result seen for the test data alone. The various problems of training and testing sets when benchmarking are returned to in the Discussion.
Table 5 summarises the comparison of Acc SCR obtained with the original 1987 published AMPS default protocol (single-order alignment based on Z-score, PAM250 and penalty of 8) and with the matrix and gap-penalty from optimisation of gap-penalty and choice of pair-score matrix on the training set. The average accuracy improvement over the complete set of alignments was 1.4% (p = 7.4 × 10⁻⁹) with significant improvements (p < 0.05) in all but the 0–10 average PID range. The largest average improvement was seen for the range 20–30 (5.2%, p = 0.002.)
Table 5 The performance of AMPS on the Master data set with 1987 defaults (PAM250, open gap-penalty 8, single order) and optimised (BLOSUM75, gap-penalty 10, tree order) parameters. Percentage SCR is the percentage of residues in the structurally conserved regions. Acc SCR : accuracy of alignment in SCRs. p : Wilcoxon Signed Rank test probability
As well as pair-score matrix and gap-penalty, the other adjustable parameters in AMPS are the choice of following a tree or using a single order for multiple alignment, the number of iterations, and the method used to calculate pairwise scores from which the tree is constructed. The minimum number of randomisations necessary has been considered elsewhere [44] and so was not investigated here. However, early studies on a small set of alignments suggested that the Normalised Alignment Score could be a faster to calculate and good approximation to the Z-score for clustering [14]. Accordingly, we investigated alternative strategies for clustering sequences prior to multiple alignment with AMPS.
Effect of alternative clustering methods on alignment accuracy
For the AMPS alignment results shown in Table 5, clustering was performed on SD score calculated from 100 randomisations. The accuracies of AMPS alignment based on the faster to compute PID and NAS scores for clustering were also computed and the differences summarised in Table 6 for families that contain more than two sequences (the set of Multiple Families). The order of performance for the three clustering methods as judged by average Acc SCR was SD > NAS > PID with 90.5%, 90.3% and 89.8% accuracy respectively, but the difference in accuracy between NAS and SD ordering was insignificant in all PID ranges, p > 0.1 (data not shown). In contrast, the difference in accuracy between clustering based on PID and SD was significant overall, with an improvement of 0.7% on average and 7% in the 10–20% identity range. This result confirmed our own experiences of using the AMPS package as a practical alignment tool.
Table 6 The effect of parameters used for clustering on accuracy of SCRs. Evaluation was performed on families of the Master data set which have more than two domains (the set of multiple familes). Acc SCR (SD): Accuracy when clustered by SD score. Acc SCR (NAS): Accuracy when clustered by Normalised Alignment Score [14]. Acc SCR (PID): Accuracy when clustered by percentage identity. Difference(SD-PID): Difference in SCR accuracy between clustering on SD and PID. p : Wilcoxon Signed Rank test probability (SD-PID).
Accuracy of alignment on different OXBench data sets
Comparison of multiple to pairwise alignment accuracy
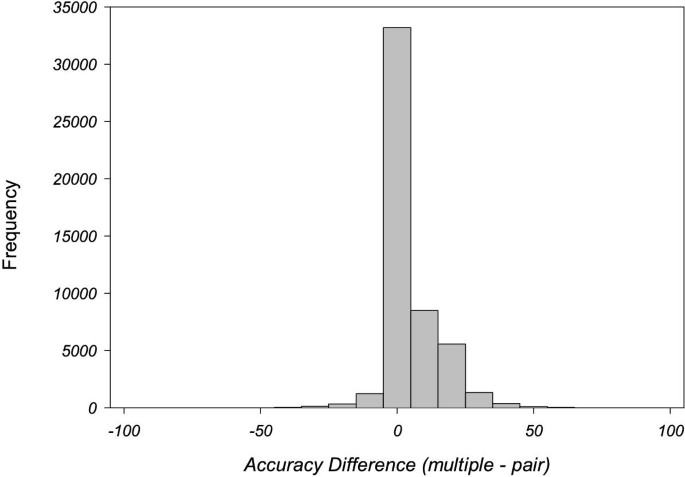
Early tests of multiple sequence alignment methods on small numbers of families, showed an improvement in accuracy of alignment for multiple when compared to pairwise alignments [14]. In order to test if this trend held for the much larger data set developed here, pairwise alignments were performed on all pairs in each family in the Master data set and compared to the multiple alignment results. Figure 9 shows the difference in Acc SCR for each pair aligned either individually or as part of the multiple alignment. The average improvement in alignment accuracy on multiple alignment was 4.7% (p < 10-16) which supports the view that multiple alignment is generally beneficial.
Figure 9
Graph showing the difference between multiple alignment accuracy and pairwise alignment accuracy for AMPS for all pairs from families with more than two members in the Master data set. A positive difference indicates better accuracy on multiple alignment.
Effect of adding additional sequences
The Extended data set provides a means of understanding the effect of extra sequences in a family on the performance of the sequence alignment method. An alignment of each family in the Extended and Master data sets was obtained by AMPS run with optimised parameters. In order to save time, clustering was performed on NAS instead of SD score. The performance of AMPS on the Master and Extended data sets is summarised in Table 7. The addition of similar sequences to families improved the accuracy of alignment by 13.6% on average in the 0–10% bin but no significant improvement was seen for higher PID. For the 50–100% bin, accuracy reduced from 98.9% to 98.8% (p = 0.0026). This drop in accuracy was presumably due to the extra diversity of sequences introduced in the Extended data set.
Table 7 The effect of additional similar sequences in a family, on the performance of AMPS applied to the Master Data Set. Clustering was performed on NAS instead of SD for efficiency with large alignments. Acc SCR (Master Data Set): Accuracy for AMPS clustered on Normalised Alignment Score (NAS) for the Master data set. Acc SCR (Extended data set): Accuracy for alignments on the data set with additional sequences. p : Wilcoxon Signed Rank Pair test significance
The effect of additional similar sequences was also examined on families with only two sequences (pairwise families). As shown in Table 8, the trends for pairwise families were similar to those shown in Table 7 with the only significant changes seen in the 0–10 and 50–100% ranges.
Table 8 The effect of additional similar sequences in a family, for the set of pairwise families only. Headings as for Table 7.
As in the comparison of multiple with pairwise alignment accuracy shown in Figure 9, these results confirm the early work on globin and immunoglobulin families that showed an improvement in alignment accuracy upon multiple alignment [14].
Effect of aligning full-length sequences
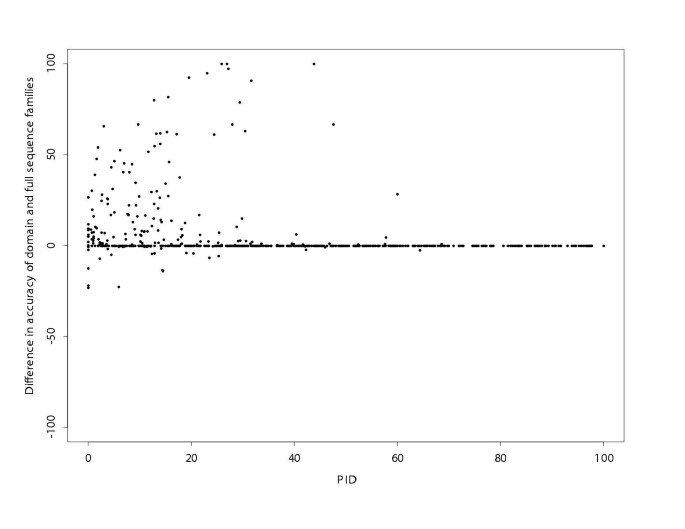
The accuracy of alignment of domain families and of full-length sequence families in different PID bins is shown in Table 9 and the accuracy difference between the Master data set alignments and full-length sequence data sets is plotted against average PID in Figure 10. As expected, domains within the full-length sequence families are less accurately aligned, a drop of 6.8%, than the domain sequence families, with the difference in accuracy significant in all but the 50–100 PID bin.
Table 9 The performance of AMPS on the Master data set of domain families and on full-length sequences that include the domains. Parameters and column labels as in Table 7.
Figure 10
The difference in Acc SCR for domain families and Full-length Sequence Families. The alignment was obtained by AMPS using BLOSUM75 and a penalty of 10 with NAS for clustering. Positive values show alignments that have higher accuracy when only the domains are compared relative to the full-length sequences that contain the domains. Data are plotted against the percentage sequence identity (PID).
Application of the benchmark to compare 8 multiple alignment methods
The OXBench suite was applied to compare and contrast AMPS (with BLOSUM75 matrix and penalty of 10, tree order from Z-scores) and 7 further methods for multiple alignment with their default parameters. The methods considered were: PILEUP, based on the progressive method of Feng and Doolittle [6] as implemented in the Wisconsin Package Version 8.1-UNIX, (August 1995). CLUSTALW 1.7 [8] which also bases alignment on a tree, but includes a number of sophistications such as variable gap-penalties and variable pair-score matrices. PRRP [17] a DNR (doubly nested randomised iterative) method for aligning multiple sequences. MSA [7, 45] which computes an optimal multiple alignment with respect to a multiple alignment scoring system that considers all sequences simultaneously. HMMER [46] hidden Markov model method, trained first on unaligned sequences then applied to align these sequences. PIMA [47, 48] which is based on a pattern construction algorithm. DIALIGN [33] is based on segment-to-segment comparison instead of residue-to-residue comparison. It constructs multiple alignments from local pairwise alignments. T-COFFEE [9] is the newest of the methods considered. T-COFFEE locates the most consistent alignments within a set of alignments and has been shown in previous studies [9] to out-perform CLUSTALW [8].
Comparison of alignment methods on the Master data set
AMPS [13, 14], CLUSTALW [8], HMMER [46], PILEUP [6], PIMA [48], and PRRP [17] are able to align large numbers of sequences and so were tested on all families of the Master data set. The performance of these methods in different percentage identity ranges is shown in Table 10. With the exception of PIMA [48], all the methods were able to align all families. PIMA was unable to align 12 large families (>90 sequences). With the exception of HMMER [46] (data not shown), all methods gave an average Acc SCR of over 88% across all families. The performance of HMMER was very poor in this study since for fair comparison with the other multiple alignment methods, no seed alignment was provided to the method. Since HMMER is not strictly a multiple alignment method and its alignments were consistently worse than all other methods, they are not discussed further in this paper.
Table 10 The Acc SCR for methods on the Master data set.
Table 11 highlights the differences in accuracy (and significance) between the methods. The order of performance based on overall average Acc SCR was PIMA < PRRP < PILEUP < CLUSTALW < AMPS. However, overall differences for AMPS versus, CLUSTALW, CLUSTALW versus PILEUP and PILEUP versus PRRP were not significant, but all other differences were significant. For the majority of methods, the most significant differences between methods occurred in the PID ranges 10–20, 20–30 and 30–50% (data not shown). For example, the 10–20% identity range has 57 alignments with an average of 45.4% of sequence in the SCRs. The difference in performance in this range between AMPS (60.2%) and CLUSTALW (55%) is 5.2% and significant at p = 0.0077. PRRP was the only method to show significant differences in the highest (50–100%) PID range. For example, in this range there are 355 alignments with on average 87.8% in the SCRs. AMPS gave 98.9% accuracy while PRRP gave 98%, a difference of 0.9% and significant at p = 10-15. One specific example is family 30t3 (Bacillus 1–3,1–4-beta-glucanase) for which PRRP gave only 40% accuracy despite the high PID of 59.1%. AMPS and CLUSTALW were able to align this family at 100% accuracy in the SCRs. Overall, AMPS with the BLOSUM75 matrix and gap-penalty of 10 gave the maximum average accuracy in all the PID ranges except 0–10%, where PILEUP gave the best performance. Second best was CLUSTALW which performed less well than AMPS in the lower PID ranges (PID ≤ 20) though the difference was only significant in the 10–20% range.
Table 11 Difference in average performance of methods on the Master data set. A positive value indicates that the row method gives a higher accuracy than the column method. Significant differences as calculated by the Wilcoxon Signed Rank Pair test are marked: †p < 0.05; ‡p < 0.01; § p < 0.001.
Evaluation of methods on families with ≤ 8 Sequences
The more computationally intensive methods are either unable to align families in the Master data set, or would take an unreasonably long time. For this reason, DIALIGN [33] MSA [33] and T-COFFEE [9] were tested on a set of small families from the master data set where the number of sequences in a family was eight or less.
Table 12 shows the order of performance based on average Acc SCR for all methods on the MSA set to be DIALIGN < PRRP < MSA ≤ PIMA < CLUSTALW ≤ PILEUP < AMPS < T-COFFEE. Table 13 illustrates the differences in overall accuracy between methods and their significance. It is perhaps surprising that MSA [45] which implements a method that attempts to optimise the multiple alignment across all sequences does not perform as well on this benchmark as the hierarchical methods. However, this probably reflects the high level of development that has gone into optimising hierarchical alignment methods for biological sequence analysis in the context of protein structure and function.
Table 12 The performance of methods on the MSA data set (families with ≤ 8 members.)
Table 13 Overall difference in performance of methods on the MSA data set. Symbols as for Table 11.
The clear winner on the MSA benchmark was the newest method T-COFFEE [9]. T-COFFEE gave an average Acc SCR over 582 families of 91.39% which was 1.71% better than the second best average accuracy achieved by AMPS (p = 4.7 × 10⁻¹⁴). Average differences in accuracy between T-COFFEE alignments and AMPS alignments were all positive, and significant in all but the 0–10% identity range. The largest improvement over AMPS was seen in the 10–20% identity range where the accuracy improves from 62.2% to 69.0% (p < 0.005). When T-COFFEE alignments were compared to CLUSTALW the improvement was even more dramatic with an increase in accuracy of 2.45% (p = 1.5e × 10-15) over all alignments and a 12.0% increase in accuracy in the 10–20% identity range.
Evaluation of pairwise alignment
The purpose of this study was to compare multiple sequence alignment methods, but in order to understand the methods closely, the performance of the methods were also examined on families with only two sequences. The results are summarised in Table 14. Overall, the order of performance of the methods was DIALIGN < PRRP < MSA ≤ PIMA < CLUSTALW ≤ AMPS < PILEUP < T COFFEE. The difference in performance of AMPS, PILEUP and CLUSTALW was not significant. This order of performance is very similar to that for multiple alignment on the Master data set, and indicates that the performance of multiple sequence alignment methods based on the progressive approach is proportional to their ability to align pairs of sequences. This suggests that to improve the accuracy of a multiple alignment method, one should first optimise performance for pairwise methods.
Table 14 Performance of methods on pairwise alignments.
Performance of methods on full-length sequence families
Only AMPS, CLUSTALW and PRRP were able to align all 614 full-length sequence families. Table 15 shows the overall trends in accuracy to be the same for these methods, but the absolute accuracy of alignment was reduced on average by 9% when compared to the Master data set test. For example, while AMPS gave 89.85% (table 16) accuracy on the Master data set, this was reduced to 80.33% on the full-length sequence families.
Table 15 Performance of methods on families of the full-length sequence data set. Only AMPS, CLUSTALW and PRRP were able to align all families in this set.
Maximum possible accuracy
The results presented so far have focused on the accuracy of methods applied with one parameter combination across a complete data set. Table 16 summarises a different view of the data where for each family, we recorded the maximum accuracy obtained by any of the methods on that family and for AMPS run with any of the parameter combinations applied to the Master set. The maximum Acc SCR for AMPS is 93.85%, 4% higher than the value obtained with BLOSUM75/10. When all methods that can run on the Master set are combined, the accuracy increases to 94.52% overall. The result shows that for families with >50% identity 100% accuracy was achieved by some parameter or method combination, while the maximum accuracy increased most in the lower PID ranges. For example, for the range 0–10% AMPS achieved 22.17%, but the maximum accuracy over all methods was 52.48%. This suggests that there is scope for improving the average accuracy of alignment by any one method to at least this level.
Table 16 Maximum accuracy achievable over all methods on each family. AMPS (Opt): results for AMPS with BLOSUM75/10 parameters. AMPS (Max): result of taking the most accurate alignment for each family over all tested parameter combinations. All Methods (Max): result of taking the most accurate alignment over AMPS (Max) and alignments by all other methods.
