Recent translational research: microarray expression profiling of breast cancer – beyond classification and prognostic markers? (original) (raw)
- Commentary
- Published: 19 July 2004
Breast Cancer Research volume 6, Article number: 192 (2004)Cite this article
- 6762 Accesses
- 18 Citations
- Metrics details
Abstract
Genomic expression profiling has greatly improved our ability to subclassify human breast cancers according to shared molecular characteristics and clinical behavior. The logical next question is whether this technology will be similarly useful for identifying the dominant signaling pathways that drive tumor initiation and progression within each breast cancer subtype. A major challenge will be to integrate data generated from the experimental manipulation of model systems with expression profiles obtained from primary tumors. We highlight some recent progress and discuss several obstacles in the use of expression profiling to identify pathway signatures in human breast cancer.
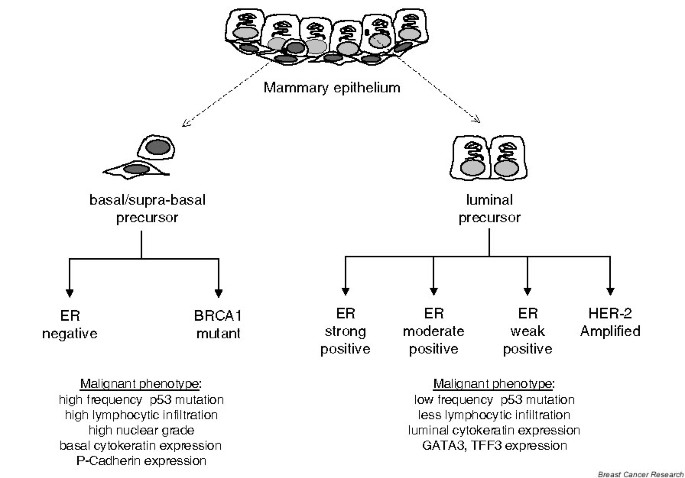
Gene expression profiling has refined the classification of human breast cancers into distinct subtypes that can be recognized in separate patient cohorts even when different microarray platforms are used [1–5]. Although the estrogen receptor (ER) and the HER-2 gene (ERBB2) remain central classifiers, the contribution of cell type has emerged as a dominant feature in gene expression profiles that segregate primary human breast cancers (Fig. 1). The biological relevance of this classification scheme is validated by clinical observations. For example, ER-negative tumors expressing basal markers exhibit a poor clinical outcome whereas ER-positive, luminal cancers are associated with a favorable prognosis [2, 4–6].
Figure 1
Cell-type origin model for the classification of human breast cancers. Illustration of the relationship between cell type and of the two main branches of the tumor subclassification schema. ER, estrogen receptor.
A logical next step is to delineate the dominant signaling pathways that drive the pathogenesis of the different breast cancer subtypes. Will expression profiling of breast cancers help achieve this goal? Can this approach facilitate the identification of new drug targets and improve the efficacy of existing targeted therapies? We believe the answer is yes, but we recognize that there are many significant challenges to be met. One of the most critical challenges, in our view, is the integration of expression data from primary human breast cancers with data obtained from the experimental manipulation of model systems.
The response of human breast cancer cells to estrogen (E2) and anti-estrogens is thoroughly examined by gene expression profiling in two recent reports [7, 8]. These new studies provide an opportunity to assess whether data generated in cell line models can be used to recognize the gene activity linked to important signaling pathways in primary tumors.
In the present commentary, we examine the feasibility of integrating microarray data generated from primary breast cancers with pathway-specific expression profiles generated experimentally. We critically explore several issues related to data quality, gene coverage and platform compatibility, as well as the confounding effect of cell type origin on the identification of the ER signaling pathway in gene expression profiles of human breast cancers.
How good are the data?
A fundamental variable to consider is the quality of the data that can be obtained from microarray expression profiling of complex, heterogeneous epithelial tumors. Specifically, are the data sufficiently quantitative to allow for the recognition of coordinated patterns of gene expression indicative of a particular signaling pathway? To determine what we might expect under the best circumstance, we examine selected genes whose expression should be particularly well coordinated in breast cancer cells.
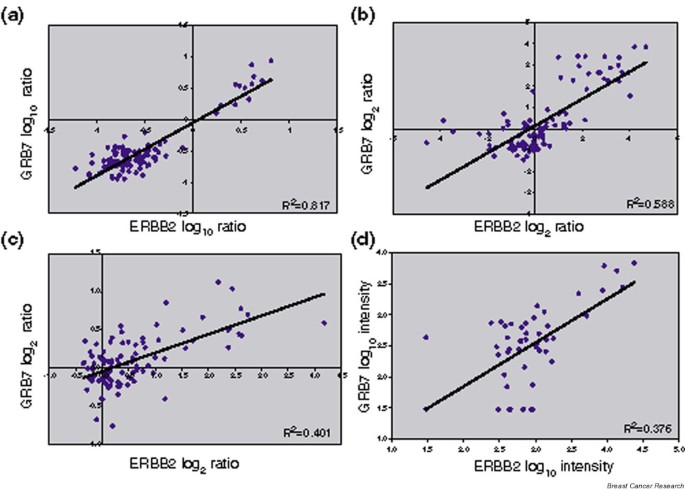
ERBB2 is amplified and pathologically overexpressed in about 25–30% of breast cancers [9] along with the neighboring gene GRB7 [10]. The log ratios or intensity values have been downloaded for these two probes from each of four publicly available primary breast cancer microarray data sets [3–5, 11]. High positive correlation coefficients for ERBB2 and GRB7 co-expression ranging from 0.633 to 0.910 (Table 1 and Fig. 2) were found in all four data sets. For each study, the corresponding graph in Fig. 2 provides a good indication of which tumors are amplified at the ERBB2 locus.
Table 1 Correlation coefficients for selected gene pairs in breast cancer microarray data
Figure 2
ERRB2 and GRB7 co-expression in microarray profiling data from primary breast cancers. The log ratios or log intensity values were downloaded for the ERBB2 and GRB7 probes from each of four publicly available microarray profiling data sets of primary breast cancers. (a) Log10 ratios generated using 60-mer oligonucleotide arrays for the 98 node-negative tumors (78 sporadic tumors and 20 BRCA1/BRCA2 mutant tumors) versus a pooled reference of all 78 sporadic breast cancer RNA from the van't Veer and colleagues data set [11]. (b) Log2 ratios generated using cDNA microarrays for 115 breast cancers and seven nonmalignant breast samples versus a universal reference RNA (mixed human cell lines) from the Sørlie and colleagues data set [4]. (c) Log2 ratios generated from cDNA microarrays for 99 unselected breast cancers versus a universal reference (mixed human cell lines) from the Sotiriou and colleagues data set [5]. (d) Log10 intensity values generated using Affymetrix oligonucleotide arrays for 49 breast cancers from the West and colleagues data set [3].
We also looked for co-expression of cytokeratins as another measure of data quality. Cytokeratins are abundant proteins that form the intermediate filaments of epithelial cells. The basic units of the fibers are heterodimers of one type I cytokeratin and one type II cytokeratin subfamily member [12], and distinct 'expression pairs' have been identified including KRT5/KRT14 and KRT8/ KRT18 [13]. Thus, these genes should show a high degree of co-expression. In every case, when the probes were present, the correlation coefficients were high for the co-expression of KRT8 with KRT18 and for the co-expression of KRT5 with KRT14 (Table 1). These correlation coefficients were in the similar range of high significance that was observed for genes co-amplified with ERBB2 (GRB7 and STARD3).
These and other examples confirm that microarray platforms have, in fact, generated high-quality gene expression data with a strong quantitative character for RNA isolated from human tumor samples. In general, the correlations and gene coverage were highest in the data of van't Veer and colleagues [11], which used a 60-mer oligonucleotide array platform representing approximately 25,000 genes. Also, these data had the fewest missing values. The reference in this study was a pool of RNA extracted from all 78 sporadic tumors. Interpreting the data intensity values in this case is simplified since it is intuitive to think of zero as the average expression of a particular gene in this breast cancer cohort [11]. We have focused on the van't Veer and colleagues data for tumor comparisons in the remaining discussions.
The ER signaling pathway is obvious in breast cancer expression profiles – or is it?
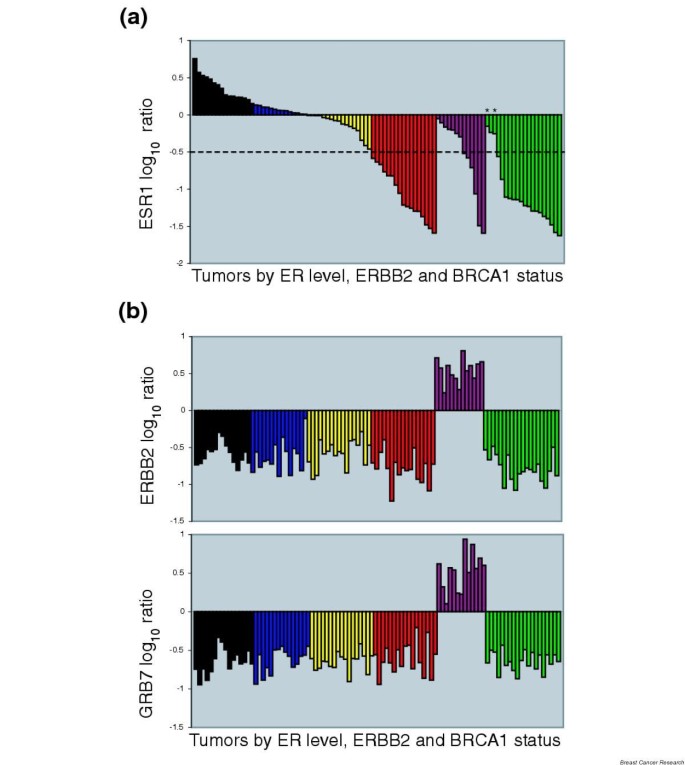
It has been often reported that the gene expression patterns associated with ER status in breast cancer are remarkably distinct and that the set of ER classifiers is comprised of up to several hundred genes [3, 11, 14–17]. We believe that many or even most of these 'ER predictors' primarily distinguish tumors according to cell-type origin (i.e. those tumors with predominantly 'luminal features' from those tumors with predominantly 'basal features' [1]) rather than according to ER regulation. To make this argument, the expression ratios of estrogen receptor message (ESR1) and ERBB2 from the van't Veer and colleagues data [11] were used to divide the 78 sporadic tumors into five groups. The samples are arranged from highest to lowest ESR1 level in Fig. 3a, with the ERBB2 tumors grouped separately. The ERBB2 tumors were identified by positive values for both ERBB2 and GRB7 (Fig. 3b). A sixth group was defined based on BRCA1/BRCA2 mutation status (Fig. 3).
Figure 3
Breast cancer subgroups defined by estrogen receptor message (ESR1) expression, ERRB2 amplification and BRCA1/BRCA2 mutation status. (a) ESR1 values in the van't Veer and colleagues tumor samples [11]. The expression ratios for ESR1, ERRB2 and GRB7 along with the mutational status of BRCA1/BRCA2 were used to delineate the breast cancers into six subgroups. The ERBB2-positive tumors (purple) are grouped separately and arranged from highest to lowest ESR1 level. The samples containing BRCA1 or BRCA2 mutations (dark green) are also grouped separately and arranged from highest to lowest ESR1. The two BRCA2 samples are marked with asterisks. The remaining tumors are arranged by ESR1 level and colored as highly positive (black; ESR log ratio > 0.2), moderately positive (blue; ESR1 > 0 and ESR1 < 0.2), weakly positive (yellow; ESR1 < 0 and ESR1 > -0.5), and negative (red; ESR1 < -0.5). The dotted line represents an estimation of true estrogen receptor (ER) negativity by immunohistochemistry comparison. (b) High ERBB2 expression levels are the result of gene amplification. The samples are arranged in the same order and colored as in (a). Upper, ERRB2 intensity ratios; lower, co-amplified GRB7 intensity ratios.
Figure 3 highlights several important features of the data. The first is that ESR1 is expressed as a continuous variable whereas ERBB2 and GRB7 have essentially a binary expression pattern due to gene amplification. Second, none of the ERBB2 samples have above average (positive log ratios) values for ESR1. This is consistent with other larger data sets measuring ERBB2 and ER protein levels as continuous variables, where it has been suggested that low ER levels contribute to the reduced anti-estrogen sensitivity of ERBB2 amplified tumors [18]. Another feature is that the assignment of -0.5 as the cutoff for 'true' ER negativity results in 17/18 of the BRCA1 tumors being classified as ER-negative, as has been confirmed elsewhere [19]. Only the two BRCA2 (Fig. 3a) samples and a single BRCA1 tumor appear to express any ESR1.
We also classified the tumors from the breast cancer data sets [3–5] based on the level of ESR1 alone and compared these results with the subgroups generated by the various clustering methods (see Additional file 1). All of the tumors defined as basal using clustering methods were in the lowest ESR1 category, and nearly all luminal A or luminal 1 tumors were found in the highest ESR1 groups. It is clear that the tumor groups defined by the extremes of ESR1 expression are the most easily recognized and consistently observed subtypes of breast cancer. Tumors with mid-range ESR1 expression (luminal B/C, luminal 2) will require further analysis with larger numbers of tumors to define the dominant molecular signals driving their pathogenesis.
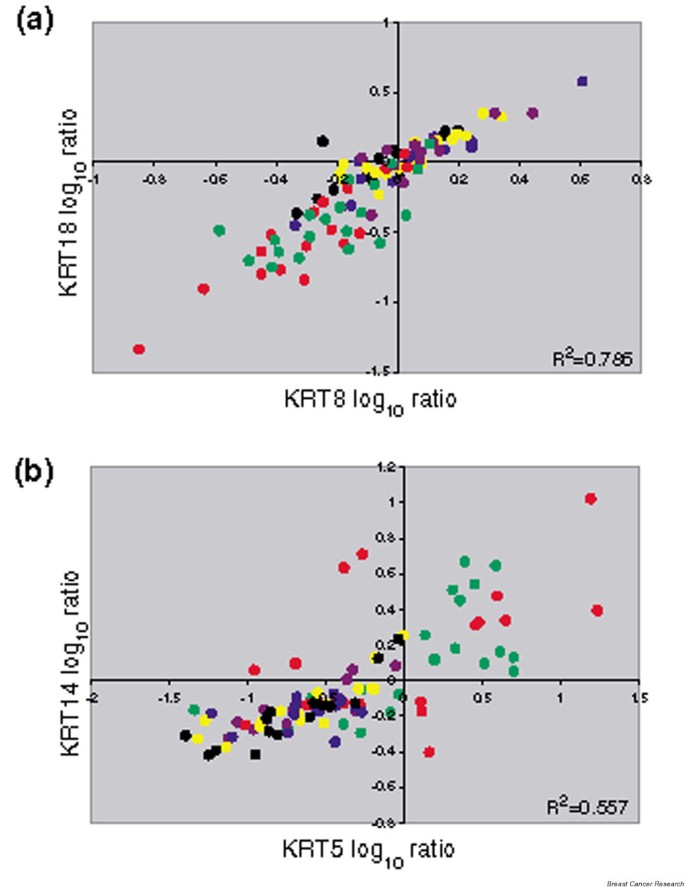
As previously reported, the signatures of luminal cell types versus basal cell types are dominant in the expression profiles obtained from primary breast cancer [1–5]. One explanation for these strikingly different patterns is that the cell type in which the oncogenic transformation took place is fundamentally different in these two tumor groups (Fig. 1). The use of even a small number of markers illustrates this distinction. We show the co-expression of the prototypical luminal cytokeratins (KRT8/KRT18) and the basal cytokeratins (KRT5/KRT14) from the van't Veer and colleagues study [11] in Fig. 4.
Figure 4
Cell-type-specific cytokeratin expression in breast cancer subgroups. The log ratios for the cytokeratin probes for the van't Veer and colleagues tumor samples [11] are colored by group as in Fig. 3. (a) Co-expression of the luminal KRT8 and KRT18 is found in the estrogen receptor (ER)-positive tumors (black, blue and yellow) and in the ERRB2-positive tumors (purple). (b) Co-expression of the basal KRT5 and KRT14 is found in the ER-negative tumors (red) and in the BRCA1 mutant tumors (dark green).
The samples clearly show coordinated expression of KRT8 and KRT18 (Fig. 4a), and a striking pattern is apparent. Four different groups comprise the majority of the samples having positive values for KRT8/KRT18: the ESR1 expressing groups (strong ESR1, moderate ESR1 and weak ESR1) and the ERBB2 amplified samples. It should be noted, however, that within these four groups the expression of these luminal cytokeratins does not correlate with the level of ESR1 expressed. The ESR1-negative tumors, including both the sporadic and BRCA1 mutant samples, stand out as having especially low levels of KRT8/KRT18.
The reverse is true for the expression of KRT5 and KRT14 (Fig. 4b), as well as for KRT5 and KRT17 (data not shown). It is the 'truly' ER-negative tumors that have high basal cytokeratin expression, and the four groups of luminal tumors cluster together in the negative region of the plot. There are hundreds of genes that divide these tumor samples into these two main groups (luminal and basal), and these genes are often a major component of the various ER discriminator gene sets [3, 11, 14–17]. However, the role of these genes in ER signaling and their regulation by either E2 or the ER remain unconfirmed.
Functional identification of E2-responsive genes
The ligand-dependent genomic action of the ER is relatively well understood and the in vitro analysis of E2-responsive genes in breast cancer cells has been actively pursued for many years [20]. Part of the Cunliffe and colleagues study [7] was to characterize the dynamic transcriptional response of two different breast cancer cell lines (MCF-7, T47D) to 17β-estradiol and anti-estrogens (ICI 182,780 and 4-hydroxy tamoxifen) using a custom-made 10 K cDNA array. This resulted in the identification of 386 hormone-responsive genes.
The study by Frasor and colleagues [8] was undertaken to better understand the transcriptional activities of selective ER modulators in breast cancer cells. They report the transcriptional changes induced in MCF-7 cells by E2, and classify the genes according to their response to the pure anti-estrogens (ICI 182,780) and _trans_-hydroxytamoxifen and raloxifene using the Affymetrix Hu95A array. Their analysis identified a highly focused E2-responsive gene signature of 129 genes.
We compared the MCF-7 expression data in these two recent studies in terms of the E2 and ICI treatment responses (Table 2). The overlap consists of a surprisingly small number of genes (n = 10) despite a very similar, well-controlled experimental design. Potential genetic drift in the MCF-7 cell line is a possible explanation for the limited overlap; however, cross-platform consistency is the primary suspect.
Table 2 Estrogen-regulated genes in MCF-7 breast cancer cells
The issue of cross-platform consistency has been recently explored in detail [21, 22]. In one study, the correlation for gene expression data from breast cancer cell lines obtained using Affymetrix HG-U95v2 and a custom-made cDNA array was found to be in the range 0.66–0.76 [21]. The differences between platforms appear to result from errors in chip fabrication, ambiguities in gene annotation, specificity differences inherent in the hybridization of oligonucleotides versus cDNA clones and alternative methods for data filtering and normalization [21]. The authors found that the biological differences between the cell lines (e.g. BT-474 versus MCF-7) were more prominent than the variation between platforms. However, it appears probable that platform variability actually exceeds changes in expression induced by treating MCF-7 cells with E2. In this light, the failure to find a robust consensus gene signature for the E2 signaling pathway is not surprising.
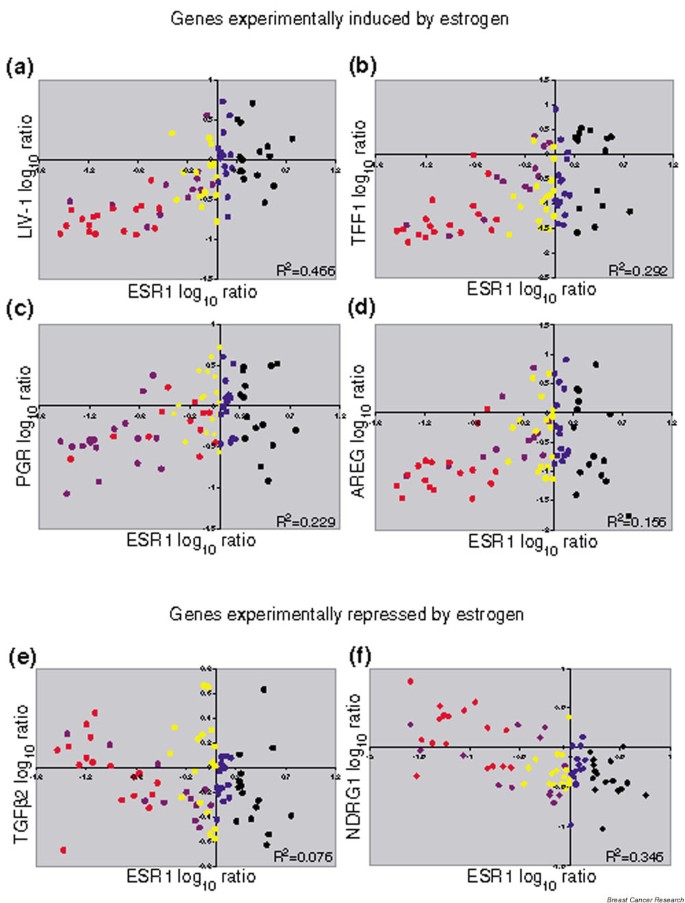
Despite the disappointing overlap, some of the genes identified in these two studies are still likely to be valid targets of ER signaling. In order to investigate the feasibility of integrating experimentally generated pathway responses with data from primary tumors, we focused on a few specific genes identified in each of the in vitro studies. The expression values for each gene were plotted against the ESR1 level for the sporadic tumors (n = 78) in the data of van't Veer and colleagues (Fig. 5).
Figure 5
Estrogen-modulated genes and their co-expression in estrogen receptor-positive primary breast cancers. The log ratios of the four experimentally confirmed, estrogen-induced genes (a) LIV-1, (b) TFF1, (c) PGR and (d) AREG were plotted against ESR1 from the van't Veer and colleagues data [11]. Data for genes shown to be repressed by estrogen treatment in MCF-7 cells [8] are also plotted against ESR1: (e) TGFβ2 and (f) NDRG1. The samples are colored by group, as in Figs 3 and 4. Only values for the five subgroups of sporadic tumors (n = 78) are plotted and used for the R 2 calculations. The data for the BRCA1/BRCA2 subgroup (dark green) are not shown.
We compared LIV-1, AREG, TFF1 and PGR with the ESR1 expression levels in the van't Veer and colleagues data [11]. LIV-1 and AREG were identified as E2-induced and ICI-repressed in the Frasor and colleagues study [8] and TFF1 was found to be E2-induced and ICI-repressed in the Cunliffe and colleagues study [7]. PGR, the best known target of liganded ER, was not identified in either study. Each experimentally identified target gene showed a reasonably good correlation with ESR1 in the van't Veer and colleagues data (Table 1), and an interesting pattern is evident when plotted using the color-coded groups (Fig. 5a,5b,5c,5d). There is a trend for higher expression of these E2-stimulated genes in the samples that express more ESR1: moderate ESR1 samples > weak ESR1 samples. We also examined the expression of several of the genes identified by Frasor and colleagues to be downregulated by E2 and upon which ICI acted as an antagonist. Two of these genes, TGFβ2 and NRDG1, have negative correlations to ESR1 in the data of van't Veer and colleagues [11], consistent with being targets of repression by ER signaling (Table 1 and Fig. 5e,5f).
The quantitative expression of ER has been shown to have clear clinical implications both in the adjuvant and the metastatic setting in terms of response to anti-estrogen therapy [23–25]. This is certainly consistent with the concentration-dependent occupancy of _cis_-regulatory sites being a fundamental aspect of DNA-binding transcription factors. It is interesting to note that about one-half of the tumors with the highest ESR1 expression do not show co-expression of PGR, AREG or TFF1 (Fig. 5b,5c,5d). The ER signaling pathway in these very highly ESR1 expressing samples may thus be fundamentally different. In a patient cohort very similar to this one (node-negative patients, younger than 60 years old at diagnosis), where ER protein was measured quantitatively, a paradoxical reduction in overall survival was associated with very high ER levels [26]. The clinical outcome data in the van't Veer and colleagues study also exhibits a trend towards a worse prognosis in the highest ESR1 subgroup (see Additional file 2).
Conclusions
The E2 response in breast cancer cells would seem to provide a straightforward opportunity for microarrays to demonstrate their utility in identifying pathway signatures based on gene expression profiles. ER is a transcription factor with well-characterized _cis_-regulatory sites, and we have an abundance of hormone receptor agonists and antagonists at our disposal with which to modulate its activity. Decades of clinical and laboratory research with these compounds have validated the central importance of E2 and ER in the pathogenesis of breast cancer. There is also strong evidence indicating that the currently employed microarray platforms can support the quantitative analysis of cell and tumor transcriptional programs.
So why is the global ER gene expression signature for E2-responsive breast cancer cells still unclear? There are several factors in addition to the cross-platform comparison issues already discussed. One longstanding technical obstacle is the over-reliance on a single ER-positive breast cancer cell line (MCF-7) or on only a few ER-positive breast cancer cell lines (ZR-75-1, T47D) as experimental models. We have suggested that the true ER signature may be much smaller than originally proposed due to a failure to appreciate the close association between luminal cell differentiation and ER activity. The data in Figure 4 suggest that this association may be circumstantial. Alternatively, it is possible that breast cancers arise from a transforming event in multipotent progenitor cells and that acquired alterations (e.g. high autocrine ER stimulation or ERBB2 amplification) drive the differentiation of the malignant cells towards a luminal fate.
Global gene expression profiling has fundamentally changed the way we look at cancer cells by providing simultaneous measures of the activity of thousands of genes. We are optimistic that the quantitative ER pathway data generated by microarray experiments will better predict patient prognosis and clinical response to anti-estrogen therapy. Although many significant challenges remain, these technologies will undoubtedly play an important role as we identify new therapeutic targets and improve the efficacy of current breast cancer treatments.
Abbreviations
AREG:
amphiregulin
E2:
estrogen
ER:
estrogen receptor protein
ESR1:
estrogen receptor message
PGR:
progesterone receptor message.
References
- Perou CM, Sorlie T, Eisen MB, van de Rijn M, Jeffrey SS, Rees CA, Pollack JR, Ross DT, Johnsen H, Akslen LA, et al: Molecular portraits of human breast tumours. Nature. 2000, 406: 747-752. 10.1038/35021093.
Article CAS PubMed Google Scholar - Sørlie T, Perou CM, Tibshirani R, Aas T, Geisler S, Johnsen H, Hastie T, Eisen MB, van de Rijn M, Jeffrey SS, et al: Gene expression patterns of breast carcinomas distinguish tumor subclasses with clinical implications. Proc Natl Acad Sci USA. 2001, 98: 10869-10874. 10.1073/pnas.191367098.
Article PubMed PubMed Central Google Scholar - West M, Blanchette C, Dressman H, Huang E, Ishida S, Spang R, Zuzan H, Olson JA, Marks JR, Nevins JR: Predicting the clinical status of human breast cancer by using gene expression profiles. Proc Natl Acad Sci USA. 2001, 98: 11462-11467. 10.1073/pnas.201162998.
Article CAS PubMed PubMed Central Google Scholar - Sørlie T, Tibshirani R, Parker J, Hastie T, Marron JS, Nobel A, Deng S, Johnsen H, Pesich R, Geisler S, et al: Repeated observation of breast tumor subtypes in independent gene expression data sets. Proc Natl Acad Sci USA. 2003, 100: 8418-8423. 10.1073/pnas.0932692100.
Article PubMed PubMed Central Google Scholar - Sotiriou C, Neo SY, McShane LM, Korn EL, Long PM, Jazaeri A, Martiat P, Fox SB, Harris AL, Liu ET: Breast cancer classification and prognosis based on gene expression profiles from a population-based study. Proc Natl Acad Sci USA. 2003, 100: 10393-10398. 10.1073/pnas.1732912100.
Article CAS PubMed PubMed Central Google Scholar - van de Rijn M, Perou CM, Tibshirani R, Haas P, Kallioniemi O, Kononen J, Torhorst J, Sauter G, Zuber M, Kochli OR, et al: Expression of cytokeratins 17 and 5 identifies a group of breast carcinomas with poor clinical outcome. Am J Pathol. 2002, 161: 1991-1996.
Article CAS PubMed PubMed Central Google Scholar - Cunliffe HE, Ringner M, Bilke S, Walker RL, Cheung JM, Chen Y, Meltzer PS: The gene expression response of breast cancer to growth regulators: patterns and correlation with tumor expression profiles. Cancer Res. 2003, 63: 7158-7166.
CAS PubMed Google Scholar - Frasor J, Stossi F, Danes JM, Komm B, Lyttle CR, Katzenellenbogen BS: Selective estrogen receptor modulators: discrimination of agonistic versus antagonistic activities by gene expression profiling in breast cancer cells. Cancer Res. 2004, 64: 1522-1533.
Article CAS PubMed Google Scholar - Slamon DJ, Clark GM, Wong SG, Levin WJ, Ullrich A, McGuire WL: Human breast cancer: correlation of relapse and survival with amplification of the HER-2/neu oncogene. Science. 1987, 235: 177-182.
Article CAS PubMed Google Scholar - Stein D, Wu J, Fuqua SA, Roonprapunt C, Yajnik V, D'Eustachio P, Moskow JJ, Buchberg AM, Osborne CK, Margolis B: The SH2 domain protein GRB-7 is co-amplified, overexpressed and in a tight complex with HER2 in breast cancer. Embo J. 1994, 13: 1331-1340.
CAS PubMed PubMed Central Google Scholar - van't Veer LJ, Dai H, van de Vijver MJ, He YD, Hart AA, Mao M, Peterse HL, van der Kooy K, Marton MJ, Witteveen AT, et al: Gene expression profiling predicts clinical outcome of breast cancer. Nature. 2002, 415: 530-536. 10.1038/415530a.
Article Google Scholar - Moll R, Franke WW, Schiller DL, Geiger B, Krepler R: The catalog of human cytokeratins: patterns of expression in normal epithelia, tumors and cultured cells. Cell. 1982, 31: 11-24. 10.1016/0092-8674(82)90400-7.
Article CAS PubMed Google Scholar - Cooper D, Schermer A, Sun TT: Classification of human epithelia and their neoplasms using monoclonal antibodies to keratins: strategies, applications, and limitations. Lab Invest. 1985, 52: 243-256.
CAS PubMed Google Scholar - Dressman MA, Walz TM, Lavedan C, Barnes L, Buchholtz S, Kwon I, Ellis MJ, Polymeropoulos MH: Genes that co-cluster with estrogen receptor alpha in microarray analysis of breast biopsies. Pharmacogenomics J. 2001, 1: 135-141.
Article CAS PubMed Google Scholar - Gruvberger S, Ringner M, Chen Y, Panavally S, Saal LH, Borg A, Ferno M, Peterson C, Meltzer PS: Estrogen receptor status in breast cancer is associated with remarkably distinct gene expression patterns. Cancer Res. 2001, 61: 5979-5984.
CAS PubMed Google Scholar - Pusztai L, Ayers M, Stec J, Clark E, Hess K, Stivers D, Damokosh A, Sneige N, Buchholz TA, Esteva FJ, et al: Gene expression profiles obtained from fine-needle aspirations of breast cancer reliably identify routine prognostic markers and reveal large-scale molecular differences between estrogen-negative and estrogen-positive tumors. Clin Cancer Res. 2003, 9: 2406-2415.
CAS PubMed Google Scholar - Gruvberger-Saal SK, Eden P, Ringner M, Baldetorp B, Chebil G, Borg A, Ferno M, Peterson C, Meltzer PS: Predicting continuous values of prognostic markers in breast cancer from microarray gene expression profiles. Mol Cancer Ther. 2004, 3: 161-168.
CAS PubMed Google Scholar - Konecny G, Pauletti G, Pegram M, Untch M, Dandekar S, Aguilar Z, Wilson C, Rong HM, Bauerfeind I, Felber M, et al: Quantitative association between HER-2/neu and steroid hormone receptors in hormone receptor-positive primary breast cancer. J Natl Cancer Inst. 2003, 95: 142-153. 10.1093/jnci/95.2.142.
Article CAS PubMed Google Scholar - Foulkes WD, Metcalfe K, Sun P, Hanna WM, Lynch HT, Ghadirian P, Tung N, Olopade OI, Weber BL, McLennan J, et al: Estrogen receptor status in BRCA1- and BRCA2-related breast cancer: the influence of age, grade, and histological type. Clin Cancer Res. 2004, 10: 2029-2034.
Article CAS PubMed Google Scholar - Hall JM, Couse JF, Korach KS: The multifaceted mechanisms of estradiol and estrogen receptor signaling. J Biol Chem. 2001, 276: 36869-36872. 10.1074/jbc.R100029200.
Article CAS PubMed Google Scholar - Jarvinen AK, Hautaniemi S, Edgren H, Auvinen P, Saarela J, Kallioniemi OP, Monni O: Are data from different gene expression microarray platforms comparable?. Genomics. 2004, 83: 1164-1168. 10.1016/j.ygeno.2004.01.004.
Article CAS PubMed Google Scholar - Mecham BH, Klus GT, Strovel J, Augustus M, Byrne D, Bozso P, Wetmore DZ, Mariani TJ, Kohane IS, Szallasi Z: Sequence-matched probes produce increased cross-platform consistency and more reproducible biological results in microarray-based gene expression measurements. Nucleic Acids Res. 2004, 32: e74-10.1093/nar/gnh071.
Article PubMed PubMed Central Google Scholar - Campbell FC, Blamey RW, Elston CW, Morris AH, Nicholson RI, Griffiths K, Haybittle JL: Quantitative oestradiol receptor values in primary breast cancer and response of metastases to endocrine therapy. Lancet. 1981, 2: 1317-1319. 10.1016/S0140-6736(81)91341-6.
Article CAS PubMed Google Scholar - Fisher B, Redmond C, Brown A, Wickerham DL, Wolmark N, Allegra J, Escher G, Lippman M, Savlov E, Wittliff J, et al: Influence of tumor estrogen and progesterone receptor levels on the response to tamoxifen and chemotherapy in primary breast cancer. J Clin Oncol. 1983, 1: 227-241.
Article CAS PubMed Google Scholar - Early Breast Cancer Trialists' Collaborative Group: Tamoxifen for early breast cancer: an overview of the randomised trials. Lancet. 1998, 351: 1451-1467. 10.1016/S0140-6736(97)11423-4.
Article Google Scholar - Struse K, Audretsch W, Rezai M, Pott G, Bojar H: The estrogen receptor paradox in breast cancer: association of high receptor concentrations with reduced overall survival. Breast J. 2000, 6: 115-125. 10.1046/j.1524-4741.2000.99060.x.
Article PubMed Google Scholar
Acknowledgement
The authors thank Frank Calzone for discussion and critical review of the manuscript.
Author information
Authors and Affiliations
- Department of Hematology/Oncology, David Geffen School of Medicine at UCLA, University of California, Los Angeles, USA
Cindy A Wilson & Judy Dering
Authors
- Cindy A Wilson
You can also search for this author inPubMed Google Scholar - Judy Dering
You can also search for this author inPubMed Google Scholar
Corresponding author
Correspondence toCindy A Wilson.
Additional information
Competing interests
None declared.
Electronic supplementary material
Authors’ original submitted files for images
Rights and permissions
About this article
Cite this article
Wilson, C.A., Dering, J. Recent translational research: microarray expression profiling of breast cancer – beyond classification and prognostic markers?.Breast Cancer Res 6, 192 (2004). https://doi.org/10.1186/bcr917
- Published: 19 July 2004
- DOI: https://doi.org/10.1186/bcr917
