A chitinase-3-like protein-1-based nomogram for identification of significant liver fibrosis in the general population (original) (raw)
Abstract
Background
Serum chitinase-3-like protein-1 (CHI3L1) level is significantly correlated with fibrosis in chronic liver diseases. Therefore, we aimed to develop a CHI3L1-based model to predict significant liver fibrosis in the general population.
Methods
This retrospective cross-sectional study enrolled 6361 participants (4452 training and 1909 validation). Least absolute shrinkage and selection operator (LASSO) with variance inflation factor (VIF) analysis was employed for variable selection. Multivariable logistic regression analyses were used to construct a nomogram model. The clinical utility of the nomogram model was compared with that of the fibrosis-4 index (FIB-4) and non-alcoholic fatty liver disease fibrosis score (NFS) using receiver operating characteristic curves with comparisons of areas under the curve (AUCs), decision curve analysis (DCA), clinical impact curves (CIC), and stratified subgroup analysis.
Results
The nomogram model was composed of five variables: waist circumference, body mass index, aspartate aminotransferase, homeostatic model assessment of insulin resistance, and CHI3L1. The model obtained AUCs of 0.795 and 0.802 in the training and validation cohorts, respectively, which were significantly greater than those of FIB-4, NFS, and CHI3L1 alone, ranging from 0.573 to 0.612. Furthermore, DCA demonstrated greater net benefit across clinically relevant threshold, while CIC confirmed robust risk stratification. Consistent performance was observed in the metabolic dysfunction-associated steatotic liver disease (MASLD) population.
Conclusions
This novel nomogram showed good performance and clinical utility in predicting significant liver fibrosis and could be used as an ideal screening tool for the general population.
View this article's peer review reports
Background
Cirrhosis is a common cause of death worldwide and the third leading cause of death in people aged 45–64 years [1]. Epidemiological studies have shown that the increasing incidence of nonalcoholic fatty liver disease (NAFLD) and alcoholic liver disease (ALD) in parallel with the epidemic of obesity, diabetes, and alcohol abuse is increasing the prevalence of cirrhosis [2, 3]. Since cirrhosis often occurs after a long period of asymptomatic chronic liver inflammation alongside progressive hepatic fibrosis, 75% of patients with liver cirrhosis are diagnosed after their first experience of severe complications related to liver failure, portal hypertension, or liver cancer [4, 5]. Owing to the high number of disability-adjusted life-years (DALYs) generated by liver cirrhosis at the decompensating stage, cirrhosis has a vital negative impact on the global healthcare system [6].
According to the severity revealed by pathology studies or transient elastography (TE) analyses, liver fibrosis can be classified into 5 grades (F0 to F4). To our knowledge, advanced stage liver fibrosis is an independent predictor of long-term prognosis in patients with chronic liver disease. Individuals with significant liver fibrosis (stratified as grades F2-F4) are at a considerably greater risk of developing cirrhosis and hepatocellular carcinoma, while those with mild liver fibrosis (classified as grades F0-F1) would endure similar risks on average a decade later [7]. Therefore, it is crucial to identify individuals with significant fibrosis who are at risk of cirrhosis so that early lifestyle modifications or therapeutic interventions can be implemented to prevent cirrhosis development.
Currently, the existing screening methods for liver fibrosis in the general population still have substantial limitations. Liver biopsy is the gold standard for the diagnosis of liver fibrosis; however, it is not a realistic option for routine screening because of its high cost, high invasiveness, and possibility of procedure-related morbidity and mortality [8, 9]. TE features high accuracy and reproducibility in detecting and grading liver fibrosis; however, the lack of instrument availability limits its widespread application in population screening [10, 11]. Serum-based evaluation approaches have multiple advantages, including high applicability, wide availability, and low cost, and are therefore proposed as good methods for the population-based screening of liver fibrosis [12]. Conventional fibrosis scores, such as the fibrosis-4 index (FIB-4) and nonalcoholic fatty liver disease fibrosis score (NFS), however, showed suboptimal performance in the screening of liver fibrosis in the general population because of the high rate of diagnostic errors [13, 14]. It is necessary to develop an accurate and cost-effective tool using easily obtainable laboratory or clinical variables for the efficient identification of significant liver fibrosis in a population without known liver diseases.
Chitinase-3-like protein-1(CHI3L1) is a liver-enriched glycoprotein produced by many cells, including macrophages and hepatic stellate cells [15, 16]. It is associated with various physiological and pathophysiological processes including cell survival, proliferation, tissue remodeling, and angiogenesis. In various chronic liver diseases, the serum CHI3L1 level is regarded as a feasible biomarker for predicting liver fibrosis [17,18,19,20]. Specifically, CHI3L1, in combination with other serum biomarkers, exhibits good diagnostic value for significant fibrosis in viral hepatitis and NAFLD [15, 21]. However, in the general population, whether CHI3L1 is equally applicable for efficient screening of early liver fibrosis remains unclear.
To investigate the role of CHI3L1 in the general population, we verified the association between CHI3L1 levels and liver fibrosis development in individuals undergoing routine medical examinations, and proposed a novel noninvasive screening method to accurately identify significant liver fibrosis.
Methods
Study design and participants
This cross-sectional single-center study was conducted based on the database of the Health Management Center of the First Affiliated Hospital, Zhejiang University School of Medicine. The enrollment procedure is illustrated in Fig. 1. A total of 6411 participants who underwent both FibroTouch (FT) and serum CHI3L1 tests from January 2022 to December 2023 were initially included. Fifty participants (0.78%) with incomplete medical information were excluded from this study. Given the minimal proportion of missing data, a complete-case analysis (direct deletion) was employed to maintain data integrity. Finally, 6361 participants included in the study were randomly assigned to a training cohort (n = 4452) or a validation cohort (n = 1909) using a random number table at a ratio of 7:3. The study was approved by the Ethics Committee of the First Affiliated Hospital of the Zhejiang University School of Medicine.
Fig. 1
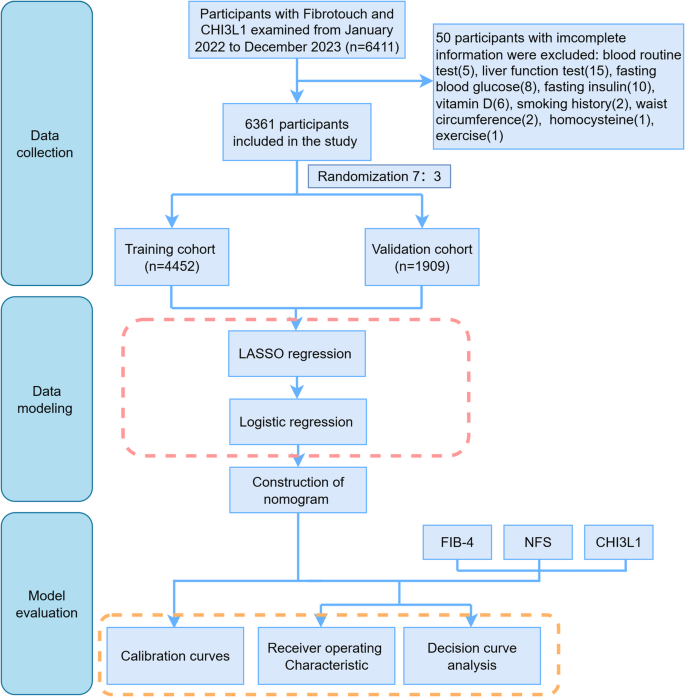
Flow chart of the study design
Clinical data collection
Demographic information, including age, sex, physical activity, alcohol consumption, smoking, history of hypertension and diabetes, and medication use, was recorded by examining the physicians during the checkup. Height, weight, waist circumference (WC), and blood pressure were measured according to a standardized protocol. Body mass index (BMI) was calculated as weight (kg) divided by height in meters squared (m2). Hypertension was defined as a blood pressure ≥ 140/90 mmHg, self-reported history, or the use of antihypertensive agents. Diabetes was defined as a self-reported history of diabetes, use of hypoglycemic agents, or blood glucose within a specific range (i.e., fasting plasma glucose [FPG] ≥ 7.0 mmol/l and hemoglobin A1c [HbA1c] ≥ 6.5%). Impaired fasting glycemia was defined as an FPG ranging from 6.1 to 7.0 mmol/L or an HbA1c ranging from 5.7 to 6.5% [22].
Blood samples were collected after overnight fasting and analyzed. The parameters examined included white blood cell (WBC) count, neutrophil–lymphocyte ratio (NLR), platelet count (PLT), alanine transaminase (ALT), aspartate aminotransferase (AST), gamma-glutamyl transferase (GGT), total bile acid (TBA), total bilirubin (TBiL), albumin (ALB), uric acid (UA), total cholesterol (TC), triglyceride (TG), low-density lipoprotein (LDL), high-density lipoprotein (HDL), FPG, HbAlc, FINS (fasting insulin), homocysteine (Hcy), and 1,25-hydroxyvitamin D3 (1,25(OH)2D3). Insulin resistance was quantified using the homeostatic model assessment of insulin resistance (HOMA-IR), calculated as FPG (mmol/L) × FINS (µU/mL)/22.5 [23].
Liver stiffness measurement (LSM)
Liver stiffness was measured by trained and certified clinicians using FT (FibroTouch-FT5000, Hisky, Wuxi, China), according to the manufacturer’s instructions. The FibroTouch-FT5000 device is equipped with a broadband dynamic probe for adaptation to participants with different body types and an ultrasound probe to provide 2D image guidance for better positioning of the liver tissue. Ten consecutive valid tests were conducted for each participant. The median value of these measurements was considered representative of liver elasticity. Operators were blinded to the clinical data of the participants. Significant liver fibrosis and above (fibrosis grade ≥ F2) was defined as LSM values ≥ 7.85 kPa [24].
Noninvasive markers of liver fibrosis
Serum CHI3L1 levels were determined using a CHI3L1 double-antibody sandwich enzyme-linked immunosorbent assay (ELISA) kit (Proprium Biotech, Hangzhou, China). The FIB-4 score and NFS were calculated using the following formulae: [25, 26] \begin{aligned}\mathrm{FIB}&-4\;=\;\left(\mathrm{age}\;\left[\mathrm{year}\right]\;\times\;\mathrm{AST}\;\left[\mathrm U/\mathrm L\right]\rbrack\right)\\&/\left(\mathrm{platelet}\;\mathrm{count}\;\left[\times10^9/\mathrm L\right]\;\times\;\mathrm{ALT}\;\left(\mathrm U/\mathrm L\right)^{1/2}\right)\end{aligned}$$ \begin{aligned}\mathrm{NFS}\:&=\:1.625\:+\:0.037\;\times\;\mathrm{age}\;(\mathrm{years})\:\\&+\:0.094\;\times\;\mathrm{BMI}\;(\mathrm{kg}/\mathrm m<\sup>2</\sup>)\:\\&+\:1.13\;\times\;\mathrm{prediabetes}\;\mathrm{or}\;\mathrm{diabetes}\;(\mathrm{yes}\:=\:1,\;\mathrm{no}\:=\:0)\:\\&+\:0.99\;\times\;(\mathrm{AST}/\mathrm{ALT})\:\\&-\:0.013\;\times\;\mathrm{platelet}\;\mathrm{counts}\;(\times10<\sup>9</\sup>/\mathrm L)\;\\&-\;0.66\;\times\;\mathrm{albumin}\;(\mathrm{Alb})\;(\mathrm g/\mathrm{dL})\end{aligned}$$
Diagnosis of metabolic dysfunction-associated steatosis liver disease (MASLD)
MASLD was diagnosed based on the presence of an imaging-defined fatty liver with at least one of the following five concurrent cardiometabolic risk factors [27]: (1) BMI ≥ 23 kg/m2 (Asian) or WC > 94 cm (male) or 80 cm (female); (2) fasting serum glucose level ≥ 5.6 mmol/L (100 mg/dL), 2-hour postload glucose level ≥ 7.8 mmol/L (140 mg/dL), HbA1c level ≥ 5.7% (39 mmol/L), type 2 diabetes, or ongoing treatment for type 2 diabetes; (3) blood pressure ≥ 130/85 mmHg or ongoing specific antihypertensive drug treatment; (4) plasma triglyceride level ≥ 1.7 mmol/L (150 mg/dL) or ongoing lipid-lowering treatment; and (5) plasma HDL-cholesterol level ≤ 1.0 mmol/L (40 mg/dL) (male) or ≤ 1.3 mmol/L (female), or ongoing lipid-lowering treatment.
Statistical analysis
Continuous variables are described as mean ± standard deviation (SD) or median with interquartile ranges according to the Shapiro-Wilk test for normally distributed variables. Categorical variables were presented as frequencies (percentages). Student’s t test or the Mann-Whitney U test was used for comparisons of continuous variables with or without a normal distribution, while the χ2 test was used for comparisons of categorical variables. Least absolute shrinkage and selection operator (LASSO) and multivariable logistic regression analyses were performed to identify independent variables associated with significant fibrosis. Variance inflation factor analysis (VIF) was utilized to eliminate multicollinearity. A nomogram was constructed based on the results of multivariate logistic regression analysis. A calibration curve with bootstrap resampling (1000 repetitions) was used to evaluate the goodness-of-fit of the model. Receiver operating characteristic (ROC) curves and corresponding areas under the curve (AUCs) with 95% confidence intervals (CIs) were generated to evaluate the clinical utility of the predictive model. Sensitivity, specificity, positive predicted value (PPV), negative predicted accuracy (NPV) and Youden index were also use to assess diagnostic accuracy. Decision curve analysis (DCA) quantified the maximum net benefit of the model, while the clinical impact curve (CIC) illustrated the nomogram’s accuracy in high-risk identification. Subpopulation AUROC analyses were conducted based on relevant clinical characteristics. The paired DeLong’s test was employed to compare AUROC values between the nomogram and other serologic tests. A two-tailed p value lower than 0.05 was considered to indicate statistical significance. All statistical analyses were performed using R software (version 4.3.1).
Results
Baseline characteristics of the study participants
A total of 6361 participants were included in the study, with 4452 participants assigned to the training cohort and 1909 to the validation cohort. Among them, 4119 (63.75%) were male and 2324 (36.25%) were female. The characteristics of the study participants in the training and validation cohorts are shown in Table 1. There were no significant differences in demographic information, anthropometric data, or laboratory results between the two cohorts (p > 0.05).
Table 1 The characteristics of the study participants in the training cohort and validation cohort
The MASLD group comprised 2896 participants, accounting for 45.53% of the total population. Significant differences were observed between MASLD and non-MASLD participants (Supplementary Table 2). Compared with the non-MASLD group, the MASLD population was significantly older with more male predominance, and had higher prevalence of lifestyle risk factors, including current smoking, alcohol consumption, and physical inactivity. Metabolic parameters were markedly worse in MASLD participants, evidenced by higher rates of diabetes/prediabetes, hypertension, increased adiposity, elevated liver enzymes, worse lipid profile and higher insulin resistance. Regarding fibrosis assessment, MASLD participants showed significantly higher CHI3L1 levels and NFS scores, but unexpectedly lower FIB-4 values.
Screening of the independent variables related to the significant liver fibrosis
LASSO regression was performed for all clinical demographics and routine laboratory analysis parameters to screen for potential liver fibrosis-related variables (Fig. 2A). Among the 32 variables, six predictive variables were selected by means of tenfold cross-validation and the optimal lambda (λ), including WC, BMI, ALT, AST, HOMA-IR, and CHI3L1. These variables were then incorporated into the multivariate logistic regression analysis (Table 2). WC (odds ratio [OR] = 1.047, p < 0.001), BMI (OR = 1.147, p < 0.001), AST (OR = 1.033, p < 0.001), HOMA-IR (OR = 1.089, p < 0.001), and CHI3L1 (OR = 1.008, p < 0.001) were identified as independent predictive variables for significant liver fibrosis. VIF analysis was conducted on these variables. All VIF values were less than 5(WC:3.863, BMI:3.833, AST:1.068, HOMA-IR:1.172, CHI3L1:1.016), indicating that multicollinearity could be excluded.
Fig. 2
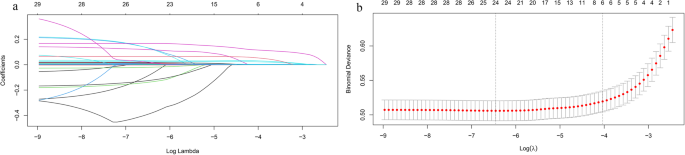
Variable selection by least absolute shrinkage and selection operator (LASSO) regression. A LASSO regression for variable selection and coefficient adjustment. Colored lines represent the trajectory of variables’ coefficient (vertical axis) against increasing penalty term log(λ) (bottom horizontal axis). Coefficients of less important variables quickly shrink to 0(excluded), while key variables are retained (top horizontal axis: count of retained variables). B Variables selection via tenfold cross-validation in the LASSO model. The relationship curve between the binomial deviation (vertical axis) and log(λ) (bottom horizontal axis) was plotted. Dotted vertical lines indicated the optimal λ values: lambda.min(left, minimizing mean squared error and lambda.1se(right, simplest model within one squared error of the lambda.min). The top axis shows the number of retained variables, with 6 variables selected in final model
Table 2 Multivariate logistic regression analyses for the prediction of significant liver fibrosis in the training cohort
Development and validation of the nomogram
Based on the results of the multivariate logistic regression analyses, a nomogram for fibrosis prediction was developed (Fig. 3) according to the following protocol: Briefly, a line was drawn straight upward to the point scale to determine the score for each variable at each level. The total score of the five variables was then calculated, and the final sum was placed on the total point scale to estimate the risk of significant liver fibrosis.
Fig. 3
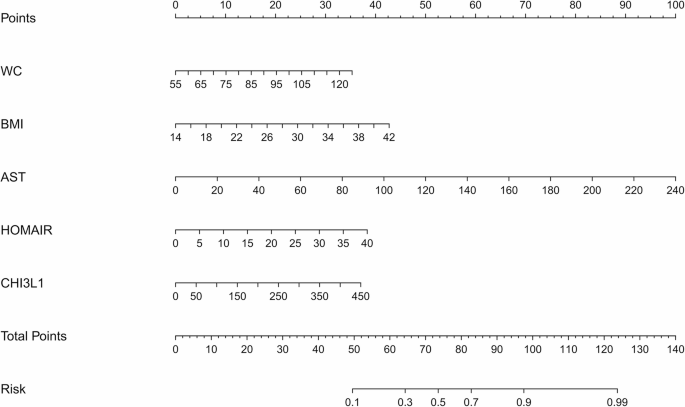
The nomogram model for the prediction of significant liver fibrosis Individual variable is scores (top axis) are summed to obtain total points, which correspond to predicted fibrosis risk (bottom axis)
Calibration curves were used to evaluate the goodness of fit of the prediction model (Fig. 4a and b). The fitted curves of the model did not completely coincide with the ideal curves in either the training or validation cohorts but were mainly located near the ideal curves. Furthermore, the Hosmer-Lemeshow test suggested that no significant difference was observed between the predicted value and the actual observation value, either in the training cohort (χ2 = 5.9008, p = 0.6583) or in the validation cohort (χ2 = 8.9385, p = 0.3475). Therefore, the current nomogram model demonstrated a satisfactory predictive performance for significant liver fibrosis in the general cohort.
Fig. 4
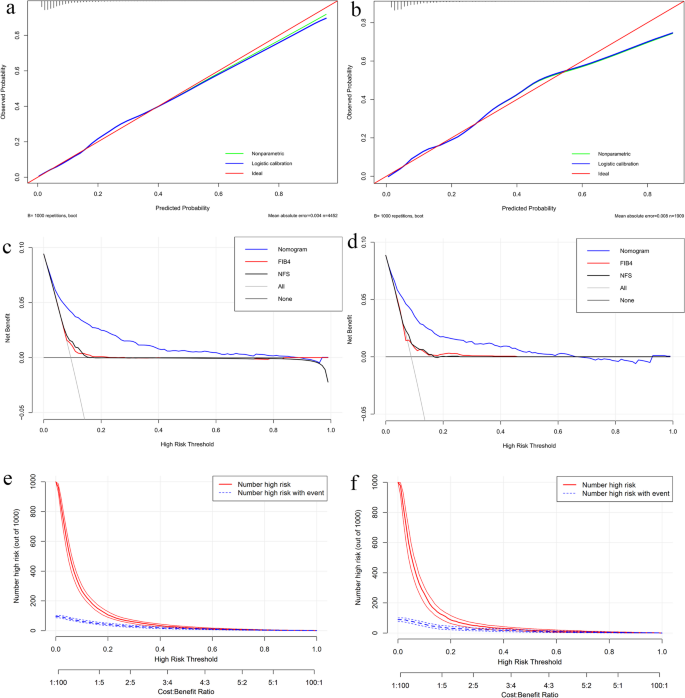
Performance assessment of the nomogram model. A, B Calibration plots in the training (A) and validation (B) cohorts. The x-axis denotes the nomogram-predicted probability of significant fibrosis, while the y-axis denotes the observed probability. The nomogram’s logistic (blue) and nonparametric (green) calibration lines closely track the ideal reference line(red), with mean absolute errors (MAE) of 0.004 (training) and 0.008 (validation). This confirms robust agreement between predicted and observed risks (validated by repeated 1000 bootstrap sampling validation). C, D Decision curve analyses (DCA) in the training (C) and validation (D) cohorts. The x-axis represents high-risk thresholds (probability prompting intervention), and the y-axis represents net benefit (true positives minus false positives). The nomogram (blue) outperformed FIB-4 (red) and NFS (black) across thresholds, indicating superior capability of true-positive identification. “All” (gray) and “None” (dark gray) represent extreme reference strategies: intervening for all or no patients. E, F Clinical impact curves in the training (E) and validation (F) cohorts. The x-axis integrates high-risk thresholds (probability cutoffs for intervention) and cost: benefit ratios (trade-off between intervention costs and gains). The y-axis shows counts per 1,000 individuals. The solid red line denotes model-predicted high-risk individuals; the dashed blue line denotes actual high-risk cases. Narrower gaps between lines (especially at 0.2–0.4 thresholds) indicate fewer false positives, supporting cost-effective screening
Clinical utility of the nomogram model in the general population
The predictive efficacy of the nomogram for liver fibrosis was compared with that of CHI3L1 alone and the other two conventional serological models, FIB-4 and NFS. In the training cohort, the nomogram demonstrated superior discriminative ability, with an AUC of 0.795 (95% CI: 0.771–0.818), significantly higher than FIB-4 (0.579, 95% CI: 0.549–0.609), NFS (0.612, 95% CI: 0.0583–0.642), and CHI3L1 (0.585, 95% CI: 0.554–0.615) (Fig. 5a). The nomogram model had a sensitivity of 75.4% and a specificity of 69.7%, with the best cutoff value of −2.262, which correctly classifying 74.8% of cases(accuracy) with a Youden index of 0.451 (Supplementary Table 1).
Fig. 5
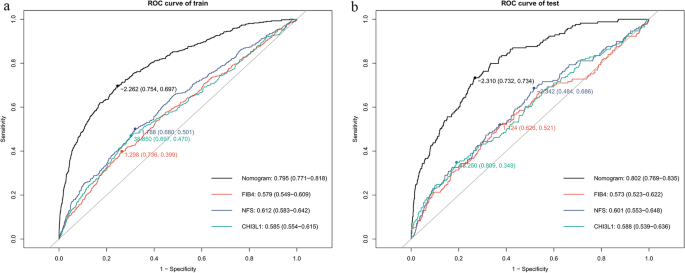
ROC analysis of significant liver fibrosis prediction models in training (A) and validation cohort (B). Optimal cut-off values with corresponding sensitivity/specificity are marked on each curve. Area under the ROC curve (AUROC) values with 95% confidence intervals are displayed (bottom right)
Consistent performance was observed in the validation cohort (AUC: 0.802, 95% CI: 0.769–0.835) and MASLD subgroup (AUC: 0.753, 95% CI: 0.728–0.780) (Figs. 5b and 6). The nomogram maintained higher sensitivity than FIB-4 and NFS in both populations (validation cohort: 73.4% vs. 36.7% vs. 34.3%; MASLD subgroup: 66.1% vs. 34.6% vs.36.4%), while retaining clinically acceptable specificity (validation cohort:73.2% vs. 73.8% vs.77.9%; MASLD subgroup:73.2% vs.77.6% vs. 76.2%) (Supplementary Table 1). Notably, in non-MASLD individuals (e.g., viral or lean NASH), the sensitivity of the nomogram was only 18.9%, whereas its specificity improved to 79.1% with a negative predictive value of 97.8%, suggesting its utility for ruling out fibrosis in these populations.
Fig. 6
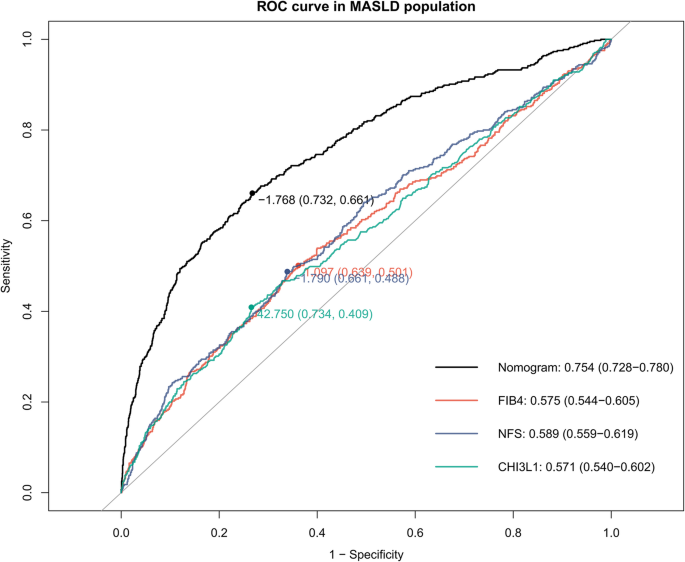
ROC analyses of significant liver fibrosis prediction models in the MASLD population. Optimal cut-off values with corresponding sensitivity/specificity are marked on each curve. AUROC values with 95% confidence intervals are displayed (bottom right)
Inspired by the satisfactory predictive efficacy, DCA and CIC were performed to evaluate the clinical utility of the nomogram. As shown in the DCA curves (Fig. 4b and c), the nomogram demonstrates a significantly higher net benefit compared to the “treat-all,” “treat-none” strategies, as well as FIB-4 and NFS within the clinically relevant threshold ranges (0.04–0.8 for the training cohort and 0.04–0.64 for the validation cohort). The CIC (Fig. 4e and f) further reinforced the practical utility of nomogram. The close alignment between nomogram-predicted and actual high-risk cases (especially at 20–40% thresholds) indicates high predictive accuracy with low false positives, supporting the cost-effective screening and efficient decision-making capability of nomogram in large-scale population screening.
Subgroup analysis of the predicting efficacy of nomogram versus FIB-4, NFS and CHI3L1
The subgroup analysis revealed that nomogram significantly outperformed FIB-4, NFS and CHI3L1 in predicting early-stage liver fibrosis across almost all subgroups, regardless of age, gender, alcohol consumption, smoking, diabetes/prediabetes, hypertension, or abdominal obesity (Fig. 7 and Supplementary Table 3). This finding suggests that the nomogram remained superior with high predictive efficacy for most subpopulations.
Fig. 7
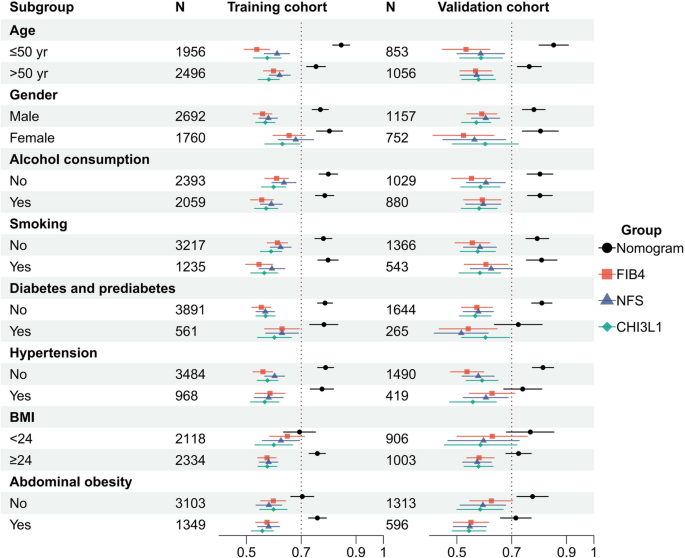
Subgroup AUROC analyses of the diagnostic performance in the training (left) and validation (right) cohorts. Sample sizes (N) are indicated for each subgroup. Error bars represent 95% confidence intervals
Discussion
We developed a nomogram model that predicts significant liver fibrosis (grade ≥ F2) in the general population, without a known history of liver disease. The nomogram was composed of five independent variables (WC, BMI, AST, HOMA-IR, and CHI3L1), all of which can be easily and precisely obtained from laboratory tests or clinical measurements. In addition, the proposed model achieved a greater AUC than other conventional models, such as non-invasive fibrosis score (FIB-4 and NFS) or CHI3L1 alone, not only in the training and validation cohorts from the general population, but also in populations with known fatty liver diseases, indicating its promising potential for the early identification of significant liver fibrosis.
Our study showed that the nomogram was superior to FIB-4 or NFS for the accurate prediction of significant liver fibrosis, especially in the general population. Previous studies have revealed the unsatisfactory performance of FIB-4 and NFS in the detection of significant fibrosis (grade ≥ F2) in the general population [13], with reported AUCs for predicting the development of cirrhosis and severe liver disease ranging from 0.54 to 0.71 [28]. The FIB-4 score and NFS showed poor correlation with LSM, a high rate of missing diagnoses, and low diagnostic efficacy, indicating their incapability as ideal alternatives to FibroTouch at the time of or prior to the clinical diagnosis of liver fibrosis [14]. The reason may be that FIB-4 and NFS were established and subsequently validated from hepatitis C and NAFLD populations, respectively, with a high prevalence of liver fibrosis [26, 29]. In contrast, the current study cohort consisted of a non-selected general population with an unknown history of liver disease and low prevalence of liver fibrosis. In addition, NFS and FIB-4 were originally recommended as part of the diagnostic regimen for ruling out advanced fibrosis (grade ≥ F3), but their accuracy in distinguishing F0-F1 fibrosis from ≥ F2 fibrosis remains controversial [30]. Therefore, for the general population, the current nomogram is more applicable for identifying significant liver fibrosis than FIB-4 or NFS.
Our study also verified the ability of the nomogram to predict significant liver fibrosis in both MASLD and non-MASLD populations. Consistent with findings from the total cohort, the nomogram outperformed two other serum-based scoring systems, FIB-4 and NFS, and CHI3L1 alone in MALSD, the most common type of CLD found in routine clinical examinations [31]. This advantage likely stems from the better alignment between the variables incorporated in the nomogram and the characteristic metabolic dysfunction of MASLD. Although prediction sensitivity of the nomogram in the non-MASLD populations was relatively lower than that in the MASLD population, both populations shared high specificity for nomogram-based fibrosis prediction, which suggests that the nomogram could serve as a first-line screening tool for MASLD patients while being more suitable as a supplementary confirmatory test for non-MASLD cases. However, hepatitis B and C, viral status, and records of alcohol consumption were not available in this analysis; therefore, whether this model is equally valid for hepatitis and alcoholic liver disease requires further investigation.
This study is the first to determine the role of CHI3L1 in the general population. Although CHI3L1, in combination with other independent variables, exhibited improved diagnostic efficacy for significant fibrosis, CHI3L1 alone exhibited relatively low efficacy in identifying significant fibrosis, with an AUC value of less than 0.59 according to ROC curve analysis. This distinguishes from previous studies, mostly conducted in chronic liver disease populations, which featured higher fibrosis-predicting efficacy of CHI3L1 with AUCs ranging from 0.76 0.99 [20, 32,33,34,35,36]. A possible reason for this is that different levels of CHI3L1 elevation are associated with the severity of fibrosis. Specifically, the increase in CHI3L1 expression is more significant in advanced-grade liver fibrosis than in low-grade fibrosis [34]. For instance, serum CHI3L1 showed greater diagnostic accuracy for Grade F3 fibrosis than for Grade F2 fibrosis [37]. Since the participants in the current study were recruited from routine checkup individuals who had a relatively low prevalence of severe fibrosis (2.85%) and cirrhosis (0.87%) [38], the probability of significant CHI3L1 elevation was correspondingly lower than that in populations with chronic liver diseases, which might attenuate the predictive ability of CHI3L1 alone. Accordingly, serum CHI3L1 has significant potential for diagnosing liver fibrosis in patients with chronic liver disease, but should be better used in combination with other auxiliary measures to improve its diagnostic efficacy in the general population.
As mentioned above, four additional variables with strong biological plausibility and independent associations with liver fibrosis [39,40,41] were included in the nomogram along with CHI3L1 to improve its efficacy in predicting liver fibrosis. ALT and AST are well-known indicators of liver function and have been incorporated into various prediction models [25, 26]. Elevated transaminase levels were found to be an independent predictor for all grades of liver fibrosis, which has been validated in a population-based nationwide studies [38]. In particular, it was associated with a two-fold increased risk of significant liver fibrosis independent of type 2 diabetes, obesity, and dyslipidemia [42]. The other three variables (WC, BMI, and HOMA-IR) in the nomogram model were strongly correlated with metabolic dysregulation. BMI and WC reflect overall obesity and abdominal obesity, respectively [43]. Evidences has shown that BMI has a J-shaped relationship with elevated liver stiffness [38], which explains why a high BMI results in LSM elevation and exacerbates liver fibrosis progression [44, 45]. While WC alone was found to be strongly associated with elevated LSM and significantly outperformed FIB-4 and NFS in the detection of liver fibrosis in a population-based cross-sectional study [13]. Insulin resistance, regarded as a major risk factor for diabetes, hypertension, and other metabolic diseases [46], was quantified using the HOMA-IR in our study. Obesity and insulin resistance affect liver fibrosis progression by creating a profibrotic microenvironment, including promoting hepatocellular death, inducing reactive oxygen species generation, and altering the balance between adipokines and cytokines [47]. The inclusion of these variables reflects a change in fibrosis etiology, with a major contribution from alcohol or metabolism-associated mechanisms instead of viral hepatitis, because the prevalence of hepatitis has greatly decreased owing to the wide coverage of vaccines and antiviral agents [48]. Our findings highlight that controlling weight, WC, and metabolic status through a healthy lifestyle would help prevent and delay liver fibrosis progression.
This study had several limitations. First, while FibroTouch represents the most practical and guideline-recommended [30, 49] noninvasive alternative to liver biopsy for population screening, its inherent limitations including potential false-negative results and variable cutoff values may introduce measurement variability. Second, the absence of detailed virological data, antiviral treatment history, and precise alcohol consumption records in our cohort database, as well as the cross-sectional study design in a common population featuring relatively low prevalence of advanced fibrosis stages, may constrain the comprehensive evaluation of the model’s predictive performance. Third, for a retrospective analysis conducted exclusively in a Chinese population, the generalizability of our findings to other ethnic groups requires further validation. Thus, future prospective multicenter studies with longitudinal follow-up across diverse populations are warranted to validate and refine the model’s predictive capability for fibrosis risk stratification.
In conclusion, the proposed novel nomogram, formulated from CHI3L1 and four other routine measures, showed superior prediction accuracy for significant liver fibrosis compared with CHI3L1 alone and conventional fibrosis scores, not only in the general population but also in patients with MASLD. As a feasible and promising noninvasive diagnostic tool, this nomogram enables the early identification of high-risk patients who need secondary care referrals and specialized interventions.
Data availability
No datasets were generated or analysed during the current study.
Abbreviations
NAFLD:
Non-alcoholic fatty liver diseases
ALD:
Alcoholic liver diseases
MASLD:
Metabolic dysfunction-associated steatotic liver disease
DALYs:
Disability-adjusted life-years
TE:
Transient elastography
FIB-4:
Fibrosis-4 index
NFS:
Non-alcoholic fatty liver disease fibrosis score
CHI3L1:
Chitinase-3-like protein-1
FT:
FibroTouch
WC:
Waist circumference
BMI:
Body mass index
FPG:
Fasting plasma glucose
HbA1c:
Hemoglobin
WBC:
White blood cells
NLR:
Neutrophil–lymphocyte ratio
PLT:
Platelet count
ALT:
Alanine transaminase
AST:
Aspartate aminotransferase
GGT:
Gamma-glutamyl transferase
TBA:
Total bile acid
TBiL:
Total bilirubin
ALB:
Albumin
UA:
Uric acid
TC:
Total cholesterol
TG:
Triglyceride
LDL:
Low-density lipoprotein
HDL:
High-density lipoprotein
FINS:
Fasting insulin
Hcy:
Homocystein
1,25(OH)2D3 :
1,25-hydroxyvitamin D3
HOMA-IR:
Homeostatic model assessment of insulin resistance
SD:
Standard deviation
LASSO:
Least absolute shrinkage and selection operator
ROC:
Receiver operating characteristic
AUC:
Areas under the curve
CI:
Confidence intervals
DCA:
Decision curve analysis
λ:
Lambda
CIC:
Clinical impact curve
References
- Asrani SK, Devarbhavi H, Eaton J, Kamath PS. Burden of liver diseases in the world. J Hepatol. 2019;70(1):151–71.
Article PubMed Google Scholar - Ray K. NAFLD-the next global epidemic. Nat Rev Gastroenterol Hepatol. 2013;10(11):621.
Article PubMed Google Scholar - Lee YA, Wallace MC, Friedman SL. Pathobiology of liver fibrosis: a translational success story. Gut. 2015;64(5):830–41.
Article CAS PubMed Google Scholar - Dam Fialla A, Schaffalitzky de Muckadell OB, Touborg Lassen A. Incidence, etiology and mortality of cirrhosis: a population-based cohort study. Scand J Gastroenterol. 2012;47(6):702–9.
Article PubMed Google Scholar - Serra-Burriel M, Juanola A, Serra-Burriel F, Thiele M, Graupera I, Pose E, et al. Development, validation, and prognostic evaluation of a risk score for long-term liver-related outcomes in the general population: a multicohort study. Lancet. 2023;402(10406):988–96.
Article PubMed Google Scholar - Jepsen P, Younossi ZM. The global burden of cirrhosis: a review of disability-adjusted life-years lost and unmet needs. J Hepatol. 2021;75(Suppl 1):S3-13.
Article PubMed Google Scholar - Chalasani N, Younossi Z, Lavine JE, Charlton M, Cusi K, Rinella M, Harrison SA, Brunt EM, Sanyal AJ. The diagnosis and management of nonalcoholic fatty liver disease: practice guidance from the American association for the study of liver diseases. Hepatology. 2018;67(1):328–57.
Article PubMed Google Scholar - Chalasani N, Younossi Z, Lavine JE, Diehl AM, Brunt EM, Cusi K, et al. D: The diagnosis and management of non-alcoholic fatty liver disease: practice guideline by the American Gastroenterological Association, American Association for the Study of Liver Diseases, and American College of Gastroenterology. Gastroenterology. 2012;142(7):1592–609.
Article PubMed Google Scholar - Kleiner DE, Brunt EM, Van Natta M, Behling C, Contos MJ, Cummings OW, Ferrell LD, Liu YC, Torbenson MS, Unalp-Arida A, et al. Design and validation of a histological scoring system for nonalcoholic fatty liver disease. Hepatology. 2005;41(6):1313–21.
Article PubMed Google Scholar - Karlsen TH, Sheron N, Zelber-Sagi S, Carrieri P, Dusheiko G, Bugianesi E, et al. The EASL-Lancet liver commission: protecting the next generation of Europeans against liver disease complications and premature mortality. Lancet. 2022;399(10319):61–116.
Article PubMed Google Scholar - Gines P, Krag A, Abraldes JG, Sola E, Fabrellas N, Kamath PS. Liver cirrhosis. Lancet. 2021;398(10308):1359–76.
Article PubMed Google Scholar - Gines P, Graupera I, Lammert F, Angeli P, Caballeria L, Krag A, et al. Screening for liver fibrosis in the general population: a call for action. The Lancet Gastroenterology & Hepatology. 2016;1(3):256–60.
Article Google Scholar - Graupera I, Thiele M, Serra-Burriel M, Caballeria L, Roulot D, Wong GL, Fabrellas N, Guha IN, Arslanow A, Exposito C, et al. Low accuracy of FIB-4 and NAFLD fibrosis scores for screening for liver fibrosis in the population. Clin Gastroenterol Hepatol. 2022;20(11):2567–76. e2566.
Article CAS PubMed Google Scholar - Parikh ND, Mehta M, Tapper EB. FIB-4 and APRI for cirrhosis detection in a privately insured National cohort. JHEP Rep. 2024;6(1):100925.
Article PubMed Google Scholar - Zhang F, Han Y, Zheng L, Liu J, Wu Y, Bao Z, et al. Association of non-invasive markers with significant fibrosis in patients with nonalcoholic fatty liver disease: a cross-sectional study. Diabetes Metab Syndr Obes. 2023;16:2255–68.
Article CAS PubMed PubMed Central Google Scholar - Zhao T, Su Z, Li Y, Zhang X, You Q. Chitinase-3 like-protein-1 function and its role in diseases. Signal Transduct Target Ther. 2020;5(1):201.
Article CAS PubMed PubMed Central Google Scholar - Wang L, Liu T, Zhou J, You H, Jia J. Changes in serum chitinase 3-like 1 levels correlate with changes in liver fibrosis measured by two established quantitative methods in chronic hepatitis B patients following antiviral therapy. Hepatol Res. 2018;48(3):E283-90.
Article CAS PubMed Google Scholar - Johansen JS, Christoffersen P, Moller S, Price PA, Henriksen JH, Garbarsch C, et al. Serum YKL-40 is increased in patients with hepatic fibrosis. J Hepatol. 2000;32(6):911–20.
Article CAS PubMed Google Scholar - Nojgaard C, Johansen JS, Christensen E, Skovgaard LT, Price PA, Becker U, Group E. Serum levels of YKL-40 and PIIINP as prognostic markers in patients with alcoholic liver disease. J Hepatol. 2003;39(2):179–86.
Article CAS PubMed Google Scholar - Kumagai E, Mano Y, Yoshio S, Shoji H, Sugiyama M, Korenaga M, Ishida T, Arai T, Itokawa N, Atsukawa M, et al. Serum YKL-40 as a marker of liver fibrosis in patients with non-alcoholic fatty liver disease. Sci Rep. 2016;6:35282.
Article CAS PubMed PubMed Central Google Scholar - Harrison SA, Ratziu V, Boursier J, Francque S, Bedossa P, Majd Z, et al. A blood-based biomarker panel (NIS4) for non-invasive diagnosis of non-alcoholic steatohepatitis and liver fibrosis: a prospective derivation and global validation study. The Lancet Gastroenterol Hepatol. 2020;5(11):970–85.
Article PubMed Google Scholar - Chinese Society of Endocrinology, Chinese Diabetes Society, Chinese Endocrinologist Association. Intervention for adults with pre-diabetes: a Chinese expert consensus (2023 edition). Chin J Diabetes. 2023;15(6):484–94.
Google Scholar - Matthews DR, Hosker JP, Rudenski AS, Naylor BA, Treacher DF, Turner RC. Homeostasis model assessment: insulin resistance and beta-cell function from fasting plasma glucose and insulin concentrations in man. Diabetologia. 1985;28(7):412–9.
Article CAS PubMed Google Scholar - Duan WJ, Wang XZ, Ma AL, Shang J, Nan YM, Gao ZL, et al. Multicenter prospective study to validate a new transient elastography device for staging liver fibrosis in patients with chronic hepatitis B. J Dig Dis. 2020;21(9):519–25.
Article CAS PubMed Google Scholar - Takahashi Y, Kurosaki M, Tamaki N, Yasui Y, Hosokawa T, Tsuchiya K, et al. Non-alcoholic fatty liver disease fibrosis score and FIB-4 scoring system could identify patients at risk of systemic complications. Hepatol Res. 2015;45(6):667–75.
Article CAS PubMed Google Scholar - Angulo P, Hui JM, Marchesini G, Bugianesi E, George J, Farrell GC, et al. The NAFLD fibrosis score: a noninvasive system that identifies liver fibrosis in patients with NAFLD. Hepatology. 2007;45(4):846–54.
Article CAS PubMed Google Scholar - Rinella ME, Lazarus JV, Ratziu V, Francque SM, Sanyal AJ, Kanwal F, et al. A multisociety Delphi consensus statement on new fatty liver disease nomenclature. J Hepatol. 2023;79(6):1542–56.
Article CAS PubMed Google Scholar - Hagstrom H, Talback M, Andreasson A, Walldius G, Hammar N. Ability of noninvasive scoring systems to identify individuals in the population at risk for severe liver disease. Gastroenterology. 2020;158(1):200–14.
Article PubMed Google Scholar - Sterling RK, Lissen E, Clumeck N, Sola R, Correa MC, Montaner J, et al. Development of a simple noninvasive index to predict significant fibrosis in patients with HIV/HCV coinfection. Hepatology. 2006;43(6):1317–25.
Article CAS PubMed Google Scholar - Coste P, Llop E, Perello C, Hernandez M, Lopez M, Abad J, et al. Comparison of non-invasive fibrosis scores to predict increased liver stiffness in the general population with unknown liver disease: searching for the primary physician’s best friend. Dig Liver Dis. 2022;54(9):1209–14.
Article CAS PubMed Google Scholar - Roulot D, Costes JL, Buyck JF, Warzocha U, Gambier N, Czernichow S, Le Clesiau H, Beaugrand M. Transient elastography as a screening tool for liver fibrosis and cirrhosis in a community-based population aged over 45 years. Gut. 2011;60(7):977–84.
Article CAS PubMed Google Scholar - Tran A, Benzaken S, Saint-Paul MC, Guzman-Granier E, Hastier P, Pradier C, et al. Chondrex (YKL-40), a potential new serum fibrosis marker in patients with alcoholic liver disease. Eur J Gastroenterol Hepatol. 2000;12(9):989–93.
Article CAS PubMed Google Scholar - Jiang Z, Wang S, Jin J, Ying S, Chen Z, Zhu D, et al. The clinical significance of serum chitinase 3-like 1 in hepatitis B-related chronic liver diseases. J Clin Lab Anal. 2020;34(5):e23200.
Article CAS PubMed PubMed Central Google Scholar - Huang H, Wu T, Mao J, Fang Y, Zhang J, Wu L, et al. CHI3L1 is a liver-enriched, noninvasive biomarker that can be used to stage and diagnose substantial hepatic fibrosis. OMICS. 2015;19(6):339–45.
Article CAS PubMed PubMed Central Google Scholar - Saitou Y, Shiraki K, Yamanaka Y, Yamaguchi Y, Kawakita T, Yamamoto N, et al. Noninvasive estimation of liver fibrosis and response to interferon therapy by a serum fibrogenesis marker, YKL-40, in patients with HCV-associated liver disease. World J Gastroenterol. 2005;11(4):476–81.
Article CAS PubMed PubMed Central Google Scholar - Mushtaq S, Ghani E, Azam K, Hussain T. Comparison of chitinase-3-like protein 1, aspartate aminotransferase-to-platelet ratio index, and fibrosis-4 index with shear-wave elastography. Eur J Gastroenterol Hepatol. 2019;31(3):357–62.
Article CAS PubMed Google Scholar - Huang X, Zhuang J, Yang Y, Jian J, Ai W, Liu C, et al. Diagnostic value of serum chitinase-3-like protein 1 for liver fibrosis: a meta-analysis. Biomed Res Int. 2022;2022:3227957.
Article PubMed PubMed Central Google Scholar - Man S, Deng Y, Ma Y, Fu J, Bao H, Yu C, et al. Prevalence of liver steatosis and fibrosis in the general population and various high-risk populations: a nationwide study with 5.7 million adults in China. Gastroenterology. 2023;165(4):1025–40.
Article PubMed Google Scholar - Poynard T, Lebray P, Ingiliz P, Varaut A, Varsat B, Ngo Y, Norha P, Munteanu M, Drane F, Messous D, et al. Prevalence of liver fibrosis and risk factors in a general population using non-invasive biomarkers (FibroTest). BMC Gastroenterol. 2010;10:40.
Article PubMed PubMed Central Google Scholar - Kim Y, Chang Y, Cho YK, Ahn J, Shin H, Ryu S. Obesity and weight gain are associated with progression of fibrosis in patients with nonalcoholic fatty liver disease. Clin Gastroenterol Hepatol. 2019;17(3):543-e550542.
Article PubMed Google Scholar - Fujii H, Imajo K, Yoneda M, Nakahara T, Hyogo H, Takahashi H, et al. HOMA-IR: an independent predictor of advanced liver fibrosis in nondiabetic non-alcoholic fatty liver disease. J Gastroenterol Hepatol. 2019;34(8):1390–5.
Article CAS PubMed Google Scholar - Caballeria L, Pera G, Arteaga I, Rodriguez L, Aluma A, Morillas RM, de la Ossa N, Diaz A, Exposito C, Miranda D, et al. High prevalence of liver fibrosis among European adults with unknown liver disease: A Population-Based study. Clin Gastroenterol Hepatol. 2018;16(7):1138–45. e1135.
Article PubMed Google Scholar - Rankinen T, Kim SY, Perusse L, Despres JP, Bouchard C. The prediction of abdominal visceral fat level from body composition and anthropometry: ROC analysis. Int J Obes Relat Metab Disord. 1999;23(8):801–9.
Article CAS PubMed Google Scholar - Das K, Sarkar R, Ahmed SM, Mridha AR, Mukherjee PS, Das K, et al. Normal liver stiffness measure (LSM) values are higher in both lean and obese individuals: a population-based study from a developing country. Hepatology. 2012;55(2):584–93.
Article PubMed Google Scholar - Hedenstierna M, Nangarhari A, El-Sabini A, Weiland O, Aleman S. Cirrhosis, high age and high body mass index are risk factors for persisting advanced fibrosis after sustained virological response in chronic hepatitis C. J Viral Hepat. 2018;25(7):802–10.
Article CAS PubMed Google Scholar - Gonzalez-Gonzalez JG, Violante-Cumpa JR, Zambrano-Lucio M, Burciaga-Jimenez E, Castillo-Morales PL, Garcia-Campa M, et al. HOMA-IR as a predictor of health outcomes in patients with metabolic risk factors: a systematic review and meta-analysis. High Blood Press Cardiovasc Prev. 2022;29(6):547–64.
Article PubMed Google Scholar - Chiang DJ, Pritchard MT, Nagy LE. Obesity, diabetes mellitus, and liver fibrosis. Am J Physiol Gastrointest Liver Physiol. 2011;300(5):G697–702.
Article CAS PubMed PubMed Central Google Scholar - Huang DQ, Terrault NA, Tacke F, Gluud LL, Arrese M, Bugianesi E, Loomba R. Global epidemiology of cirrhosis - aetiology, trends and predictions. Nat Rev Gastroenterol Hepatol. 2023;20(6):388–98.
Article PubMed PubMed Central Google Scholar - Jung KS, Kim SU. Clinical applications of transient elastography. Clin Mol Hepatol. 2012;18(2):163–73.
Article PubMed PubMed Central Google Scholar
Acknowledgements
The authors are grateful to Dr. Qida Hu of the Department of Hepatobiliary and Pancreatic Surgery, First Affiliated Hospital, Zhejiang University School of Medicine, for his help with revising the manuscript.
Author information
Authors and Affiliations
- Health Management Center, The First Affiliated Hospital, Zhejiang University School of Medicine, No. 79 Qingchun Road, Shangcheng District, Hangzhou, China
Piaopiao Jin, Nan Li, Chenbing Liu, Di Sheng, Lihong Qiu, Chenzhao Zhao & Zhong Liu
Authors
- Piaopiao Jin
- Nan Li
- Chenbing Liu
- Di Sheng
- Lihong Qiu
- Chenzhao Zhao
- Zhong Liu
Contributions
Zhong Liu and Piaopiao Jin designed the research and wrote the manuscript; Nan Li performed the statistical analysis; Chenbing Liu contributed to the revision of the manuscript; Di Sheng, Lihong Qiu and Chenzhao Zhao conducted the research and performed data collection; All the authors had read and approved the final manuscript to be published.
Corresponding author
Correspondence toZhong Liu.
Ethics declarations
Ethics approval and consent to participate
The study was approved by the Ethics Committee of the First Affiliated Hospital of Zhejiang University School of Medicine. All the participants had read and signed informed consent prior to the physical examination. Procedures related to the study were performed in accordance with the ethical standards of the Declaration of Helsinki.
Consent for publication
Not applicable.
Competing interests
The authors declare no competing interests.
Additional information
Publisher’s Note
Springer Nature remains neutral with regard to jurisdictional claims in published maps and institutional affiliations.
Supplementary Information
Rights and permissions
Open Access This article is licensed under a Creative Commons Attribution-NonCommercial-NoDerivatives 4.0 International License, which permits any non-commercial use, sharing, distribution and reproduction in any medium or format, as long as you give appropriate credit to the original author(s) and the source, provide a link to the Creative Commons licence, and indicate if you modified the licensed material. You do not have permission under this licence to share adapted material derived from this article or parts of it. The images or other third party material in this article are included in the article’s Creative Commons licence, unless indicated otherwise in a credit line to the material. If material is not included in the article’s Creative Commons licence and your intended use is not permitted by statutory regulation or exceeds the permitted use, you will need to obtain permission directly from the copyright holder. To view a copy of this licence, visit http://creativecommons.org/licenses/by-nc-nd/4.0/.
About this article
Cite this article
Jin, P., Li, N., Liu, C. et al. A chitinase-3-like protein-1-based nomogram for identification of significant liver fibrosis in the general population.BMC Gastroenterol 25, 688 (2025). https://doi.org/10.1186/s12876-025-04277-0
- Received: 13 September 2024
- Accepted: 26 August 2025
- Published: 29 September 2025
- Version of record: 29 September 2025
- DOI: https://doi.org/10.1186/s12876-025-04277-0