The relationship between serum uric acid level and non-alcoholic fatty liver disease in northern China: a retrospective cohort study (original) (raw)
Abstract
Background
Non-alcoholic fatty liver disease (NAFLD) has become the most prevalent chronic liver disease among adults. High uric acid (UA) increases the incidence of NAFLD in the general population. However, further exploration is warranted to determine the relationship between UA levels and NAFLD in various populations. We conducted a historical cohort study to investigate the causality between UA and NAFLD across different weight categories.
Methods
A historical cohort was established from the Jidong community cohort. All participants were enrolled and followed up from July 1st, 2013 to August 1st, 2018. The study participants were retrospectively assigned to four groups according to their UA levels (Q1, 69–210 μmol/L; Q2, 211–255 μmol/L; Q3, 256–310 μmol/L; Q4, 311–593 μmol/L). The NAFLD incidence was investigated in each group. We used the UA level determined by an automatic analyzer. NAFLD was diagnosed with abdominal ultrasonography examination. Demographic information, lifestyle history, clinical anthropometric data, and blood samples of participants were collected. Univariate analysis and multivariable Cox regression were applied to analyze the relationship between UA and NAFLD by stratification of participants’ body mass index (BMI) categories (underweight, normal weight, overweight, and obese).
Results
Two thousand nine hundred eighty four participants were enrolled. 740 (24.8%) were assigned to UA Q1 group, 755 (25.3%) to UA Q2, 743 (24.9%) to UA Q3, and 746 (25.0%) to UA Q4. The global incidence of NAFLD was 26.0% (777/2984). The risk of NAFLD significantly increased with elevated UA levels in underweight and normal-weight participants (HR = 3.498, 95% CI: 2.413–5.072, P < 0.05). In multivariable analysis, UA showed a positive association with NAFLD, independent of other risk factors in underweight and normal-weight participants (UA Q2: 1.152 (0.761–1.743), UA Q3: 2.168 (1.489–3.157), UA Q4: 3.075 (2.103–4.196), P < 0.05). In the absence of other risk factors, high UA levels independently explained 17% of NAFLD risk in underweight and normal-weight participants.
Conclusions
High UA levels serve as an independent risk factor for NAFLD in underweight and normal-weight individuals, highlighting the necessity of early NAFLD screening through monitoring liver function and UA levels, and personalized treatment plans for NAFLD patients with higher UA levels, which may include uric acid-lowering therapy and lifestyle modifications. However, the relationship between UA levels and NAFLD in overweight and obese individuals remains inconclusive.
View this article's peer review reports
Introduction
Non-alcoholic fatty liver disease (NAFLD) has emerged as the most prevalent chronic liver disease worldwide, primarily attributed to changes in lifestyle [1]. NAFLD refers to the excessive accumulation of fat in liver cells caused by factors other than alcohol and liver injury, which can further progress to liver fibrosis, cirrhosis, and even liver cancer [2]. The global prevalence of NAFLD is estimated to be 25%, and the prevalence of NAFLD in China has increased from 23 to 29% in the last decades [3, 4]. This alarming rise in prevalence highlights the urgent need to explore the risk factors associated with NAFLD to develop effective preventive and therapeutic strategies. Complications from NAFLD include obesity, dyslipidemia, type 2 diabetes, etc. Moreover, the incidence and mortality rates of cardiovascular diseases were increased in patients with NAFLD [5, 6], further underscoring the importance of identifying the risk factors of NAFLD.
Moreover, NAFLD is characterized by increased burden of inflammation [[7](/article/10.1186/s12889-025-21943-w#ref-CR7 "Kosekli MA, Kurtkulagii O, Kahveci G, Duman TT, Tel BMA, Bilgin S, Demirkol ME, Aktas G. The association between serum uric acid to high density lipoprotein-cholesterol ratio and non-alcoholic fatty liver disease: the abund study. Rev Assoc Med Bras (1992). 2021;67(4):549–554. https://doi.org/10.1590/1806-9282.20201005
.")\]. Notably, serum uric acid and uric acid derived markers are also associated with inflammatory conditions such as hypertension \[[8](/article/10.1186/s12889-025-21943-w#ref-CR8 "Aktas G, Khalid A, Kurtkulagi O, Duman TT, Bilgin S, Kahveci G, Tel BMA, Sincer I, Gunes Y. Poorly controlled hypertension is associated with elevated serum uric acid to HDL-cholesterol ratio: a cross-sectional cohort study. Postgrad Med. 2022;134(3):297–302.")\], T2DM \[[9](/article/10.1186/s12889-025-21943-w#ref-CR9 "Aktas G, Kocak MZ, Bilgin S, Atak BM, Duman TT, Kurtkulagi O. Uric acid to HDL cholesterol ratio is a strong predictor of diabetic control in men with type 2 diabetes mellitus. Aging Male. 2020;23(5):1098–1102.")\], thyroiditis \[[10](/article/10.1186/s12889-025-21943-w#ref-CR10 "Kurtkulagi O, Tel BMA, Kahveci G, Bilgin S, Duman TT, Ertürk A, Balci B, Aktas G. Hashimoto's thyroiditis is associated with elevated serum uric acid to high density lipoprotein-cholesterol ratio. Rom J Intern Med. 2021;59(4):403–408.")\], metabolic syndrome \[[11](/article/10.1186/s12889-025-21943-w#ref-CR11 "Kocak MZ, Aktas G, Erkus E, Sincer I, Atak B, Duman T. Serum uric acid to HDL-cholesterol ratio is a strong predictor of metabolic syndrome in type 2 diabetes mellitus. Rev Assoc Med Bras (1992). 2019;65(1):9–15.")\], prediabetes, diabetic kidney disease \[[12](/article/10.1186/s12889-025-21943-w#ref-CR12 "Aktas G, Yilmaz S, Kantarci DB, Duman TT, Bilgin S, Balci SB, Tel BMA. Is serum uric acid-to-HDL cholesterol ratio elevation associated with diabetic kidney injury? Postgrad Med. 2023;135(5):519–523.")\], and even new onset diabetes \[[13](/article/10.1186/s12889-025-21943-w#ref-CR13 "Kosekli MA, Aktas G. Serum uric acid HDL cholesterol ratio is associated with diabetic control in new onset type2 diabetic population. Acta Clin Croat. 2023;62(2):277–282.")\]. Thus, studying the relationship between uric acid and NAFLD makes sense.NAFLD is considered a manifestation of liver metabolic disorder within the context of metabolic syndrome (MS). MS is characterized by the pathological state of abnormal aggregation of multiple metabolic components, representing a complex set of metabolic disorder syndromes. Among the various components of MS, uric acid (UA) has gained attention for its potential link with metabolic disorders [14]. UA, the final product of purine metabolism, has been rising with improvements in living standards [15]. High UA levels are associated with hypertension, dyslipidemia, and type 2 diabetes [16, 17]. Some evidence suggests an association between UA and NAFLD, and high UA levels serve as independent predictors of NAFLD in the general population [18, 19]. Our previous study consistently demonstrated a positive correlation between high UA levels and NAFLD across various menstrual states [20]. However, whether the relationship between UA and NAFLD remains consistent across different populations is yet to be determined.
Moreover, it is important to explore the potential variations in the correlation between UA and NAFLD among individuals with different body weight groups. Compared to obese NAFLD patients, normal-weight NAFLD patients have a higher risk of all-cause mortality [21,22,23,24]. Therefore, we postulate that the risk factors for NAFLD vary among different body weight groups, and the correlation between UA and NAFLD might consequently vary. To investigate the causal relationship between UA and NAFLD in participants with different body mass index (BMI), we conducted a historical cohort study in northern China during 2013–2018.
Methods
Study setting and participants
We conducted a population-based historical cohort study with participants enrolled from the Kailuan and Jidong communities in Tangshan City (Hebei Province, northern China) from July 1st, 2013 to August 1st, 2018. Jidong Oilfield Hospital provided the same health examination to the employees (including retirees) of Jidong Oilfield Inc. (a large oilfield) and their families, and 8431 participants agreed to the study and completed the questionnaire. Each participant was required to have a medical examination, provide blood samples, and complete a standard questionnaire during a face-to-face interview.
The inclusion criteria were defined as follows: (1) aged ≥ 18 years; (2) normal mental state and intelligence; (3) completing the questionnaire and undergoing blood biochemical tests and abdominal ultrasonography. The process of excluding participants in our study is as follows: First, a preliminary screening is conducted on all potential participants to check their health records or self-reported health status to determine the presence of liver related diseases such as fatty liver, cirrhosis, viral hepatitis, and cancer. Willingness confirmation: Communicate with all participants who have passed the first two screening steps to confirm their willingness to participate in subsequent research actions, including regular follow-up, data collection, etc. Participants who refuse to participate in subsequent actions or express unclear intentions will be excluded. The specific exclusion criteria are as follows: (1) confirmed fatty liver, liver cirrhosis, viral hepatitis, liver cancer, and other liver-related diseases patients, or exposure to hepatotoxic drugs within one month; (2) lack of drinking information or alcohol consumption of more than 140 g/week for males and more than 70 g/week for females; (3) refusal to participate in follow-up. Ultimately, 2984 individuals were enrolled and signed the written informed consent form (Fig. 1).
Fig. 1
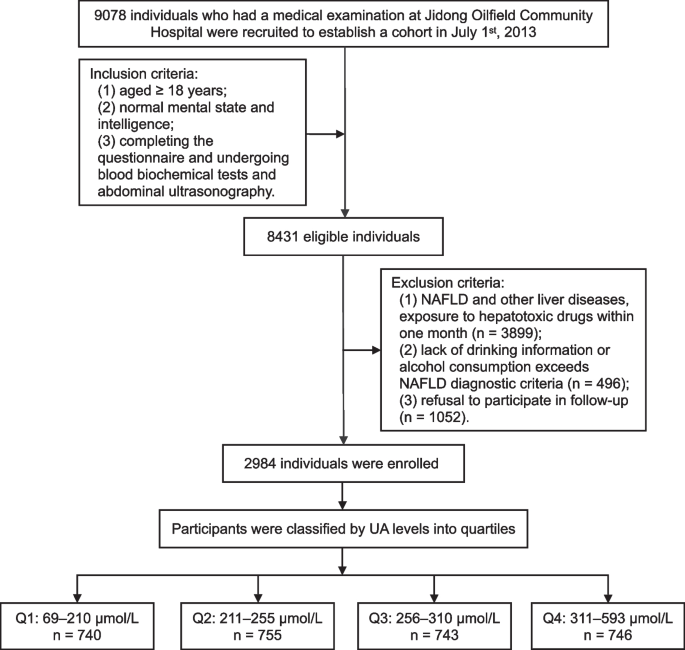
Flow chart of the study population enrollment. NAFLD, non-alcoholic fatty liver disease; Q, quartile; UA, uric acid
Exposure
The exposure factor was defined as the serum UA levels. Participants were assigned to four groups based on UA quartiles (Q) (i.e., Q1: 69–210 μmol/L; Q2: 211–255 μmol/L; Q3: 256–310 μmol/L; Q4: 311–593 μmol/L). Finally, 740 (24.8%), 755 (25.3%), 743 (24.9%), and 746 (25.0%) participants were classified in Q1, Q2, Q3, and Q4 groups, respectively.
Outcomes
The primary outcome of our study was NAFLD. According to the diagnostic and treatment guidelines for NAFLD [25], participants who corresponded at least two of the following conditions were diagnosed as NAFLD patients:
- (1)
enhanced anterior field echo of the liver; - (2)
attenuated far-field echo of the liver; - (3)
unclear intrahepatic duct structure.
Questionnaire investigation
A face-to-face interview was conducted with a designed questionnaire to collect demographic information, lifestyle information, medical history, and drug history of participants. The demographic information included age, sex, education level, marital status, and monthly income. Lifestyle information included physical activity frequency, salt intake level, daily sleep duration, smoking, and alcohol consumption. Disease history investigated the existence of hypertension, diabetes, MS, dyslipidemia, autoimmune disease, and liver-related diseases (i.e., fatty liver, liver cirrhosis, viral hepatitis, drug-induced liver disease, and hepatolenticular degeneration). Hypertension was diagnosed if blood pressure (BP) was measured more than three times (not on the same day) in a quiet state, systolic blood pressure (SBP) ≥ 140 mmHg, and/or diastolic blood pressure (DBP) ≥ 90 mmHg [26]. The diagnostic criteria for diabetes were fasting plasma glucose (FBG) ≥ 7.0 mmol/L, or postprandial blood glucose ≥ 11.1 mmol/L, along with corresponding symptoms of diabetes [27]. According to the International Diabetes Federation's diagnostic criteria for MS [28], MS was defined as an abnormal waist circumference (i.e., male waist circumference ≥ 90 cm, female waist circumference ≥ 80 cm) with two or more of the following conditions: (1) triglyceride (TG) > 150 mg/dL (1.7 mmol/L), high-density lipoprotein cholesterol (HDL-C) < 40 mg/dL (1.03 mmol/L) in men and < 50 mg/dL (1.29 mmol/L) in women, or history of dyslipidemia; (2) SBP ≥ 130 mmHg, DBP ≥ 85 mmHg, or previously diagnosed hypertension; (3) FBG ≥ 100 mg/dL (5.6 mmol/L) or previously diagnosed type 2 diabetes. Dyslipidemia was diagnosed if any of the following conditions were met: (1) TG ≥ 2.26 mmol/L; (2) total cholesterol (TC) ≥ 6.22 mmol/L; (3) HDL-C < 1.04 mmol/L; (4) low-density lipoprotein cholesterol (LDL-C) ≥ 4.14 mmol/L [29].
Physical examination
Physical examination included the measurements of height (cm), weight (kg), abdominal circumference (cm) and blood pressure (mmHg). All examinations are performed by trained clinicians. Participants were barefoot, wore light clothes, and emptied their pockets. Height was measured with a tape measure, and weight was measured with a calibrated weight gauge. Participants stood easily without their waist covered, and the tape measure was placed at the midpoint of the connecting line between the upper edge of the crotch and the lower edge of the rib. The circumference of the abdomen was measured parallel to the ground, with the tape measure clinging to the skin without squeezing, and measured at the end of normal exhalation. Participants rested for 10 min in a quiet environment and then took a sitting position to measure their BP. Using the mercury sphygmomanometer to measure SBP and DBP, and measure the BP three times to obtain the average value of BP.
Blood biochemical examination
Blood samples were collected and tested at Jidong Oilfield Community Hospital. After 12 h of fasting, well-trained medical staff collected 3 mL of blood from the participant's antecubital vein and stored it in a vacuum tube containing ethylenediaminetetraacetic acid (EDTA). Within 4 h after blood collection, centrifuge the blood sample at a speed of 3000 r/min for 10 min at room temperature to separate the serum. The levels of UA were measured using the rate-based method. TG, TC, HDL-C, and LDL-C levels were measured using the enzyme colorimetric method. FBG was measured using the hexokinase/glucose-6-phosphate dehydrogenase method. All the above indicators were tested using Hitachi 7606 fully automatic analyzer (Hitachi, Tokyo, Japan).
Imaging examination
Two well-trained inspectors, who were blinded to the clinical characteristics and laboratory indicators of participants, used a high-resolution B-mode topographic ultrasound system (ACUSON X300, Siemens, Germany) to perform abdominal ultrasound examinations at Jidong Oilfield Community Hospital.
Data and model assumption processing and
Therefore, we have added a public data processing procedure in the article, and explaining the necessity and rationality of these steps. The handling of hypotheses mainly includes clarifying the assumptions of the statistical model, including the distribution of data, the relationships between data variables, and other aspects. Before conducting regression analysis, the independence, normality, and homogeneity of variance of the data were checked to ensure that the model assumptions were met before proceeding with subsequent analysis.
Quality control measures
Quality control for uric acid determination: (1) Collecting 2–3 mL of fasting venous blood, avoiding hemolysis, hyperlipidemia, and jaundice. Avoid high-nucleic acid foods before testing; (2) Properly storing and timely testing serum samples; (3) Using reliable equipment, calibrated and maintained according to procedures; (4) Ensuring reagent quality and stability, stored at the recommended temperature and used within the expiration date; (5) Implementing proper quality control methods in the lab to ensure testing accuracy and stability.
Quality control measures for NAFLD diagnosis: (1) Medical history collection: Inquire in detail about the medical history of the research subjects; (2) Physical examination: Conduct a comprehensive physical examination, especially palpation of the abdomen, to evaluate the size and texture of the liver; (3) Imaging examination: Evaluate the liver using various imaging techniques to determine the presence and severity of fatty liver.
Statistical methods
The normality of continuous variables was tested using the Kolmogorov–Smirnov test. Continuous variables with a normal distribution are presented as mean ± standard deviation (mean ± SD), while categorical variables are presented as frequency (n) and percentage (%). Differences in the mean value or rate of each characteristic factor among the four groups with different UA levels were analyzed using one-way ANOVA and \(\chi^{2}\) test.
The relationship between UA levels and NAFLD was analyzed by stratification of participants’ BMI. BMI was calculated by dividing weight by the square of height. According to the WHO classification for Asian adults, underweight, normal weight, overweight, and obese participants were defined as those with BMI < 18.5 kg/m2, 18.5 kg/m2 ≤ BMI < 23 kg/m2, 23 kg/m2 ≤ BMI < 25 kg/m2, and BMI ≥ 25 kg/m2, respectively [30]. Cox regression analysis was used to test the association between UA and NAFLD, with variables selected by the forward selection method. The Kaplan–Meier survival curve was used to estimate the cumulative incidence rates of NAFLD in the four groups. All statistical tests were two-sided, and differences were considered statistically significant at P < 0.05.
All statistical analyses were performed using SPSS 25.0 (IBM, New York, USA), and the figures were created using R 4.1.0 (Lucent Technology, New Jersey, USA) and GraphPad Prism 9 (GraphPad Software Inc., La Jolla, CAS, USA).
Results
Baseline characteristics of the participants
Our cohort study included a total of 2984 participants, including 976 men (32.7%) and 2008 women (67.3%), with an average age of 40.76 ± 12.93 years. Except for monthly income and sleep duration, the remaining baseline characteristics such as age, sex, education levels, marital status, physical activity, salt intake levels, smoking, hypertension, diabetes, MS, and dyslipidemia showed a significant difference among four UA groups (P < 0.05, Table 1). Baseline characteristics of participants in different weight groups (supporting materials Table S1-S3).
Table 1 Comparison of baseline characteristics in participants
There were 1746 underweight and normal-weight participants, including 426 males (24.4%), with an average age of 38.47 ± 12.02 years. Among the above baseline characteristics, the age, sex, marital status, smoking, hypertension, and dyslipidemia were different among the four groups with different UA levels (P < 0.05, supporting materials Table S1).
Six hundred ninety-seven overweight participants including 285 males (40.9%), with an average age of 43.29 ± 13.25 years. The baseline characteristics including age, sex, education levels, physical activity, sleep duration, smoking, and hypertension were different among the four UA groups (P < 0.05, supporting materials Table S2).
This study included 541 obese participants, including 265 males (49.0%), with an average age of 44.89 ± 13.70 years. There were differences in sex, education levels, smoking, hypertension, MS, and dyslipidemia among the four groups of UA-level groups (P < 0.05, supporting materials Table S3).
Incidence rates of NAFLD
Among all participants, the NAFLD incidence rates increased significantly with the increase of UA levels (Fig. 2A).
Fig. 2
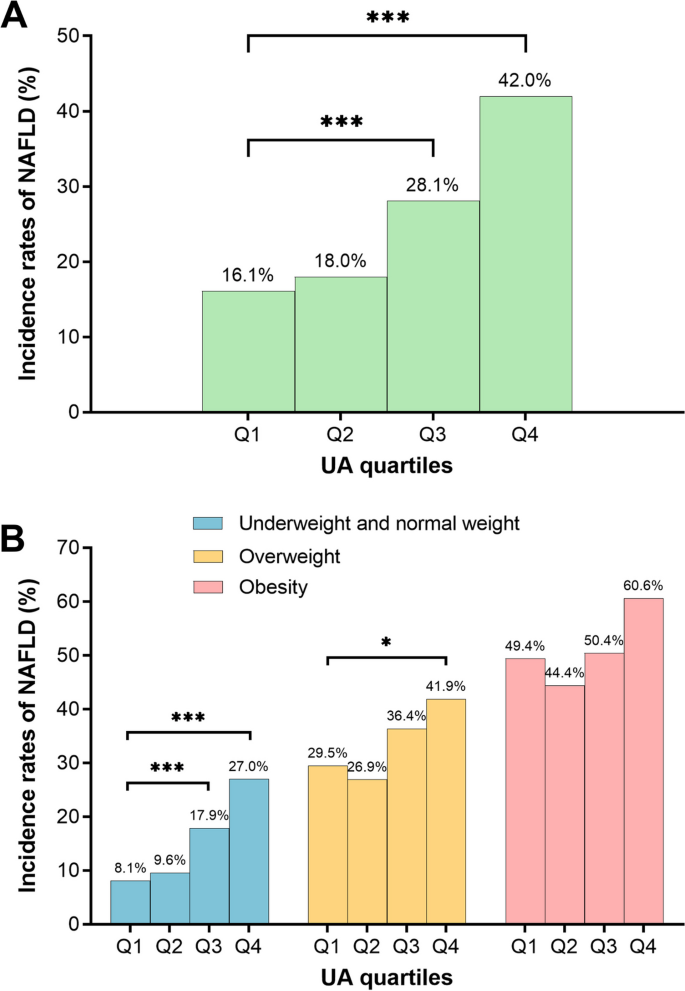
Incidence rates of NAFLD by different UA group. A All participants; (B) underweight and normal weight participants, overweight participants, obese participants. NAFLD, non-alcoholic fatty liver disease; UA, uric acid. Q1, 69–210 μmol/L; Q2, 211–255 μmol/L; Q3, 256–310 μmol/L; Q4, 311–593 μmol/L
The incidence rates of NAFLD increased with the elevation of UA levels in the underweight and normal-weight participants. Among overweight participants, only the incidence rates of NAFLD in the Q4 group were significantly higher than the Q1 group when compared with the Q1 group. Among obese participants, there was no difference in NAFLD incidence rates among the four groups (Fig. 2B).
Incidence rates of NAFLD by different BMI group
The distribution of UA levels in different BMI groups indicates that UA levels increase significantly with the rise of BMI levels. The comparison between normal weight population, overweight population, and obese population showed statistical significance (Fig. 3A).
Fig. 3
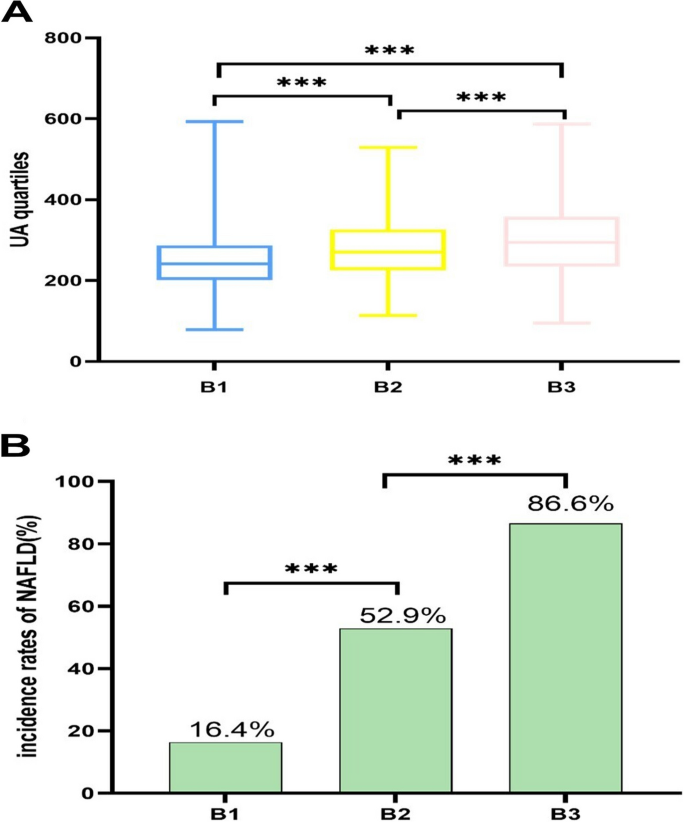
Incidence rates of NAFLD in different BMI levels by all participants. A All participants; (B) All participants. B1,underweight and normal weight participants; B2, overweight participants; B3, obese participants. *P < 0.05; ***P < 0.001. ***P < 0.001
In different BMI groups, the NAFLD incidence rate is the highest among obese people, and the comparison between normal weight people and overweight people as well as overweight people and obese people is statistically significant (Fig. 3B).
Compared to men, women have higher levels of uric acid, which is statistically significant (P < 0.001, supporting materials Fig. S1).
In both men and women, the incidence rate of NAFLD increased with the increase of uric acid level, which was statistically significant. However, under different BMI groups, the correlation between uric acid and NAFLD was only reflected in the normal weight group, and no significant statistical differences were found in overweight and obesity (supporting materials Fig. S2).
Independent variable screening for multivariable analysis
Among underweight and normal-weight participants, univariate analysis showed that high UA levels increased the risk for NAFLD (HR = 3.498, 95% CI: 2.413–5.072). Based on the univariate analysis results, variables including age ≥ 45 years old (HR = 1.773, 95% CI: 1.376–2.284), male participants (HR = 2.061, 95% CI: 1.597–2.660), smoking (HR = 1.888, 95% CI: 1.367–2.609), hypertension (HR = 1.940, 95% CI: 1.507–2.496), MS (HR = 2.277, 95% CI: 1.327–3.906), and dyslipidemia (HR = 3.822, 95% CI: 2.419–6.039) were included in multivariable models (P < 0.05, Fig. 4A).
Among overweight participants, high UA levels were also positively correlated with NAFLD (HR = 1.493, 95% CI: 1.022–2.180). With univariate analysis results, variables including male participants (HR = 1.783, 95% CI: 1.384–2.298), smoking (HR = 1.754, 95% CI: 1.323–2.325), and dyslipidemia (HR = 2.391, 95% CI: 1.601–3.570) were included in multivariable models (P < 0.05, Fig. 4B).
Among obese participants, there was no correlation between high UA levels and NAFLD (HR = 1.310, 95% CI: 0.916–1.873). In the univariate analysis, only dyslipidemia was positively correlated with NAFLD (HR = 1.568, 95% CI: 1.156–2.128) (P < 0.05, Fig. 4C).
Among underweight and normal-weight participants, univariate analysis showed Uric acid is associated with the risk of NAFLD, and this finding is consistent in both males and females (supporting materials Fig. S3 & Fig. S4).
Association between UA and NAFLD
The univariate analysis showed that there was no relationship between UA and NAFLD among obese participants, therefore multivariable analysis was not conducted for them. We selected indicators with statistical significance in the baseline information as control variables in the adjusted model to exclude confounding effects caused by these factors. Five adjusted multivariable Cox regression models were used to examine the potential association between UA and NAFLD. Among underweight and normal-weight participants, after adjusting for the variables selected through univariate analysis, model 4A revealed that the adjusted HRs with 95% CI of UA Q2, UA Q3, and UA Q4 for NAFLD were 1.152 (0.761–1.743), 2.168 (1.489–3.157), and 3.075 (2.103–4.196), respectively. High UA levels were always positively associated with NAFLD in all covariate-adjusted models, suggesting that UA may be an independent risk factor for NAFLD in underweight and normal-weight participants (Fig. 5A).
Fig. 4
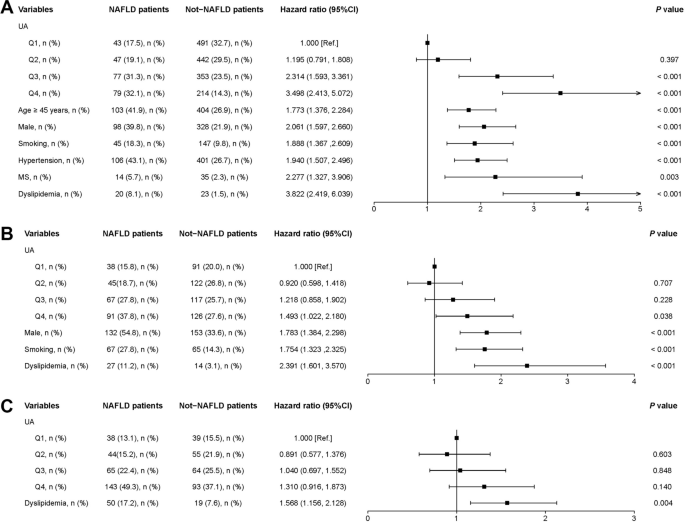
Univariate analysis of NAFLD patients. A Underweight and normal weight participants; (B) overweight participants; (C) obese participants. MS, metabolic syndrome; NAFLD, non-alcoholic fatty liver disease; Ref, reference; UA, uric acid. Q1, 69–210 μmol/L; Q2, 211–255 μmol/L; Q3, 256–310 μmol/L; Q4, 311–593 μmol/L
In overweight participants, there was no correlation between UA levels and NAFLD (Fig. 4B). The HRs with 95% CI of the UA Q2, UA Q3, and UA Q4 for NAFLD were 0.836 (0.541–1.290), 1.037 (0.688–1.563), and 1.006 (0.655–1.546) after adjusting for other variables (Fig. 5B).
NAFLD risk prediction model
Combining UA and classical risk factors, we designed nomograph forms of multiple risk models to predict the risk of NAFLD in the underweight and normal-weight participants. According to the results of Fig. 5, the seven variables including age, sex, UA, smoking, hypertension, MS, and dyslipidemia were finally incorporated into the nomogram prediction model. It was found that when other factors were negative, UA Q4 could explain approximately 17% of NAFLD risks (Fig. 6).
Fig. 5
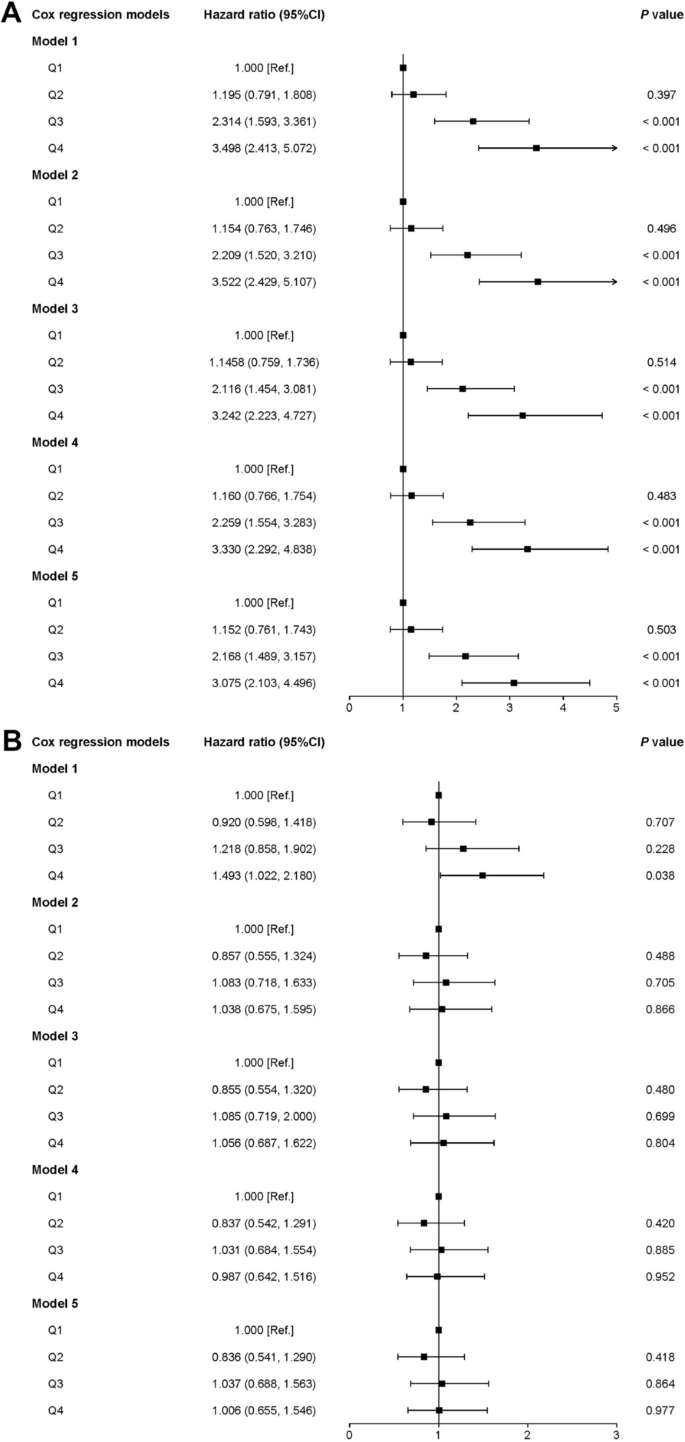
Association between UA and NAFLD in different adjusted multivariable Cox regression models. A Underweight and normal weight participants; model 1: unadjusted; model 2: adjusted for age, sex, and smoking; model 3: adjusted for age, sex, smoking, and hypertension; model 4: adjusted for age, sex, smoking, and dyslipidemia; model 5: adjusted for age, sex, smoking, hypertension, MS and dyslipidemia. B Overweight participants; model 1: unadjusted; model 2: adjusted for sex; model 3: adjusted for sex and smoking; model 4: adjusted for sex and dyslipidemia; model 5: adjusted for sex, smoking, and dyslipidemia. MS, metabolic syndrome; Ref, reference. Q1, 69–210 μmol/L; Q2, 211–255 μmol/L; Q3, 256–310 μmol/L; Q4, 311–593 μmol/L
Fig. 6
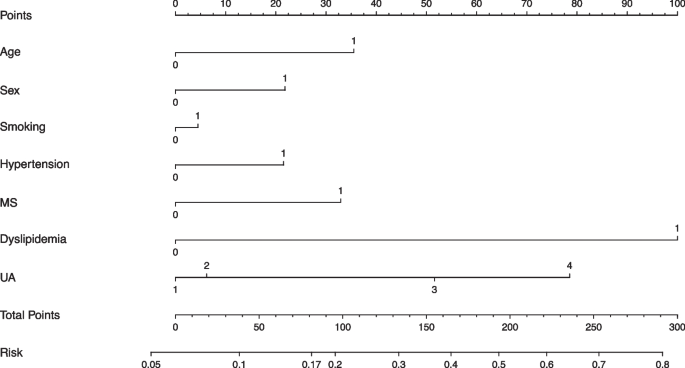
NAFLD risk prediction model. Variable definition, Age: 0 = age < 45 years, 1 = age ≥ 45 years; Sex: 0 = female, 1 = male; Smoking: 0 = no, 1 = yes; Hypertension: 0 = no, 1 = yes; MS: 0 = no, 1 = yes; Dyslipidemia: 0 = no, 1 = yes; UA: 1 = Q1, 2 = Q2, 3 = Q3, 4 = Q4. MS, metabolic syndrome; UA, uric acid. Q1, 69–210 μmol/L; Q2, 211–255 μmol/L; Q3, 256–310 μmol/L; Q4, 311–593 μmol/L
Discussion
In the last two decades, NAFLD has seen a significant increase in its prevalence and has become the most common chronic liver disease globally. Previous studies have reported that high UA levels pose a risk factor for NAFLD in the general population. In our study, we conducted a cohort analysis of 2984 individuals in northern China, which revealed that high UA levels correlated positively with NAFLD among participants with underweight and normal weight participants, indicating that high UA levels could be an independent risk factor for NAFLD in this subgroup. However, no correlation was observed between UA and NAFLD in participants with overweight and obese participants.
Our research showed that the incidence rate of NAFLD in underweight and normal-weight people (14.1%) was far lower than that in overweight (34.8%) and obese people (53.9%), and UA was positively correlated with NAFLD in underweight and normal-weight populations. In previous studies, high BMI was a well-established risk factor for NAFLD, and BMI was positively correlated with the incidence rate of NAFLD [31]. However, the relationship between UA and NAFLD was influenced by BMI. BMI was not only related to NAFLD but also positively correlated with UA levels [4, 32]. To control the impact of BMI, we divided participants into three groups based on BMI and analyzed the correlation between UA levels and NAFLD, respectively. Our results were similar to most studies on non-obese participants. Liu et al.'s research showed that high UA was a risk factor for NAFLD in non-obese individuals and was associated with the inflammation progression of NAFLD [33]. A cross-sectional study on non-obese type 2 diabetes patients also confirmed that UA levels were closely related to NAFLD prevalence, and UA could be considered a predictor of NAFLD in this population [34]. Bao et al. also reported that higher UA levels predict the occurrence of NAFLD in non-obese postmenopausal women [35]. Therefore, these studies suggest that reducing UA levels may be an effective strategy for preventing NAFLD in non-obese individuals.
Our research results indicate that UA was not associated with NAFLD in overweight and obese populations. However, most studies on obese individuals believed that UA was also positively correlated with NAFLD, obesity and UA had additive effects on NAFLD. In obese adults in China, UA can increase the risk of NAFLD and play a role in the pathogenesis of NAFLD [36]. The increase in UA levels in obese people increases the relative risk of NAFLD by 6.47 times for males and 5.87 times for females [37]. A cross-sectional study suggested that UA was a predictive factor for NAFLD in overweight individuals, but UA was not associated with NAFLD in low-weight and normal populations [38]. The above results were contrary to our research. Only one study targeting overweight and obese adolescents showed no correlation between high UA levels and NAFLD in this group [[7](/article/10.1186/s12889-025-21943-w#ref-CR7 "Kosekli MA, Kurtkulagii O, Kahveci G, Duman TT, Tel BMA, Bilgin S, Demirkol ME, Aktas G. The association between serum uric acid to high density lipoprotein-cholesterol ratio and non-alcoholic fatty liver disease: the abund study. Rev Assoc Med Bras (1992). 2021;67(4):549–554. https://doi.org/10.1590/1806-9282.20201005
.")\], which was similar to the results of this study.The mechanism behind the relationship between UA and NAFLD is not yet fully understood. Two hypotheses suggest that UA may influence NAFLD development: one hypothesis proposes that UA can regulate insulin resistance through an NLRP3 inflammatory body-dependent mechanism, affecting NAFLD [39]. The other suggests that UA induction of toxic stairs by regulating oxidative stress related to lipid metabolism can contribute to NAFLD [18]. Research has shown that there are differences in metabolism, genetics, and gut microbiota between obese and non-obese NAFLD patients [21]. Therefore, we believe that the mechanism of NAFLD occurrence varies among different BMI populations. The PNPLA3 gene is closely related to the development of NAFLD and can mediate the susceptibility of multicellular liver cultures of human healthy liver cells to NAFLD through the IL6/STAT3 axis. The PNPLA3 I148M variant is more common in non-obese NAFLD patients, and this gene variant may be a potential driving factor for non-obese NAFLD patients [40, 41]. Insulin resistance is closely related to fat accumulation and steatosis in the liver. Long-term obese individuals can develop insulin resistance through lipotoxicity leading to a significant increase in insulin resistance in overweight and obese NAFLD patients. Insulin resistance can lead to the accumulation of triglycerides in the liver, causing patients to be unable to handle excess fat in the body, causing it to accumulate in the liver, leading to NAFLD [38, 42]. Further research is necessary to investigate the mechanisms behind the association between UA and NAFLD in different BMI populations.
Lean NAFLD was more strongly related to diabetes, hypertension, and MS than obese NAFLD [43]. The degree of liver fibrosis, late cardiovascular incidence rate, and all-cause mortality are higher than those of overweight and obese NAFLD [44]. Reducing UA levels is an effective measure to prevent the occurrence of NAFLD in this population.
Studies have shown that uric acid may induce liver function through the reactive oxygen species/JNK/AP-1 pathway accumulation of visceral fat affects the development of NAFLD [45, 46]. Medications for treating hyperuricemia can not only reduce uric acid but also improve fatty liver, it may even completely alter the pathological state of fatty liver. Overweight, obesity, hyperlipidemia, hyperglycemia, etc. are high-risk factors for NAFLD, and these factors are often associated with hyperuricemia [47, 48]. With the globalization of obesity and its related metabolic syndrome, the incidence rate of NAFLD and hyperuricemia is on the rise. insulin resistance caused by weight gain, especially belly fat, leading to higher uric acid levels and a cycle of liver fat accumulation; increased oxidative stress from obesity and high uric acid, damaging liver cells; faster fat breakdown due to high uric acid, resulting in more liver fat; direct effects of high uric acid on liver enzymes promoting fat accumulation; increased inflammation from obesity and high uric acid driving NAFLD progression; lipid metabolism issues exacerbated by high uric acid in obese individuals; and the combined effects of obesity and high uric acid worsening NAFLD [49]. Understanding these mechanisms can aid in developing better NAFLD prevention and treatment strategies.
In summary, high UA levels as an independent risk factor for NAFLD in underweight and normal weight individuals provide new screening and treatment strategies for clinical practice. The future clinical approach will pay more attention to individualized treatment and early prevention to reduce the incidence rate and complication risk of NAFLD. Meanwhile, by conducting in-depth research on the mechanism between UA and NAFLD, more precise treatment evidence can be provided for clinical practice.
Medical institutions should monitor liver function and uric acid (UA) levels in underweight and normal weight individuals for early NAFLD detection, integrating UA into risk assessments. Personalized treatment for NAFLD patients with high UA, including targeted therapy and lifestyle changes, can improve outcomes. Future research should explore the UA-NAFLD mechanism, considering body weight effects. Treatment will focus on multifactorial interventions, and early prevention through education and lifestyle guidance will be key to reducing NAFLD incidence and complications.
In clinical practice, early screening for NAFLD should be achieved, and doctors should pay more attention to the UA levels of underweight and normal weight patients as one of the potential risk indicators for NAFLD. For patients with elevated UA levels and NAFLD, doctors may need to consider using medication or lifestyle interventions to reduce UA levels. The impact on public health: Public health departments should develop strategies to raise public awareness of the risks of hyperuricemia and NAFLD, and encourage people to adopt healthy lifestyles to reduce these risks. Public health institutions can consider including UA level testing in routine physical examinations, especially for underweight and normal weight populations, in order to detect and intervene in NAFLD early. The government can formulate relevant policies to encourage the food industry to reduce the processing and sales of high purine foods, thereby lowering the overall level of UA in the population.
Highlights
This study identified the association between UA and NAFLD across different weight categories. The findings of this study are particularly significant as they provided targeted measures for preventing NAFLD. The historical cohort study design allowed for quick data collection and a reasonable time series. This design enabled the researchers to accurately establish the causal relationship between high UA levels and NAFLD in underweight and normal-weight individuals. In addition, a nomogram was used to quantitatively represent the proportion of UA levels in the risk of NAFLD. On the other hand, the large sample size of this study can provide more accurate and reliable research results, and the research results are more stable and less susceptible to the influence of individual extreme values. The advantage of designing a longitudinal study is that it can infer the causal relationship between exposure and research outcomes, and long-term follow-up of participants can observe the entire process from exposure to outcome development.
Limitations
It is important to note the limitations of this study. First, we selected a small-scale area in northern China, which may limit the generalizability of the findings to the entire population of China. Second, due to incomplete data from some participants, it can be challenging to sort out and analyze the information accurately. Despite these limitations, the findings contribute to the current understanding of the relationship between UA and NAFLD in a low and normal-weight population.
This study belongs to a historical cohort study, which has certain limitations, including uncertainty in data quality and the possibility of loss of follow-up for various reasons such as migration and death. This loss of follow-up may lead to bias in research results and affect the accuracy of conclusions. In addition, it may not be possible to fully consider all variables that may affect the research results. And it requires a significant investment of manpower, material resources, and financial resources, including data collection, organization, analysis, and follow-up. Although stratified grading and the use of multiple regression models to control for confounding bias have been added in this study, there may still be some residual confounding caused by measurement inaccuracies or errors.
Conclusion
In conclusion, this study demonstrated a significant correlation between UA levels and NAFLD in underweight and normal-weight populations. High UA levels serve as an independent risk factor for NAFLD, emphasizing the importance of early screening in these populations. However, the relationship between UA levels and NAFLD in overweight and obese individuals remains inconclusive. Further research is needed to elucidate the complex interplay between UA, obesity, and other metabolic factors in NAFLD development among different weight categories. Improved understanding of these interactions will contribute to the development of targeted prevention and management strategies for NAFLD. Considering that factors related to obesity are mainly influenced by factors such as diet, lack of physical exercise, genetic factors, daily habits, pathology, etc. Therefore, the validity of the research conclusion can be considered in populations with poor dietary habits, prolonged sitting without exercise, parental obesity, long-term staying up late or insufficient sleep, endocrine disorders, etc.
The impact of the results of this study on public health is mainly manifested in the fact that high UA levels are also identified as independent risk factors for NAFLD in underweight and normal weight individuals. Public health departments need to adjust their early screening strategies for NAFLD, no longer just focusing on overweight and obese populations. This will help detect and intervene in NAFLD earlier, thereby preventing its progression into more severe liver disease. The future research directions are reflected in the following aspects. Firstly, in-depth research on the relationship between UA levels and NAFLD. Future studies can explore the specific biological mechanisms by which UA levels affect the occurrence of NAFLD under different weight states. Further research is needed on the treatment strategies for NAFLD. In the future, effective treatment methods targeting different causes and stages of the disease can be explored, such as drug therapy, nutritional intervention, exercise rehabilitation to improve the treatment effectiveness of NAFLD.
Data availability
The data created and analyzed in this study is privately owned. The requirement to share the data requires valid reasons, and the data can be obtained from the corresponding author.
Abbreviations
BMI:
Body mass index
BP:
Blood pressure
DBP:
Diastolic blood pressure
EDTA:
Ethylenediaminetetraacetic acid
FBG:
Fasting plasma glucose
HDL-C:
High-density lipoprotein cholesterol
LDL-C:
Low-density lipoprotein cholesterol
MS:
Metabolic syndrome
NAFLD:
Non-alcoholic fatty liver disease
SD:
Standard deviation
TC:
Total cholesterol
TG:
Triglyceride
UA:
Uric acid
References
- Powell EE, Wong VW, Rinella M. Non-alcoholic fatty liver disease. Lancet. 2021;397(10290):2212–24.
Article CAS PubMed Google Scholar - Puri P, Sanyal AJ. Nonalcoholic fatty liver disease: Definitions, risk factors, and workup. Clin Liver Dis (Hoboken). 2012;1(4):99–103.
Article PubMed Google Scholar - Younossi ZM, Koenig AB, Abdelatif D, Fazel Y, Henry L, Wymer M. Global epidemiology of nonalcoholic fatty liver disease-Meta-analytic assessment of prevalence, incidence, and outcomes. Hepatology. 2016;64(1):73–84.
Article PubMed Google Scholar - Zhou J, Zhou F, Wang W, Zhang XJ, Ji YX, Zhang P, She ZG, Zhu L, Cai J, Li H. Epidemiological Features of NAFLD From 1999 to 2018 in China. Hepatology. 2020;71(5):1851–64.
Article PubMed Google Scholar - Sheka AC, Adeyi O, Thompson J, Hameed B, Crawford PA, Ikramuddin S. Nonalcoholic Steatohepatitis: A Review. JAMA. 2020;323(12):1175–83.
Article CAS PubMed Google Scholar - Yki-Järvinen H. Non-alcoholic fatty liver disease as a cause and a consequence of metabolic syndrome. Lancet Diabetes Endocrinol. 2014;2(11):901–10.
Article PubMed Google Scholar - Kosekli MA, Kurtkulagii O, Kahveci G, Duman TT, Tel BMA, Bilgin S, Demirkol ME, Aktas G. The association between serum uric acid to high density lipoprotein-cholesterol ratio and non-alcoholic fatty liver disease: the abund study. Rev Assoc Med Bras (1992). 2021;67(4):549–554. https://doi.org/10.1590/1806-9282.20201005.
- Aktas G, Khalid A, Kurtkulagi O, Duman TT, Bilgin S, Kahveci G, Tel BMA, Sincer I, Gunes Y. Poorly controlled hypertension is associated with elevated serum uric acid to HDL-cholesterol ratio: a cross-sectional cohort study. Postgrad Med. 2022;134(3):297–302.
- Aktas G, Kocak MZ, Bilgin S, Atak BM, Duman TT, Kurtkulagi O. Uric acid to HDL cholesterol ratio is a strong predictor of diabetic control in men with type 2 diabetes mellitus. Aging Male. 2020;23(5):1098–1102.
- Kurtkulagi O, Tel BMA, Kahveci G, Bilgin S, Duman TT, Ertürk A, Balci B, Aktas G. Hashimoto's thyroiditis is associated with elevated serum uric acid to high density lipoprotein-cholesterol ratio. Rom J Intern Med. 2021;59(4):403–408.
- Kocak MZ, Aktas G, Erkus E, Sincer I, Atak B, Duman T. Serum uric acid to HDL-cholesterol ratio is a strong predictor of metabolic syndrome in type 2 diabetes mellitus. Rev Assoc Med Bras (1992). 2019;65(1):9–15.
- Aktas G, Yilmaz S, Kantarci DB, Duman TT, Bilgin S, Balci SB, Tel BMA. Is serum uric acid-to-HDL cholesterol ratio elevation associated with diabetic kidney injury? Postgrad Med. 2023;135(5):519–523.
- Kosekli MA, Aktas G. Serum uric acid HDL cholesterol ratio is associated with diabetic control in new onset type2 diabetic population. Acta Clin Croat. 2023;62(2):277–282.
- Cardoso AS, Gonzaga NC, Medeiros CC, Carvalho DF. Association of uric acid levels with components of metabolic syndrome and non-alcoholic fatty liver disease in overweight or obese children and adolescents. J Pediatr (Rio J). 2013;89(4):412–8.
Article PubMed Google Scholar - Copur S, Demiray A, Kanbay M. Uric acid in metabolic syndrome: Does uric acid have a definitive role? Eur J Intern Med. 2022;103:4–12.
Article CAS PubMed Google Scholar - Katsiki N, Dimitriadis GD, Mikhailidis DP. Serum Uric Acid and Diabetes: From Pathophysiology to Cardiovascular Disease. Curr Pharm Des. 2021;27(16):1941–51.
Article CAS PubMed Google Scholar - Zhang S, Wang Y, Cheng J, Huangfu N, Zhao R, Xu Z, Zhang F, Zheng W, Zhang D. Hyperuricemia and Cardiovascular Disease. Curr Pharm Des. 2019;25(6):700–9.
Article CAS PubMed Google Scholar - Xie Y, Wang M, Zhang Y, Zhang S, Tan A, Gao Y, Liang Z, Shi D, Huang Z, Zhang H, et al. Serum uric acid and non-alcoholic fatty liver disease in non-diabetic Chinese men. PLoS ONE. 2013;8(7): e67152.
Article CAS PubMed PubMed Central Google Scholar - Wei F, Li J, Chen C, Zhang K, Cao L, Wang X, Ma J, Feng S, Li WD. Higher Serum Uric Acid Level Predicts Non-alcoholic Fatty Liver Disease: A 4-Year Prospective Cohort Study. Front Endocrinol (Lausanne). 2020;11:179.
Article PubMed Google Scholar - Chen Y, Huang Q, Ai P, Liu H, Chen X, Xu X, Ding G, Li Y, Feng X. Wang X : Association between Serum Uric Acid and Non-Alcoholic Fatty Liver Disease according to Different Menstrual Status Groups. Can J Gastroenterol Hepatol. 2019;2019:2763093.
Article PubMed PubMed Central Google Scholar - Ahmed OT, Gidener T, Mara KC, Larson JJ, Therneau TM, Allen AM. Natural History of Nonalcoholic Fatty Liver Disease With Normal Body Mass Index: A Population-Based Study. Clin Gastroenterol Hepatol. 2022;20(6):1374-1381.e1376.
Article CAS PubMed Google Scholar - Junli Hu, Cai X, Zhu Q, Heizhati M, Wen W, Luo Q, Hong J, Dang Y, Yang W, Li N. Relationship Between Plasma Aldosterone Concentrations and Non-Alcoholic Fatty Liver Disease Diagnosis in Patients with Hypertension: A Retrospective Cohort Study. Diabetes Metab Syndr Obes. 2023;16:1625–36.
Article Google Scholar - Ji L, Cai X, Bai Y, Li T. Application of a Novel Prediction Model for Predicting 2-Year Risk of Non-Alcoholic Fatty Liver Disease in the Non-Obese Population with Normal Blood Lipid Levels: A Large Prospective Cohort Study from China. Int J Gen Med. 2021Jun;28(14):2909–22.
Article Google Scholar - Cai X, Aierken X, Ahmat A, Cao Y, Zhu Q, Ting Wu, Li N. A Nomogram Model Based on Noninvasive Bioindicators to Predict 3-Year Risk of Nonalcoholic Fatty Liver in Nonobese Mainland Chinese: A Prospective Cohort Study. Biomed Res Int. 2020Nov;2(2020):8852198.
Article Google Scholar - Liang Y, Chen P, Chen S, Liu D, Jiang F, Zhu Z, Dong K, Wei L, Hou X. A greater ratio of thigh subcutaneous fat to abdominal fat is associated with protection against non-alcoholic fatty liver disease. JHEP Rep. 2023;5(7): 100730.
Article PubMed PubMed Central Google Scholar - Yang S, Dai F, Wang Z, Li R, Xu X, Li C, Hou X, Liu Y, Wang C, Li D, et al. Association between sun-protective behaviors and hypertension: a cross-sectional study from National Health and Nutrition Examination Survey 2009 to 2014. BMC Public Health. 2023;23(1):1862.
Article PubMed PubMed Central Google Scholar - Zheng H, Chen G, Wu K, Wu W, Huang Z, Wang X, Chen Z, Cai Z, Cai Z, Lan Y, et al. Relationship between cumulative exposure to triglyceride-glucose index and heart failure: a prospective cohort study. Cardiovasc Diabetol. 2023;22(1):239.
Article CAS PubMed PubMed Central Google Scholar - Bystad EW, Stefansson VTN, Eriksen BO, Melsom T. The Association Between Metabolic Syndrome, Hyperfiltration, and Long-Term GFR Decline in the General Population. Kidney Int Rep. 2023;8(9):1831–40.
Article PubMed PubMed Central Google Scholar - Opoku S, Gan Y, Yobo EA, Tenkorang-Twum D, Yue W, Wang Z, Lu Z. Awareness, treatment, control, and determinants of dyslipidemia among adults in China. Sci Rep. 2021;11(1):10056.
Article CAS PubMed PubMed Central Google Scholar - Fan JG, Kim SU, Wong VW. New trends on obesity and NAFLD in Asia. J Hepatol. 2017;67(4):862–73.
Article PubMed Google Scholar - Wang L, Yi J, Guo J, Ren X. Weigh change across adulthood is related to the presence of NAFLD: results from NHANES III. J Transl Med. 2023;21(1):142.
Article PubMed PubMed Central Google Scholar - Kuwabara M, Kuwabara R, Niwa K, Hisatome I, Smits G, Roncal-Jimenez CA, MacLean PS, Yracheta JM, Ohno M, Lanaspa MA et al: Different Risk for Hypertension, Diabetes, Dyslipidemia, and Hyperuricemia According to Level of Body Mass Index in Japanese and American Subjects. Nutrients 2018, 10(8).
- Liu J, Xu C, Ying L, Zang S, Zhuang Z, Lv H, Yang W, Luo Y, Ma X, Wang L, et al. Relationship of serum uric acid level with non-alcoholic fatty liver disease and its inflammation progression in non-obese adults. Hepatol Res. 2017;47(3):E104-e112.
Article CAS PubMed Google Scholar - Cui Y, Liu J, Shi H, Hu W, Song L, Zhao Q. Serum uric acid is positively associated with the prevalence of nonalcoholic fatty liver in non-obese type 2 diabetes patients in a Chinese population. J Diabetes Complications. 2021;35(5): 107874.
Article CAS PubMed Google Scholar - Liu PJ, Ma F, Lou HP, Zhu YN, Chen Y. Relationship between serum uric acid levels and hepatic steatosis in non-obese postmenopausal women. Climacteric. 2014;17(6):692–9.
Article CAS PubMed Google Scholar - Liu CQ, He CM, Chen N, Wang D, Shi X, Liu Y, Zeng X, Yan B, Liu S, Yang S, et al. Serum uric acid is independently and linearly associated with risk of nonalcoholic fatty liver disease in obese Chinese adults. Sci Rep. 2016;6:38605.
Article CAS PubMed PubMed Central Google Scholar - Zhang S, Du T, Li M, Lu H, Lin X, Yu X. Combined effect of obesity and uric acid on nonalcoholic fatty liver disease and hypertriglyceridemia. Medicine (Baltimore). 2017;96(12): e6381.
Article CAS PubMed Google Scholar - Shao C, Ye J, Li F, Feng S, Wang W, Zhong B. Different predictors of steatosis and fibrosis severity among lean, overweight and obese patients with nonalcoholic fatty liver disease. Dig Liver Dis. 2019;51(10):1392–9.
Article PubMed Google Scholar - Wang Q, Wen X, Kong J. Recent Progress on Uric Acid Detection: A Review. Crit Rev Anal Chem. 2020;50(4):359–75.
Article CAS PubMed Google Scholar - Park J, Zhao Y, Zhang F, Zhang S, Kwong AC, Zhang Y, Hoffmann HH, Bushweller L, Wu X, Ashbrook AW, et al. IL-6/STAT3 axis dictates the PNPLA3-mediated susceptibility to non-alcoholic fatty liver disease. J Hepatol. 2023;78(1):45–56.
Article CAS PubMed Google Scholar - Maier S, Wieland A, Cree-Green M, Nadeau K, Sullivan S, Lanaspa MA, Johnson RJ, Jensen T. Lean NAFLD: an underrecognized and challenging disorder in medicine. Rev Endocr Metab Disord. 2021;22(2):351–66.
Article PubMed PubMed Central Google Scholar - Watt MJ, Miotto PM, De Nardo W, Montgomery MK. The Liver as an Endocrine Organ-Linking NAFLD and Insulin Resistance. Endocr Rev. 2019;40(5):1367–93.
Article PubMed Google Scholar - Feng RN, Du SS, Wang C, Li YC, Liu LY, Guo FC, Sun CH. Lean-non-alcoholic fatty liver disease increases risk for metabolic disorders in a normal weight Chinese population. World J Gastroenterol. 2014;20(47):17932–40.
Article PubMed PubMed Central Google Scholar - Xu R, Pan J, Zhou W, Ji G, Dang Y. Recent advances in lean NAFLD. Biomed Pharmacother. 2022;153: 113331.
Article PubMed Google Scholar - Zheng Y, Huang C, Zhao L, Chen Y, Liu F. Regulation of decorin by ursolic acid protects against non-alcoholic steatohepatitis. Biomed Pharmacother. 2021Nov;143: 112166.
Article CAS PubMed Google Scholar - Xie De, Zhao H, Jiaming Lu, et al. High uric acid induces liver fat accumulation via ROS/JNK/AP-1 signaling. Am J Physiol Endocrinol Metab. 2021;320(6):E1032–43.
Article CAS PubMed Google Scholar - Tanaka Y, Nagoshi T, Takahashi H, et al. URAT1-selective inhibition ameliorates insulin resistance by attenuating diet-induced hepatic steatosis and brown adipose tissue whitening in mice. Mol Metab. 2022;55: 101411.
Article CAS PubMed Google Scholar - Konyn P, Ahmed A, Kim D. Causes and risk profiles of mortality among individuals with nonalcoholic fatty liver disease. Clin Mol Hepatol. 2023;29(Suppl):S43–57.
Article PubMed Google Scholar - Daniel Q Huang, Hashem B El-Serag, Rohit Loomba. Global epidemiology of NAFLD-related HCC: trends, predictions, risk factors and prevention. Nat Rev Gastroenterol Hepatol. 2021;18(4):223–238.
Acknowledgements
The authors are very grateful to the epidemiological experts, liver experts, and endocrine experts who assisted, as well as the staff and participants involved in the study.
Funding
This study was supported by the National Natural Science Foundation of China, (No. 81903401), the Joint Innovation Team for Clinical & Basic Research,(202407), Shandong Provincial Natural Science Foundation, (ZR2024MH236 & ZR2023QH135), the Shandong Provincial Natural Science Foundation the Young Taishan Scholars Program of Shandong Province of China, (No. tsqn20161046), the Shandong Province Higher Educational Young and Innovation Technology Supporting Program (2019KJL004).
Author information
Author notes
- Qian He and Xinyue Liu contributed equally to this work.
Authors and Affiliations
- School of Public Health, Shandong First Medical University & Shandong Academy of Medical Sciences, Jinan, Shandong, China
Qian He, Guoyong Ding, Xiaoting Luo, Wenyuan Cao & Weijia Xing - Tai’an City Center for Disease Control and Prevention, Taian, China
Xinyue Liu - Department of Medical, Rizhao Mental Health Center, Rizhao, China
Yiying Wang - Shandong First Medical University & Shandong Academy of Medical Sciences, The Second Affiliated Hospital, Taian, 271000, China
Weijia Xing
Authors
- Qian He
- Xinyue Liu
- Guoyong Ding
- Yiying Wang
- Xiaoting Luo
- Wenyuan Cao
- Weijia Xing
Contributions
Authors’ contributions WX, QH, and XL: study design. XL, YW, XL, WC: data collection, analysis, and interpretation. QH, XL: manuscript writing. QH, Data curation. QHand XL: statistical analysis. GD: technical support, and supervision. WX: critical revision of the manuscript for intellectual content. All authors approved the final version of the paper.
Corresponding author
Correspondence toWeijia Xing.
Ethics declarations
Ethics approval and consent to participate
This study was reviewed and approved by the Ethics Committee of Jidong Oilfield Staff Hospital of China National Petroleum Corporation (Tangshan, China). This study complied with the Helsinki Declaration and obtained written informed consent from each participant.
Consent for publication
Not applicable.
Competing interests
The authors declare no competing interests.
Additional information
Publisher’s Note
Springer Nature remains neutral with regard to jurisdictional claims in published maps and institutional affiliations.
Supplementary Information
Rights and permissions
Open Access This article is licensed under a Creative Commons Attribution-NonCommercial-NoDerivatives 4.0 International License, which permits any non-commercial use, sharing, distribution and reproduction in any medium or format, as long as you give appropriate credit to the original author(s) and the source, provide a link to the Creative Commons licence, and indicate if you modified the licensed material. You do not have permission under this licence to share adapted material derived from this article or parts of it. The images or other third party material in this article are included in the article’s Creative Commons licence, unless indicated otherwise in a credit line to the material. If material is not included in the article’s Creative Commons licence and your intended use is not permitted by statutory regulation or exceeds the permitted use, you will need to obtain permission directly from the copyright holder. To view a copy of this licence, visit http://creativecommons.org/licenses/by-nc-nd/4.0/.
About this article
Cite this article
He, Q., Liu, X., Ding, G. et al. The relationship between serum uric acid level and non-alcoholic fatty liver disease in northern China: a retrospective cohort study.BMC Public Health 25, 718 (2025). https://doi.org/10.1186/s12889-025-21943-w
- Received: 28 September 2023
- Accepted: 13 February 2025
- Published: 21 February 2025
- Version of record: 21 February 2025
- DOI: https://doi.org/10.1186/s12889-025-21943-w