A hypothetical intervention analysis for the effects of healthy dietary patterns on reducing major chronic diseases and mortality associated with air pollutant mixtures (original) (raw)
Abstract
Background
Randomized trials have not assessed how changing dietary patterns affects air pollution-related chronic diseases and mortality. We estimated these risks under hypothetical dietary interventions.
Methods
17,254 UK Biobank adults with repeated 24-h dietary assessments (2009–2012) were included. Exposures to six air pollutants (PM2.5, PM10, NO2, NOX, SO2, and benzene) were estimated using the bilinear interpolation algorithm. Outcomes included incident cardiovascular disease (CVD), diabetes, cancer, chronic kidney disease (CKD), chronic obstructive pulmonary disease (COPD), dementia, and all-cause mortality. Eleven dietary patterns were calculated. Using the parametric g-formula, we simulated interventions increasing dietary scores (75th/90th percentiles, optimal adherence), estimating 13-year cumulative risks and risk difference (RD) for outcomes associated with air pollutant mixtures.
Results
Over 12.9 median follow-up years, 2295 CVD, 475 diabetes, 1912 cancer, 969 CKD, 395 COPD, 405 dementia cases, and 814 deaths occurred. Increased adherence to ten dietary patterns (excluding the healthy low-carbohydrate diet) reduced air pollution-related disease risks, with maximal benefit at optimal adherence. For example, comparing interventions targeting dietary diversity score with non-intervention, the 13-year RD (per 1000 population) ranged from − 0.48 to − 2.14 for CVD, − 2.85 to − 10.16 for diabetes, − 0.65 to − 2.95 for cancer, − 4.26 to − 16.22 for CKD, − 2.79 to − 9.60 for COPD, − 3.64 to − 12.12 for dementia, and − 2.54 to − 9.84 for death.
Conclusions
Interventions optimizing dietary patterns could mitigate the 13-year risks of major chronic diseases and mortality linked to air pollutant mixtures. Adherence to healthy dietary patterns holds significant public health potential for preventing air pollution-related morbidity and premature death.
Graphical Abstract
Highlights
- Parametric g-formula simulated dietary pattern interventions and evaluated effects.
- Ten dietary patterns reduced air pollution-linked chronic disease and mortality risks.
- AMED, DDS, DAI, and E-DII were most effective, reducing all health risks.
- Optimal adherence to healthy dietary patterns yielded the greatest health benefits.
View this article's peer review reports
Background
Noncommunicable chronic diseases, mainly including cardiovascular disease (CVD), diabetes, cancer, chronic obstructive pulmonary disease (COPD), chronic kidney disease (CKD), and dementia, have been the leading causes of premature death worldwide [[1](/article/10.1186/s12916-025-04489-x#ref-CR1 "Institute for Health Metrics and Evaluation (IHME). Global Burden of Disease Study 2021 Results. Seattle: University of Washington; 2024. https://vizhub.healthdata.org/gbd-results
.")\]. In 2021, 43 million deaths from chronic diseases were reported, accounting for 75% of all-cause deaths \[[1](/article/10.1186/s12916-025-04489-x#ref-CR1 "Institute for Health Metrics and Evaluation (IHME). Global Burden of Disease Study 2021 Results. Seattle: University of Washington; 2024.
https://vizhub.healthdata.org/gbd-results
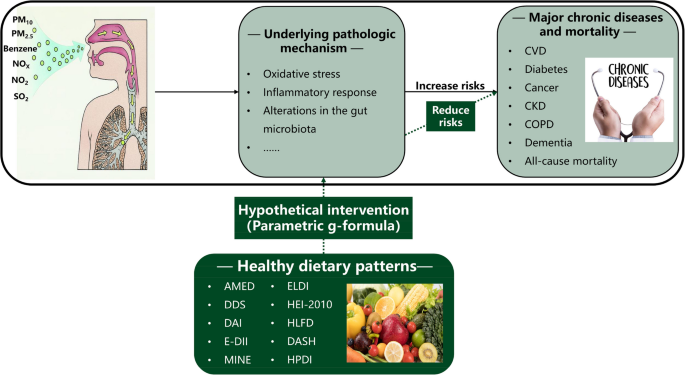
.")\]. The prevalence of chronic diseases and the resulting premature death inevitably contribute to substantial disease and financial burdens \[[2](/article/10.1186/s12916-025-04489-x#ref-CR2 "Zhu K, Li R, Yao P, Yu H, Pan A, Manson JE, et al. Proteomic signatures of healthy dietary patterns are associated with lower risks of major chronic diseases and mortality. Nat Food. 2024;6(1):47–57."), [3](/article/10.1186/s12916-025-04489-x#ref-CR3 "GBD Europe Life Expectancy Collaborators. Changing life expectancy in European countries 1990–2021: a subanalysis of causes and risk factors from the Global Burden of Disease Study 2021. Lancet Public Health. 2025;10(3):e172–88.")\]. Research evidence indicates that ambient air pollution adversely influences chronic diseases and mortality risk \[[4](#ref-CR4 "Liu S, Zhang Y, Ma R, Liu X, Liang J, Lin H, et al. Long-term exposure to ozone and cardiovascular mortality in a large Chinese cohort. Environ Int. 2022;165:107280."),[5](#ref-CR5 "Lin H, Liu T, Xiao J, Zeng W, Li X, Guo L, et al. Mortality burden of ambient fine particulate air pollution in six Chinese cities: results from the Pearl River Delta study. Environ Int. 2016;96:91–7."),[6](#ref-CR6 "Chen G, Qian ZM, Zhang J, Wang X, Zhang Z, Cai M, et al. Associations between changes in exposure to air pollutants due to relocation and the incidence of 14 major disease categories and all-cause mortality: a natural experiment study. Environ Health Perspect. 2024;132(9):97012."),[7](/article/10.1186/s12916-025-04489-x#ref-CR7 "Xia X, Meng X, Liu C, Guo Y, Li X, Niu Y, et al. Associations of long-term nitrogen dioxide exposure with a wide spectrum of diseases: a prospective cohort study of 0.5 million Chinese adults. Lancet Public Health. 2024;9(12):e1047–58.")\]. In 2021, air pollution accounted for 8.1 million deaths globally (approximately 5.7 million attributable to chronic diseases), making it the second leading risk factor for death \[[8](/article/10.1186/s12916-025-04489-x#ref-CR8 "GBD. Global incidence, prevalence, years lived with disability (YLDs), disability-adjusted life-years (DALYs), and healthy life expectancy (HALE) for 371 diseases and injuries in 204 countries and territories and 811 subnational locations, 1990–2021: a systematic analysis for the Global Burden of Disease Study 2021. Lancet. 2024;403(10440):2133–61.")\].The underlying pathologic mechanism is the increase in oxidative stress and the inflammatory response [9] and alterations in gut microbiota [10]. In contrast, healthy dietary patterns, such as the alternate Mediterranean diet (AMED) [11], alternate healthy eating index-2010 (AHEI-2010) [12], Dietary Approaches to Stop Hypertension (DASH) [13], Mediterranean-Dietary Approaches to Stop Hypertension Diet Intervention for Neurodegenerative Delay (MIND) [14], healthy plant-based diet index (HPDI) [15], EAT-Lancet diet index (ELDI) [16], dietary diversity score (DDS) [17], dietary antioxidative index (DAI) [18], energy-adjusted dietary inflammatory index (E-DII) [19], healthy low-fat diet (HLFD) [20], and healthy low-carbohydrate diet (HLCD) [21], could reduce oxidative stress and inflammation [22], and optimize the microbial community structure [23]. Although previous observational studies have investigated the modifying effect of dietary patterns on air pollution-related chronic diseases [24,25,26,27,28,29], few studies have focused on air pollutant mixtures. In the real world, individuals are constantly exposed to a complex mixture of air pollutants, and research on this topic is highly important to public health. Moreover, no randomized trial has quantified the causal modifying effect of dietary pattern interventions on associations between air pollution and chronic diseases, in part because of the inherent challenges in conducting a large-scale, sustained, long-term dietary intervention.
In the absence of randomized trial evidence, a hypothetical intervention analysis using high-quality longitudinal and observational data serves as an alternative approach. In this study, we performed parametric g-formula analysis, a causal inference technique [30], to simulate real-world dietary intervention and evaluate the potential effects [31]. Compared with randomized trials, the parametric g-formula is easier to implement, can simulate multiple interventions simultaneously and explore the optimal intervention strategy, and can consider various intervention types, such as static and dynamic ones [32]. Compared with the conventional exposure–response relationship, the effect values derived from the parametric g-formula can provide more practical, direct, and policy-relevant epidemiological evidence [33, 34]. Using this causal analytical approach, we explored the effect of hypothetical intervention strategies targeting eleven dietary patterns on major chronic diseases and mortality linked to mixtures of six air pollutants (NOX, NO2, PM10, PM2.5, SO2, and benzene) in the UK Biobank cohort.
Methods
Study population
The UK Biobank study is a prospective cohort including over 500,000 participants aged 37–73, recruited from 22 UK assessment centers between 2006 and 2010 [35]. To examine associations between air pollutant mixtures and health outcomes, we included 399,399 participants who met the eligibility criteria (Additional file 1: Fig. S1). To perform parametric g-formula analysis, we first selected 17,768 participants (from the total cohort of 502,411 adults,) who completed 24-h dietary questionnaires in 2009–2010, 2011, and 2012. Subsequently, we excluded the following: (a) participants lost to follow-up (defined as permanent cessation of health data updates due to uncertified death, NHS-recorded disconnection/emigration, self-reported relocation, or consent withdrawal for future linkages; n = 43); (b) those with missing air pollution data (n = 11); (c) individuals with implausible energy intake (males: > 4200 or < 800 kcal/day; females: > 3500 or < 600 kcal/day; _n_ = 411) [36]; and (d) those with extreme BMI values (> 50 or < 15 kg/m2; n = 49) (Additional file 1: Fig. S2). The final analytical sample comprised 17,254 participants.
Ascertainment of outcomes
The outcomes were the incidence of CVD, diabetes, cancer, CKD, COPD, dementia, and all-cause mortality. The outcomes were determined using data from primary care records, hospital admissions, cancer diagnoses, and death registries linked to the UK Biobank [35]. Incident CVD events included heart failure (I50), stroke (I60–I69), atrial fibrillation (I48), peripheral vascular disease (I70–I79), coronary heart disease (I20–I25), and other cardiac diseases (I42–I43, I46), as defined by the International Classification of Diseases, Tenth Revision (ICD-10). Incident diabetes was coded as E10–E14. Incident cancers (including melanoma, stomach cancer, colon cancer, lung cancer, prostate cancer, breast cancer, and other cancers) were coded as C00–C97 (excluding C44). Incident CKD was coded as N03–N05, N17–N19, N21, and Q61. Incident COPD was coded as J41–J44. Incident dementia was coded as F00, F01, F03, F05, F10, F30, and F31. Participants were followed up from the completion of their first 24-h dietary recall survey until loss to follow-up, occurrence of health outcomes, or the study endpoint (31 October 2022 for England, 31 August 2022 for Scotland, and 31 May 2022 for Wales; mortality data were available until 30 November 2022), whichever occurred first.
Assessment of air pollution exposure
Annual concentrations of air pollutants (PM2.5, PM10, NO2, NOX, SO2, and benzene) were obtained from the UK Department for Environment, Food and Rural Affairs at 1 km × 1 km resolution and georeferenced to the OSGB1936 British National Grid [37]. Residential addresses were acquired through the Administrative Data Liaison Service (providing complete historical records: street names, house numbers, dates of change), with participant self-updates permitted via the portal. For privacy protection, all geographic data were anonymized to 1 km grid coordinates.
Air pollutant exposures were estimated for each participant using a bilinear interpolation algorithm [38], with exposures assessed over the 3-year period preceding enrollment until the first occurrence of the following: (a) health outcomes, (b) death, (c) loss to follow-up, or (d) the endpoint of the study. This 3-year window selection was justified by disease latency periods, exposure-disease tradeoffs, and UK Biobank pollutant data availability [39, 40]. Exposure calculations were based on participants’ residential addresses, with mean concentrations derived from the four nearest monitoring grids. For individuals who had changed geocoded home addresses, we further calculated the mean exposure concentration by weighting the time spent at each residential location [41]. The pollutant mixture consisted of these six air pollutants (more details on the assessment of air pollution exposures are provided in Additional file 1: Method S1) [37, 38, 41].
Assessment of dietary pattern scores
We calculated 11 dietary patterns (AHEI-2010, AMED, DDS, DASH, HPDI, ELDI, MIND, DAI, E-DII, HLCD, and HLFD) based on five rounds of 24-h dietary assessments, which were conducted with the Oxford WebQ questionnaire from 2009 to 2012 [36]. The first round was from April 2009 to September 2010; the second round was from February 2011 to April 2011; the third round was from June 2011 to September 2011; the fourth round was from October 2011 to December 2011; and the fifth round was from April 2012 to June 2012. Using this dietary consumption information, we assessed the consumption of time-varying dietary components from 2009 to 2021. Data for 2009 and 2010 came from the first survey. For 2011, samples from the second, third, and fourth surveys were combined. If participants completed two or more 2011 surveys, intake was calculated by means. The data for 2012 were from the fifth survey. Dietary intake was assumed to be unchanged from 2012 to 2021 (details of the dietary components and scoring approaches for dietary patterns are shown in Additional file 1: Method S2) [11,12,13,14,15,16,17,18,19,20,21, 42,43,44,45,46,47,48,49,50].
Hypothetical intervention strategies
At observed exposure levels to the mixture of six pollutants, we simulated two threshold interventions and one static intervention for each of the eleven dietary patterns. For threshold interventions, two thresholds for each dietary pattern based on population distribution were established: the 75th (P75) and the 90th percentiles (P90). The P75 threshold aimed to improve dietary adherence to a moderately high level (moderately-high-adherence strategy), whereas the P90 threshold represented a high-adherence target that could provide greater health benefits (high-adherence strategy), thus allowing for tiered intervention strategies. We only “intervened” for participants whose dietary pattern scores were lower than the thresholds at every time point. In the static intervention, all participants’ dietary pattern scores were set at the best adherence scores (optimal adherence strategy). The observed values of six pollutants and dietary pattern scores were considered the reference strategy (i.e., no intervention or natural course). In Additional file 1, Table S1 presents four intervention strategies, while Table S2 provides detailed interventions for each dietary pattern.
Statistical analysis
We applied multiple imputation techniques to fill in missing data on race, educational attainment, family income, body mass index (BMI), physical activity, smoking status, and alcohol consumption (Additional file 1: Method S3) [51, 52]. The characteristics of potential confounders, air pollution exposure concentrations, and dietary pattern scores are reported as numbers (proportions) or means with standard deviations (SDs), as appropriate.
We first employed quantile g-computation [53, 54] to examine associations between air pollutant mixtures and health outcomes. Subsequently, we applied multivariate generalized propensity score (mvGPS) models [55] for causal inference regarding these associations (for details of the procedures for fitting the quantile g-computation and mvGPS models, see Additional file 1: Method S4) [53,54,55,56,57,58]. Building on these established associations, we utilized the parametric g-formula to simulate dietary pattern interventions and quantitatively assess how dietary patterns modify health risks associated with air pollutant exposure. Specifically, through the parametric g-formula, the distinct effects of air pollutant mixtures on 13-year cumulative risks of CVD (or other outcomes) under three hypothetical dietary pattern interventions were evaluated and compared with the natural course. The parametric g-formula, which is based on counterfactual theory and Monte Carlo simulation, is a generalized standardized computational formula [30]. In this study, “factual” refers to all observed data, including air pollution exposure, dietary pattern adherence, confounders, and health outcomes. In contrast, “counterfactual” corresponds to hypothetical scenarios where dietary adherence was set to a specific intervention level, while air pollution exposure, confounders, and outcomes held fixed at their observed values. For each dietary pattern, three counterfactual scenarios were defined (for details of counterfactual scenarios, see Additional file 1: Method S5) [59, 60]. This approach can handle multiple exposures simultaneously, model time-varying covariates flexibly, quantify the effect of hypothetical dynamic interventions, and provide direct, accurate, and causally interpretable results [31]. The parametric g-formula requires three key assumptions: positivity, consistency, and exchangeability [59] (for details on the explanation and validation of the parametric g-formula assumptions, see Additional file 1: Method S6).
Following previous research [34, 61], the parametric g-formula was implemented in four steps in this study. In Step 1, separate linear regression models were fitted for each time-varying covariate (i.e., covariate models). These time-varying covariates included PM10, PM2.5, NOX, NO2, SO2, benzene, AHEI-2010 (or other dietary patterns) scores, family income, educational attainment, smoking status, physical activity, alcohol consumption, dietary supplements, and total energy intake. In these covariate models, we controlled for potential confounders using the minimal sufficient adjustment set identified through Directed Acyclic Graph (DAG) analysis (see Additional file 1: Fig. S3 and S4). Specifically, we adjusted for the following: (a) time-fixed confounders (sex, age, race, residential area, and family history of CVD [or diabetes/cancer/COPD/dementia, adjusted for the family history of diseases corresponding to different health outcomes]); (b) previous-year and same-year values of the aforementioned time-varying covariates; and (c) the categorical time interval index—to estimate the joint conditional probability distribution of time-varying covariates. In covariate models of dietary pattern scores, we additionally adjusted for total energy intake and dietary supplements. Details on the assessment of potential confounders are available in Additional file 1: Method S7 [62,63,64,[65](/article/10.1186/s12916-025-04489-x#ref-CR65 "Desapriya EBR, Stockwell T, Doll SR, Room R. International guide for monitoring alcohol consumption and related harm. Geneva: World Health Organization; 2000. https://iris.who.int/server/api/core/bitstreams/103a29f4-dc51-464d-b6ef-5948c312ae6c/content
.")\] and Table S3\. In Step 2, outcome models (for CVD, diabetes, cancer, CKD, COPD, dementia, and all-cause mortality) were fitted using the pooled logistic regression model. In these outcome models, we adjusted for the same time-fixed confounders as in covariate models of dietary patterns, plus previous-year and same-year values of all time-varying variables, the quadratic function of categorical time interval index, and interaction terms between time-varying variables and categorical time interval index, to determine the joint conditional probability distribution of outcomes. Notably, we constructed separate covariate models for each air pollutant while incorporating all six pollutants in a single outcome model to assess their mixed exposure effects. Model specifications for covariate and outcome models are detailed in Additional file 1: Method S8.In Step 3, the Monte Carlo simulation was applied to create new datasets and alter the values of the intervention variables. For each intervention, 30,000 individuals were randomly sampled with replacements from the original study population to generate a new dataset. In these datasets, intervention variables (11 dietary patterns) were updated at each post-baseline time point according to intervention strategies, with their values at subsequent time points iteratively simulated from the joint conditional probability distribution of time-varying covariates estimated in Step 1. In Step 4, effects and confidence intervals were calculated. According to simulated datasets from Step 3 and the joint conditional probability distribution of outcomes estimated in Step 2, we estimated the hazard of outcomes at each time point. At each time point, the cumulative risk of outcomes for each participant was calculated as the cumulative sum of the product of the outcome hazard and the probability of surviving without outcome occurrence at all previous time points. We then standardized the cumulative risks of outcomes (per 1000 population) under each hypothetical intervention by averaging individual cumulative risks across all simulated participants at each time point, including the final 13-year cumulative risk. Additionally, the risk difference (RD, per 1000 population) of 13-year cumulative risks of outcomes for each simulated strategy relative to the natural course was calculated. The 95% confidence intervals (CIs) for all effect values were calculated via 200 bootstrap iterations.
Sensitivity analyses
To test the robustness of our results, we conducted four sensitivity analyses. First, to extend the exposure window and avoid reverse causation, we further adjusted for the previous 2-year values of all time-varying covariates in covariate models and outcome models. Second, we further included BMI (≥ 30 kg/m2/25–29.9 kg/m2/18.5–24.9 kg/m2/< 18.5 kg/m2), hypertension (yes/no), and hyperlipidemia (yes/no) in covariate and outcome models. Third, two alternative threshold interventions (60th and 80th percentiles) were simulated for each dietary pattern. Fourth, we increased the number of Monte Carlo simulations to 50,000 per intervention strategy and calculated 95% CIs for all effect estimates through 300 bootstrap iterations.
We performed all analyses in R software (version 4.4.0). The parametric g-computation was built using the “gfoRmula” package, and the mvGPS model was performed using the “mvGPS” package. A two-tailed p value of < 0.05 was considered to indicate statistical significance.
Results
Characteristics of the included participants
The baseline characteristics of the 17,254 included study participants (57.8% female; mean age 56.6 ± 7.8 years), categorized by disease status, are shown in Additional file 1: Tables S4–S9. Compared with individuals who did not develop diseases, those with diseases tended to be male, older, and have lower household incomes and educational levels. They were more likely to be previous or current smokers, consume more alcohol and energy, have a family history of diseases, and have a higher prevalence of hypertension, hyperlipidemia, and obesity/overweight. Dementia cases were more likely to have higher PM2.5, PM10, NOX, and NO2 exposure than other disease groups, whereas the latter showed similar exposure levels across all six pollutants (Additional file 1: Tables S4–S9). Average exposure levels of six air pollutants (2009–2021) showed no significant differences between repeated dietary assessment completers and non-completers (P > 0.05) (Additional file 1: Table S10). The observed average concentrations of air pollutants (excluding SO2 and benzene) decreased annually from 2009 to 2021 (Additional file 1: Fig. S5). Most of the correlations among the 11 dietary pattern scores across all time points were moderate (Additional file 1: Fig. S6).
Associations of air pollutant mixtures with health outcomes
We observed that air pollutant mixtures were linked to an elevated risk of all health outcomes in both the quantile g-computation and the mvGPS models (Additional file 1: Table S11). For example, the mvGPS models showed that a simultaneous increase in all six pollutant concentrations per quantile was associated with elevated risks of CVD (HR: 1.044 (95% CI: 1.032, 1.057)), diabetes (HR: 1.176 (95% CI: 1.147, 1.206)), cancer (HR: 1.035 (95% CI: 1.021, 1.048)), CKD (HR: 1.106 (95% CI: 1.085, 1.128)), COPD (HR: 1.207 (95% CI: 1.176, 1.240)), dementia (HR: 1.105 (95% CI: 1.078, 1.132)), and all-cause mortality (HR:1.044 (95% CI: 1.025, 1.063)) in the fully adjusted model.
The modifying effects of healthy dietary patterns
In the final sample, we identified 2295 (13.8%) CVD cases, 475 (2.9%) diabetes cases, 1912 (12.2%) cancer cases, 969 (5.7%) CKD cases, 395 (2.3%) COPD cases, 405 (2.4%) dementia cases, and 814 (4.7%) all-cause deaths during the 12.9 median follow-up years (220,454 person-years). The cumulative incidence risks of diseases derived from natural course simulation showed concordance with observed data (using CVD and cancer as examples; P > 0.05; Additional file 1: Fig. S7).The 13-year cumulative risks of major chronic diseases and death under different hypothetical interventions targeting eleven dietary patterns are shown in Additional file 1: Tables S12–S14. Overall, all hypothetical dietary patterns (except for the HLCD) intervention strategies led to lower 13-year risks of major chronic diseases and death linked to air pollutant mixtures than the estimated value under no intervention.
Hypothetical intervention analyses revealed that hypothetical interventions targeting AMED, DDS, DAI, and E-DII reduced the 13-year risks of all health outcomes linked to air pollutant mixtures to varying degrees compared with the natural course (Fig. 1). For example, when increasing the annual DDS to ≥ 10 (intervening on individuals below the 75th percentile), ≥ 12 (90th percentile), or 18 (the best adherence score), the 13-year RD ((per 1000 population) (95% CI)) relative to the natural course ranged from − 0.48 (− 0.76, − 0.13) to − 2.14 (− 3.05, − 1.19) for CVD, − 2.85 (− 4.65, − 0.83) to − 10.16 (− 14.36, − 5.15) for diabetes, − 0.65 (− 1.05, − 0.22) to − 2.95 (− 3.96, − 1.96) for cancer, − 4.26 (− 6.36, − 1.94) to − 16.22 (− 21.30, − 10.33) for CKD, − 2.79 (− 4.13, − 1.39) to − 9.60 (− 13.79, − 5.13) for COPD, − 3.64 (− 4.82, − 2.53) to − 12.12 (− 15.57, − 8.90) for dementia, and − 2.54 (− 3.78, − 1.22) to − 9.84 (− 12.57, − 6.97) for all-cause mortality.
Fig. 1
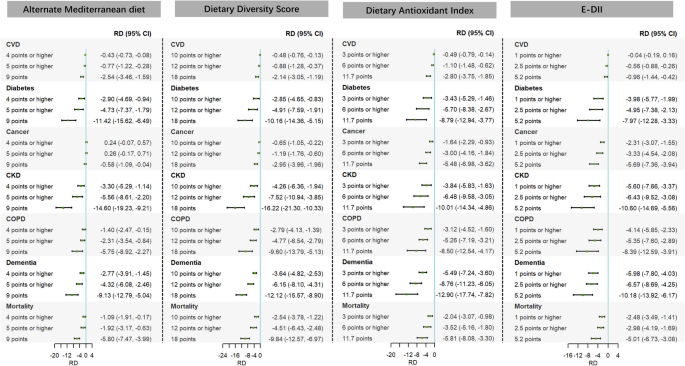
Differences in the estimated 13-year risks of major chronic diseases and mortality linked to air pollutant mixtures under different alternate Mediterranean diet, dietary diversity score, dietary antioxidant index, and E-DII intervention strategies compared with the natural course. Note: CI, confidence interval; CKD, chronic kidney disease; COPD, chronic obstructive pulmonary disease; CVD, cardiovascular disease; E-DII, energy-adjusted dietary inflammatory index; RD, risk difference
The MIND and ELDI interventions would result in reductions in 13-year risks of major chronic diseases (except for cancer) and death linked to air pollutant mixtures (Fig. 2). Specifically, when three hypothetical interventions targeting MIND were compared with the natural course, the 13-year RD (per 1000 population) ranged from − 0.38 to − 2.82 for CVD, − 5.36 to − 19.73 for diabetes, − 5.34 to − 24.78 for CKD, − 2.24 to − 10.45 for COPD, − 2.12 to − 10.00 for dementia, and − 1.97 to − 10.53 for all-cause death; when interventions targeting ELDI were compared with the natural course, the 13-year RD (per 1000 population) ranged from − 0.96 to − 5.67 for CVD, − 3.28 to − 14.50 for diabetes, − 7.42 to − 32.02 for CKD, − 3.88 to − 15.04 for COPD, − 4.74 to − 17.84 for dementia, and − 2.68 to − 13.50 for all-cause death. The HEI-2010 and HLFD interventions would result in reductions in 13-year risks of major chronic diseases (except for CVD) and death linked to air pollutant mixtures (Fig. 2). Specifically, when interventions targeting HEI-2010 were compared with the natural course, the 13-year RD (per 1000 population) ranged from − 3.40 to − 12.91 for diabetes, − 0.21 to − 1.45 for cancer, − 4.62 to − 16.53 for CKD, − 1.44 to − 5.03 for COPD, − 5.51 to − 15.54 for dementia, and − 2.00 to − 7.60 for all-cause death; when interventions targeting HLFD were compared with the natural course, the 13-year RD (per 1000 population) ranged from − 1.25 to − 2.34 for diabetes, − 0.44 to − 0.59 for cancer, − 0.80 to − 2.49 for CKD, − 1.37 to − 3.21 for COPD, − 3.21 to − 7.57 for dementia, and − 0.99 to − 2.27 for all-cause death.
Fig. 2
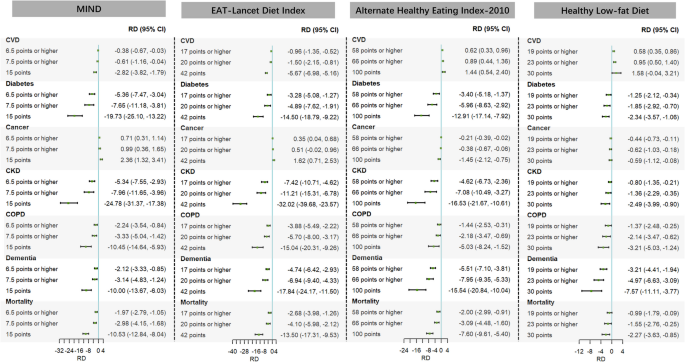
Differences in the estimated 13-year risks of major chronic diseases and mortality linked to air pollutant mixtures under different MIND, Eat-Lancet diet index, alternate healthy eating index-2010, and healthy low-fat diet intervention strategies compared with the natural course. Note: CI, confidence interval; CKD, chronic kidney disease; COPD, chronic obstructive pulmonary disease; CVD, cardiovascular disease; MIND, Mediterranean-Dietary Approaches to Stop Hypertension Diet Intervention for Neurodegenerative Delay; RD, risk difference
The DASH and HPDI interventions mitigate the 13-year risks of major chronic diseases (except for CVD and cancer) and death linked to air pollutant mixtures (Fig. 3). Specifically, compared to the natural course, the 13-year risks of major chronic diseases and death would decrease substantially when yearly DASH scores were hypothetically increased to be greater than or equal to 25 (intervening on individuals below the 75th percentile), 29 (90th percentile), and equal to 40 (the best adherence score) (RD (per 1000 population) ranged from − 4.48 to − 14.24 for diabetes, − 4.65 to − 16.67 for CKD, − 2.15 to − 7.08 for COPD, − 3.74 to − 11.56 for dementia, and − 1.92 to − 7.06 for all-cause mortality); the 13-year risks of major chronic diseases and mortality would also decrease substantially when yearly HPDI scores were hypothetically increased to be greater than or equal to 60 (intervening on individuals below the 75th percentile), 64 (90th percentile), and equal to 85 (the best adherence score) (RD (per 1000 population) ranged from − 5.27 to − 16.70 for diabetes, − 4.94 to − 18.65 for CKD, − 0.39 to − 1.74 for COPD, − 1.81 to − 6.45 for dementia, and − 0.47 to − 2.08 for all-cause mortality). However, the HLCD only mitigates the 13-year incidence risks of cancer linked to air pollutant mixtures (Fig. 3).
Fig. 3
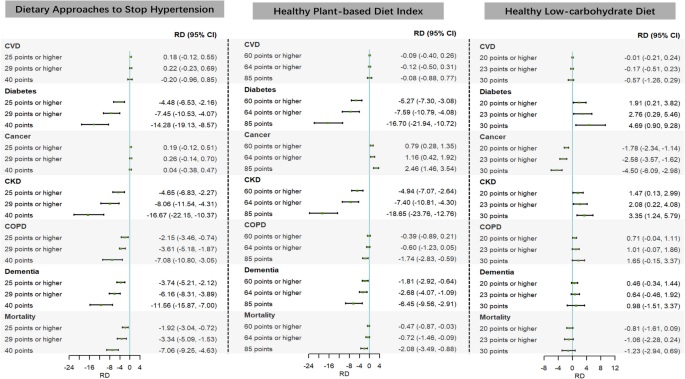
Differences in the estimated 13-year risks of major chronic diseases and mortality linked to air pollutant mixtures under different Dietary Approaches to Stop Hypertension, healthy plant-based diet index, and healthy low-carbohydrate diet intervention strategies compared with the natural course. Note: CI, confidence interval; CKD, chronic kidney disease; COPD, chronic obstructive pulmonary disease; CVD, cardiovascular disease; RD, risk difference
For the above intervention strategies with significant effects, we also observed that the greater the increase in dietary pattern scores relative to the observed score, the lower the 13-year risks of health outcomes in relation to the natural course (Additional file 1: Talbes S12–S14), and the reduction in 13-year risks (i.e., the RD) of outcomes compared to the natural course became more pronounced, with the greatest estimated benefit at ‘the best adherence’ intervention (Additional file 1: Fig. S8–S18).
Sensitivity analyses
When we adjusted for previous 2-year values of all time-varying covariates (Additional file 1: Tables S15–S17), included BMI, hypertension, and hyperlipidemia in the covariate and outcome models (Additional file 1: Tables S18–S20), simulated alternative threshold interventions (Additional file 1: Tables S21–S23), and increased the number of Monte Carlo simulations and bootstrap iterations (Additional file 1: Tables S24–S26), the results remained robust.
Discussion
The hypothetical intervention analysis of this study, employing parametric g-formula, was focused on 11 dietary patterns. The results showed that these dietary patterns (except for the HLCD) significantly mitigated, to a certain degree, the 13-year risks of major chronic diseases and mortality linked to air pollutant mixtures. Among them, the AMED, DDS, DAI, and E-DII were particularly prominent and could reduce the incidence risks of all health outcomes. Among these intervention strategies with significant effects, the optimal adherence strategies gained the most considerable health benefits. Moreover, on the whole, these strategies were most pronounced in reducing risks of diabetes, CKD, and dementia. These findings remained robust in sensitivity analyses.
Comparison with other studies
In recent years, increasing evidence has indicated that individual and combined exposure to various air pollutants are risk factors for multiple chronic diseases, such as diabetes [66, 67], CVD [38, 68,69,70,71], cancer [72, 73], dementia [74, 75], CKD [76, 77], COPD [78, 79], death [80, 81], and other chronic diseases [82,83,84,85]. Consistent with these findings, the results of the present study from the quantile g-computation and mvGPS methods revealed significant adverse effects of exposure to a mixture of six air pollutants (NOX, NO2, PM10, PM2.5, SO2, and benzene) on CVD, diabetes, cancer, CKD, COPD, dementia, and all-cause mortality. Consistent results were also obtained when we used the air pollutant mixture score to represent concentrations of air pollutant mixtures.
Growing evidence indicates that healthy dietary patterns, including anti-inflammatory diets [24, 86, 87], Mediterranean diets [25], plant-based dietary patterns [26], MIND [27], animal dietary patterns [28], antioxidant dietary patterns [29], and dietary diversity [66] modify associations between air pollution and health outcomes. However, no studies assess how dietary patterns modify the health effects of air pollutant mixtures. Furthermore, current methods (e.g., multiplicative/additive interactions and stratified analyses comparing HRs/ORs across dietary levels) have significant limitations. These conventional approaches cannot address subgroup nonhomogeneity, false positives from multiple comparisons, false negatives from insufficient statistical power, or time-varying covariates [88, 89]. Additionally, the findings can only provide inferential evidence for effect modification [34]. Notably, we observed no significant modification effects of the healthy low-carbohydrate diet on air pollution-related chronic disease and mortality risks. This finding aligns with inconsistent existing evidence on low-carbohydrate diets and chronic disease outcomes [90,91,92,93,94,95]. While some studies report metabolic health benefits [90,91,92, 95], others associate these diets with dyslipidemia and increased insulin resistance, potentially due to imbalanced macronutrient distribution (higher fat/protein intake) and reduced dietary fiber [93, 94, 96]. Such discrepancies may stem from population differences, methodological variations in dietary/outcome assessment, and inconsistent confounding adjustment, which could explain the heterogeneity in our results.
The parametric g-formula, as a generalization of nonparametric standardization for causal inference, offers solutions to these methodological challenges. While previous studies have successfully applied this method to assess air pollution’s public health effects [34, 97], its potential to assess dietary modification of these associations remains unexplored. Our study addresses this gap by employing three key advantages of the parametric g-formula: (1) it simulates different dietary interventions within the same population, avoiding problematic subgroup comparisons and enhancing reliability [88, 89]; (2) it can handle both time-fixed and time-varying exposures, confounders, and their interactions, better reflecting real-world dynamics and reducing residual confounding [34, 98]; and (3) it can directly provide absolute measures (RDs) of the simulated interventions. This allows for intuitive comparisons of effects between diverse dietary pattern interventions or against the natural course. For example, in the current study, the parametric g-formula analysis showed that increasing yearly ELDI adherence to ≥ 17, ≥ 20, and 42 points reduced 13-year mortality risks (per 1000 population) by − 2.68 (− 3.98, − 1.26), − 4.10 (− 5.98, − 2.12), and − 13.50 (− 17.31, − 9.53), respectively, compared to the natural course. This demonstrates that optimal ELDI adherence could prevent approximately 14 premature deaths per 1000 participants exposed to air pollution. Moreover, we can track how cumulative risks of outcomes evolve over time under simulated intervention scenarios, showing the progressive reduction in cumulative risks attributable to the intervention. The wider confidence intervals at optimal adherence (i.e., score = 42) reflect greater model extrapolation uncertainty due to sparse observational data at exposure extremes. In contrast, percentile-based thresholds (i.e., ≥ 17 or ≥ 20) leverage natural population variability within observed exposure ranges, yielding more precise effect estimates.
Methodologically, the parametric g-formula requires the consistency assumption—that observed outcomes under an intervention equal their potential outcomes when interventions are well-defined [59]. The consistency assumption holds in this study because: (a) dietary interventions were explicitly operationalized as sustained adherence increases to 75th percentile (moderately high), 90th percentile (high), and optimal levels (e.g., AHEI-2010 requiring ≥ 4 fruit servings/day with elimination of sugar-sweetened beverages); and (b) individual dietary changes were unlikely to affect others’ outcomes (no interference). For real-world translation, population-level adherence could be improved through policy interventions (e.g., Colombia’s food product reformulation [60]), while digital tools and community programs could maintain individual compliance.
Biologically, several mechanisms may explain how healthy dietary patterns attenuate air pollution-related mortality and chronic disease incidence. Long-term air pollution exposure triggers oxidative stress, systemic inflammation [9], gut microbiota alterations [10], and disruptions in coagulation, endothelial function, and lipid metabolism [99, 100]. These pathological processes collectively promote glucose intolerance, insulin resistance, and vascular dysfunction—key drivers of chronic diseases [25, 67]. Conversely, promoting a higher intake of fish, whole grains, vegetables, fruits, legumes, and nuts while restricting the consumption of refined grains, ultra-processed foods, added sugars and fats, and red meat and maintaining balanced nutrition are the common traits of various healthy dietary patterns. These dietary characteristics could be beneficial in reducing oxidative stress and inflammation [22] and the diversity of the human gut microbiome and optimizing the microbial community structure [23] via sufficient consumption of vitamins, dietary fibers, fatty acids, bioactive components, and phytochemical components [101,102,103,104,105]. That is, air pollution and healthy dietary patterns act on major chronic diseases and death via the same pathological pathway but in opposite directions. Therefore, better adherence to healthy dietary patterns could counteract the detrimental impacts of air pollution on health risks.
Nevertheless, we emphasize that air pollution is fundamentally a systemic issue requiring policy-level solutions. While individual dietary changes show that even partial improvements can confer significant disease risk reduction, such behavioral approaches alone remain insufficient and ethically problematic—particularly as disadvantaged communities face compounded challenges of higher pollution exposure and greater barriers to healthy eating (e.g., food access, economic constraints). Although achieving optimal dietary adherence remains aspirational, these findings precisely highlight the need for integrated, equity-focused strategies: implementing source-level pollution reduction alongside targeted dietary interventions (e.g., food subsidies, vouchers for vulnerable populations) to ensure universally accessible health protections. Future research needs explicitly to examine socioeconomic disparities in both environmental exposure and dietary intervention efficacy across population subgroups.
Strengths and limitations
The major merit of this study is that it is the pioneering study to utilize a parametric g-formula for exploring the modifying effects of healthy dietary patterns on the associations between air pollutant mixtures and health risks. Additional strengths include the prospective design, a focus on various dietary patterns and multiple chronic diseases, the incorporation of time-varying air pollution and dietary data, an approximately 13-year follow-up period, and extensive food and nutrient intake information.
This study has several limitations. First, we used 24-h dietary data collected only from 2009 to 2012, which may not have captured changes in dietary intake during the follow-up period. Second, recall bias may exist in 24-h dietary recall surveys. Nevertheless, a parametric g-formula was conducted on individuals who completed 24-h dietary recall surveys from 2009 to 2010, 2011, and 2012 to minimize recall bias. Third, the reliability of the parametric g-formula hinges on the accurate specification of the parametric models. Incorrect model specifications may yield inaccurate results. However, comparable outcomes were attained in sensitivity analyses through the establishment of diverse covariate and outcome models, attesting to the robustness of our results. Fourth, potential measurement errors in identified confounders or the existence of unmeasured confounders could give rise to residual confounding. Fifth, our air pollution exposure estimation was based solely on participants’ residential addresses, neglecting their daily activity trajectories. Sixth, in the parametric g-formula approach, treating dietary pattern scores as continuous variables preserves information completeness and statistical power but may reduce the interpretability and generalizability of the effect estimates. Seventh, the selection of two percentile thresholds involves some arbitrariness. However, we assessed result robustness across alternative thresholds in sensitivity analyses. Eighth, voluntary (non-randomized) participation in repeated dietary assessments may introduce selection bias, although comparative analyses showed comparable air pollutant exposure profiles between completers and non-completers. Finally, primary care data cover only approximately 45% of the cohort and were last updated in 2017, potentially reducing the precision of exposure-outcome association estimates for several chronic diseases.
Conclusions
In conclusion, hypothetical interventions for improving adherence to healthy dietary patterns (particularly AMED, DDS, DAI, and E-DII) could reduce 13-year risks of air pollutant-linked chronic diseases and all-cause mortality, with maximal benefit at ‘the best adherence’. Our findings underscore the public health value of these diets for mitigating air pollution harms. Nevertheless, primary prevention must prioritize source-directed pollution reduction through stringent regulations, while future interventions should combine emission controls with structural dietary support to avoid exacerbating disparities in disproportionately exposed communities.
Data availability
The datasets generated and analyzed during the current study are available upon reasonable request to the Access Management System (AMS) through the UK Biobank website (https://www.ukbiobank.ac.uk/enable-your-research/apply-for-access).
Abbreviations
AHEI-2010:
Alternate healthy eating index-2010
AMED:
Alternate Mediterranean diet
BMI:
Body mass index
CIs:
Confidence intervals
CKD:
Chronic kidney disease
COPD:
Chronic obstructive pulmonary disease
CVD:
Cardiovascular disease
DAG:
Directed Acyclic Graph
DAI:
Dietary antioxidant index
DASH:
Dietary Approaches to Stop Hypertension
DDS:
Dietary diversity score
E-DII:
Energy-adjusted dietary inflammatory index
ELDI:
EAT-Lancet diet index
HLCD:
Healthy low-carbohydrate diet
HLFD:
Healthy low-fat diet
HPDI:
Healthy plant-based diet index
MIND:
Mediterranean-Dietary Approaches to Stop Hypertension Diet Intervention for Neurodegenerative Delay
HRs:
Hazard ratios
mvGPS:
Multivariate generalized propensity score
RD:
Risk rifference
SDs:
Standard deviations
References
- Institute for Health Metrics and Evaluation (IHME). Global Burden of Disease Study 2021 Results. Seattle: University of Washington; 2024. https://vizhub.healthdata.org/gbd-results.
- Zhu K, Li R, Yao P, Yu H, Pan A, Manson JE, et al. Proteomic signatures of healthy dietary patterns are associated with lower risks of major chronic diseases and mortality. Nat Food. 2024;6(1):47–57.
Article PubMed Google Scholar - GBD Europe Life Expectancy Collaborators. Changing life expectancy in European countries 1990–2021: a subanalysis of causes and risk factors from the Global Burden of Disease Study 2021. Lancet Public Health. 2025;10(3):e172–88.
Article Google Scholar - Liu S, Zhang Y, Ma R, Liu X, Liang J, Lin H, et al. Long-term exposure to ozone and cardiovascular mortality in a large Chinese cohort. Environ Int. 2022;165:107280.
Article PubMed CAS Google Scholar - Lin H, Liu T, Xiao J, Zeng W, Li X, Guo L, et al. Mortality burden of ambient fine particulate air pollution in six Chinese cities: results from the Pearl River Delta study. Environ Int. 2016;96:91–7.
Article PubMed Google Scholar - Chen G, Qian ZM, Zhang J, Wang X, Zhang Z, Cai M, et al. Associations between changes in exposure to air pollutants due to relocation and the incidence of 14 major disease categories and all-cause mortality: a natural experiment study. Environ Health Perspect. 2024;132(9):97012.
Article PubMed CAS Google Scholar - Xia X, Meng X, Liu C, Guo Y, Li X, Niu Y, et al. Associations of long-term nitrogen dioxide exposure with a wide spectrum of diseases: a prospective cohort study of 0.5 million Chinese adults. Lancet Public Health. 2024;9(12):e1047–58.
Article PubMed PubMed Central Google Scholar - GBD. Global incidence, prevalence, years lived with disability (YLDs), disability-adjusted life-years (DALYs), and healthy life expectancy (HALE) for 371 diseases and injuries in 204 countries and territories and 811 subnational locations, 1990–2021: a systematic analysis for the Global Burden of Disease Study 2021. Lancet. 2024;403(10440):2133–61.
Article Google Scholar - Bhatnagar A. Cardiovascular effects of particulate air pollution. Annu Rev Med. 2022;73:393–406.
Article PubMed CAS Google Scholar - Li S, Guo B, Dong K, Huang S, Wu J, Zhou H, et al. Association of long-term exposure to ambient PM2.5 and its constituents with gut microbiota: evidence from a China cohort. Sci Total Environ. 2023;884:163577.
Article PubMed CAS Google Scholar - Trichopoulou A, Costacou T, Bamia C, Trichopoulos D. Adherence to a Mediterranean diet and survival in a Greek population. N Engl J Med. 2003;348(26):2599–608.
Article PubMed Google Scholar - Wang T, Heianza Y, Sun D, Huang T, Ma W, Rimm EB, et al. Improving adherence to healthy dietary patterns, genetic risk, and long term weight gain: gene-diet interaction analysis in two prospective cohort studies. BMJ. 2018;360:j5644.
Article PubMed PubMed Central Google Scholar - Fung TT, Chiuve SE, McCullough ML, Rexrode KM, Logroscino G, Hu FB. Adherence to a DASH-style diet and risk of coronary heart disease and stroke in women. Arch Intern Med. 2008;168(7):713–20.
Article PubMed Google Scholar - Morris MC, Tangney CC, Wang Y, Sacks FM, Barnes LL, Bennett DA, et al. Mind diet slows cognitive decline with aging. Alzheimers Dement. 2015;11(9):1015–22.
Article PubMed Google Scholar - Kim H, Lee K, Rebholz CM, Kim J. Plant-based diets and incident metabolic syndrome: results from a South Korean prospective cohort study. PLoS Med. 2020;17(11):e1003371.
Article PubMed PubMed Central CAS Google Scholar - Stubbendorff A, Sonestedt E, Ramne S, Drake I, Hallstrom E, Ericson U. Development of an EAT-lancet index and its relation to mortality in a Swedish population. Am J Clin Nutr. 2022;115(3):705–16.
Article PubMed Google Scholar - Kant AK, TB SAH, RG Z, G B. Dietary diversity and subsequent mortality in the first national health and nutrition examination survey epidemiologic follow-up study. Am J Clin Nutr 1993;57:434–40.
- Wright ME, Mayne ST, Stolzenberg-Solomon RZ, Li Z, Pietinen P, Taylor PR, et al. Development of a comprehensive dietary antioxidant index and application to lung cancer risk in a cohort of male smokers. Am J Epidemiol. 2004;160(1):68–76.
Article PubMed Google Scholar - Shivappa N, Steck SE, Hurley TG, Hussey JR, Hebert JR. Designing and developing a literature-derived, population-based dietary inflammatory index. Public Health Nutr. 2014;17(8):1689–96.
Article PubMed Google Scholar - Shan Z, Guo Y, Hu FB, Liu L, Qi Q. Association of low-carbohydrate and low-fat diets with mortality among US adults. JAMA Intern Med. 2020;180(4):513–23.
Article PubMed PubMed Central CAS Google Scholar - Halton TL, Willett WC, Liu S, Manson JAE, Albert CM, Rexrode K, et al. Lowcarbohydrate-diet score and the risk of coronary heart disease in women. New Engl J Med. 2006;355(19):1991–2002.
- Zhang S, Dukuzimana J, Stubbendorff A, Ericson U, Borne Y, Sonestedt E. Adherence to the EAT-Lancet diet and risk of coronary events in the Malmo Diet and Cancer cohort study. Am J Clin Nutr. 2023;117(5):903–9.
Article PubMed CAS Google Scholar - Xiao C, Wang JT, Su C, Miao Z, Tang J, Ouyang Y, et al. Associations of dietary diversity with the gut microbiome, fecal metabolites, and host metabolism: results from 2 prospective Chinese cohorts. Am J Clin Nutr. 2022;116(4):1049–58.
Article PubMed PubMed Central Google Scholar - Mendes FC, Paciencia I, Cavaleiro Rufo J, Silva D, Cunha P, Farraia M, et al. The inflammatory potential of diet impacts the association between air pollution and childhood asthma. Pediatr Allergy Immunol. 2020;31(3):290–6.
Article Google Scholar - Lim CC, Hayes RB, Ahn J, Shao Y, Silverman DT, Jones RR, et al. Mediterranean diet and the association between air pollution and cardiovascular disease mortality risk. Circulation. 2019;139(15):1766–75.
Article PubMed PubMed Central CAS Google Scholar - Zhu A, Chen H, Shen J, Wang X, Li Z, Zhao A, et al. Interaction between plant-based dietary pattern and air pollution on cognitive function: a prospective cohort analysis of Chinese older adults. Lancet Reg Health. 2022;20:100372.
Google Scholar - Chen C, Hayden KM, Kaufman JD, Espeland MA, Whitsel EA, Serre ML, et al. Adherence to a MIND-like dietary pattern, long-term exposure to fine particulate matter air pollution, and MRI-based measures of brain volume: the women’s health initiative memory study-MRI. Environ Health Perspect. 2021;129(12):127008.
Article PubMed PubMed Central Google Scholar - Zhang H, Xia Y, Chang Q, Gao S, Zhao Y. Dietary patterns and associations between air pollution and gestational diabetes mellitus. Environ Int. 2021;147:106347.
Article CAS Google Scholar - Huang K, Yu D, Fang H, Ju L, Piao W, Guo Q, et al. Association of fine particulate matter and its constituents with hypertension: the modifying effect of dietary patterns. Environ Health. 2023;22(1):55.
Article PubMed PubMed Central CAS Google Scholar - Naimi AI, Cole SR, Kennedy EH. An introduction to g methods. Int J Epidemiol. 2017;46(2):756–62.
PubMed Google Scholar - Breskin A, Edmonds A, Cole SR, Westreich D, Cocohoba J, Cohen MH, et al. G-computation for policy-relevant effects of interventions on time-to-event outcomes. Int J Epidemiol. 2021;49(6):2021–9.
Article PubMed Google Scholar - McGrath S, Lin V, Zhang Z, Petito LC, Logan RW, Hernan MA, et al. Gformula: an R package for estimating the effects of sustained treatment strategies via the parametric g-formula. Patterns. 2020;1(3):100008.
Article PubMed PubMed Central CAS Google Scholar - Leung M, Weisskopf MG, Modest AM, Hacker MR, Iyer HS, Hart JE, et al. Using parametric g-computation for time-to-event data and distributed lag models to identify critical exposure windows for preterm birth: an illustrative example using PM2.5 in a retrospective birth cohort based in eastern Massachusetts (2011–2016). Environ Health Perspect. 2024;132(7):77002.
Article PubMed CAS Google Scholar - Chen C, Chen H, van Donkelaar A, Burnett RT, Martin RV, Chen L, et al. Using parametric g-computation to estimate the effect of long-term exposure to air pollution on mortality risk and simulate the benefits of hypothetical policies: the Canadian Community Health Survey Cohort (2005 to 2015). Environ Health Perspect. 2023;131(3):37010.
Article PubMed Google Scholar - Sudlow C, Gallacher J, Allen N, Beral V, Burton P, Danesh J, et al. UK biobank: an open access resource for identifying the causes of a wide range of complex diseases of middle and old age. PLoS Med. 2015;12(3):e1001779.
Article PubMed PubMed Central Google Scholar - Heianza Y, Zhou T, Sun D, Hu FB, Manson JE, Qi L. Genetic susceptibility, plant-based dietary patterns, and risk of cardiovascular disease. Am J Clin Nutr. 2020;112(1):220–8.
Article PubMed PubMed Central CAS Google Scholar - Wu Y, Zhang S, Qian SE, Cai M, Li H, Wang C, et al. Ambient air pollution associated with incidence and dynamic progression of type 2 diabetes: a trajectory analysis of a population-based cohort. BMC Med. 2022;20(1):375.
Article PubMed PubMed Central CAS Google Scholar - Cai M, Zhang S, Lin X, Qian Z, McMillin SE, Yang Y, et al. Association of ambient particulate matter pollution of different sizes with in-hospital case fatality among stroke patients in China. Neurology. 2022;98(24):e2474-86.
Article PubMed CAS Google Scholar - Brook RD, Rajagopalan S, Pope CA 3rd, Brook JR, Bhatnagar A, Diez-Roux AV, et al. Particulate matter air pollution and cardiovascular disease: an update to the scientific statement from the American Heart Association. Circulation. 2010;121(21):2331–78.
- Puett RC, Hart JE, Schwartz J, Hu FB, Liese AD, Laden F. Are particulate matter exposures associated with risk of type 2 diabetes? Environ Health Perspect. 2011;119(3):384–9.
Article PubMed Google Scholar - Huang K, Liang F, Yang X, Liu F, Li J, Xiao Q, et al. Long term exposure to ambient fine particulate matter and incidence of stroke: prospective cohort study from the China-PAR project. BMJ. 2019;367:l6720.
Article PubMed PubMed Central Google Scholar - Shang X, Liu J, Zhu Z, Zhang X, Huang Y, Liu S, et al. Healthy dietary patterns and the risk of individual chronic diseases in community-dwelling adults. Nat Commun. 2023;14(1):6704.
Article PubMed PubMed Central CAS Google Scholar - Brayner B, Perez-Cornago A, Kaur G, Keske MA, Piernas C, Livingstone KM. Cross-sectional associations of dietary patterns characterized by fat type with markers of cardiometabolic health. Nutr Metab Cardiovasc Dis. 2023;33(4):797–808.
Article PubMed CAS Google Scholar - Willett W, Rockstrom J, Loken B, Springmann M, Lang T, Vermeulen S, et al. Food in the anthropocene: the EAT-lancet commission on healthy diets from sustainable food systems. Lancet. 2019;393(10170):447–92.
Article PubMed Google Scholar - Callmer E, Riboli E, Saracci R, Akesson B, Lindgarde F. Dietary assessment methods evaluated in the Malmo food study. J Intern Med. 1993;233(1):53–7.
Article PubMed CAS Google Scholar - Zhang S, Stubbendorff A, Olsson K, Ericson U, Niu K, Qi L, et al. Adherence to the EAT-Lancet diet, genetic susceptibility, and risk of type 2 diabetes in Swedish adults. Metabolism. 2023;141:155401.
Article PubMed CAS Google Scholar - van den Brink AC, Brouwer-Brolsma EM, Berendsen AAM, van de Rest O. The Mediterranean, Dietary Approaches to Stop Hypertension (DASH), and Mediterranean-DASH Intervention for Neurodegenerative Delay (MIND) diets are associated with less cognitive decline and a lower risk of Alzheimer’s dsease-a review. Adv Nutr. 2019;10(6):1040–65.
Article PubMed PubMed Central Google Scholar - Perez-Cornago A, Pollard Z, Young H, van Uden M, Andrews C, Piernas C, et al. Description of the updated nutrition calculation of the Oxford WebQ questionnaire and comparison with the previous version among 207,144 participants in UK Biobank. Eur J Nutr. 2021;60(7):4019–30.
Article PubMed PubMed Central CAS Google Scholar - Willett WC, Howe GR, Kushi LH. Adjustment fortotal energy intakein epidemiologic studies. Am J Clin Nutr. 1997;65:1220S-1228S.
Article PubMed CAS Google Scholar - Akter S, Mizoue T, Nanri A, Goto A, Noda M, Sawada N, et al. Low carbohydrate diet and all cause and cause-specific mortality. Clin Nutr. 2021;40(4):2016–24.
Article PubMed CAS Google Scholar - Blazek K, van Zwieten A, Saglimbene V, Teixeira-Pinto A. A practical guide to multiple imputation of missing data in nephrology. Kidney Int. 2021;99(1):68–74.
Article PubMed Google Scholar - Gray L, McCartney G, White IR, Katikireddi SV, Rutherford L, Gorman E, et al. Use of record-linkage to handle non-response and improve alcohol consumption estimates in health survey data: a study protocol. BMJ Open. 2013;3(3):e002647.
Article PubMed PubMed Central Google Scholar - Keil AP, Buckley JP, O’Brien KM, Ferguson KK, Zhao S, White AJ. A quantile-based g-computation approach to addressing the effects of exposure mixtures. Environ Health Perspect. 2020;128(4):47004.
Article PubMed Google Scholar - Schmidt S. Quantile g-computation: a new method for analyzing mixtures of environmental exposures. Environ Health Perspect. 2020;128(10):104004.
Article PubMed PubMed Central Google Scholar - Traini E, Huss A, Portengen L, Rookus M, Verschuren WMM, Vermeulen RCH, et al. A multipollutant approach to estimating causal effects of air pollution mixtures on overall mortality in a large, prospective cohort. Epidemiology. 2022;33(4):514–22.
Article PubMed PubMed Central Google Scholar - Egger PH, von Ehrlich M. Generalized propensity scores for multiple continuous treatment variables. Econ Lett. 2013;119(1):32–4.
- Feng J, Cai M, Qian ZM, Zhang S, Yang Y, McMillin SE, et al. The effects of long-term exposure to air pollution on incident mental disorders among patients with prediabetes and diabetes: Findings from a large prospective cohort. Sci Total Environ. 2023;897:165235.
Article PubMed PubMed Central CAS Google Scholar - Stafoggia M, Analitis A, Chen J, Rodopoulou S, Brunekreef B, Hoek G, et al. Comparing “causa” and “traditional” approaches in the association of long-term exposure to ambient air pollution on mortality: How sensitive are the results? Environ Int. 2023;174:107872.
Article PubMed CAS Google Scholar - Robins J. A new approach to causal inference in mortality studies with a sustained exposure period—application to control of the healthy worker survivor effect. Math Model. 1986;7:1393–512.
Article Google Scholar - Cadena EM, Gallo I, Soto VE. Reformulation of ultra-processed products in Colombia after the introduction of public health regulations. BMC Med. 2025;23(1):446.
Article PubMed PubMed Central Google Scholar - Letellier N, Gutierrez LA, Duchesne J, Chen C, Ilango S, Helmer C, et al. Air quality improvement and incident dementia: effects of observed and hypothetical reductions in air pollutant using parametric g-computation. Alzheimers Dement. 2022;18(12):2509–17.
Article PubMed Google Scholar - Bassett DR Jr. International physical activity questionnaire: 12-country reliability and validity. Med Sci Sports Exerc. 2003;35(8):1396.
Article PubMed Google Scholar - Madjedi KM, Stuart KV, Chua SYL, Ramulu PY, Warwick A, Luben RN, et al. The association of physical activity with glaucoma and related traits in the UK Biobank. Ophthalmology. 2023;130(10):1024–36.
Article PubMed Google Scholar - Traversy G, Chaput J-P. Alcohol consumption and obesity: an update. Curr Obes Rep. 2015;4(1):122–30.
Article PubMed PubMed Central Google Scholar - Desapriya EBR, Stockwell T, Doll SR, Room R. International guide for monitoring alcohol consumption and related harm. Geneva: World Health Organization; 2000. https://iris.who.int/server/api/core/bitstreams/103a29f4-dc51-464d-b6ef-5948c312ae6c/content.
- Zheng G, Xia H, Shi H, Zheng D, Wang X, Ai B, et al. Effect modification of dietary diversity on the association of air pollution with incidence, complications, and mortality of type 2 diabetes: Results from a large prospective cohort study. Sci Total Environ. 2023;908:168314.
Article PubMed Google Scholar - Li X, Wang M, Song Y, Ma H, Zhou T, Liang Z, et al. Obesity and the relation between joint exposure to ambient air pollutants and incident type 2 diabetes: a cohort study in UK Biobank. PLoS Med. 2021;18(8):e1003767.
Article PubMed PubMed Central CAS Google Scholar - Wang M, Zhou T, Song Y, Li X, Ma H, Hu Y, et al. Joint exposure to various ambient air pollutants and incident heart failure: a prospective analysis in UK Biobank. Eur Heart J. 2021;42(16):1582–91.
Article PubMed PubMed Central CAS Google Scholar - Kim SR, Choi S, Kim K, Chang J, Kim SM, Cho Y, et al. Association of the combined effects of air pollution and changes in physical activity with cardiovascular disease in young adults. Eur Heart J. 2021;42(25):2487–97.
Article PubMed CAS Google Scholar - Chen G, Wang A, Li S, Zhao X, Wang Y, Li H, et al. Long-term exposure to air pollution and survival after ischemic stroke. Stroke. 2019;50(3):563–70.
Article PubMed PubMed Central Google Scholar - Wu X, Liu X, Liao W, Dong X, Li R, Hou J, et al. Healthier lifestyles attenuated association of single or mixture exposure to air pollutants with cardiometabolic risk in rural Chinese adults. Toxics. 2022;10(9):541.
Article PubMed PubMed Central CAS Google Scholar - Zare Sakhvidi MJ, Lequy E, Goldberg M, Jacquemin B. Air pollution exposure and bladder, kidney and urinary tract cancer risk: a systematic review. Environ Pollut. 2020;267:115328.
Article PubMed CAS Google Scholar - Li J, Deng Z, Soerensen SJC, Kachuri L, Cardenas A, Graff RE, et al. Ambient air pollution and urological cancer risk: a systematic review and meta-analysis of epidemiological evidence. Nat Commun. 2024;15(1):5116.
Article PubMed PubMed Central CAS Google Scholar - Wilker EH, Osman M, Weisskopf MG. Ambient air pollution and clinical dementia: systematic review and meta-analysis. BMJ. 2023;381:e071620.
Article PubMed PubMed Central CAS Google Scholar - Zhang B, Weuve J, Langa KM, D’Souza J, Szpiro A, Faul J, et al. Comparison of particulate air pollution from different emission sources and incident dementia in the US. JAMA Intern Med. 2023;183(10):1080–9.
Article PubMed PubMed Central CAS Google Scholar - Bowe B, Xie Y, Li T, Yan Y, Xian H, Al-Aly Z. Particulate matter air pollution and the risk of incident CKD and progression to ESRD. J Am Soc Nephrol. 2018;29(1):218–30.
Article PubMed CAS Google Scholar - Liang Z, Wang W, Wang Y, Ma L, Liang C, Li P, et al. Urbanization, ambient air pollution, and prevalence of chronic kidney disease: a nationwide cross-sectional study. Environ Int. 2021;156:106752.
Article PubMed CAS Google Scholar - Doiron D, de Hoogh K, Probst-Hensch N, Fortier I, Cai Y, De Matteis S, et al. Air pollution, lung function and COPD: results from the population-based UK Biobank study. Eur Respir J. 2019;54(1):1802140.
Article PubMed CAS Google Scholar - Wang X, Chen L, Cai M, Tian F, Zou H, Qian ZM, et al. Air pollution associated with incidence and progression trajectory of chronic lung diseases: a population-based cohort study. Thorax. 2023;78(7):698–705.
Article PubMed Google Scholar - Liu C, Chen R, Sera F, Vicedo-Cabrera AM, Guo Y, Tong S, et al. Ambient particulate air pollution and daily mortality in 652 cities. N Engl J Med. 2019;381(8):705–15.
Article PubMed PubMed Central CAS Google Scholar - Chen R, Yin P, Meng X, Liu C, Wang L, Xu X, et al. Fine particulate air pollution and daily mortality: a nationwide analysis in 272 Chinese cities. Am J Respir Crit Care Med. 2017;196(1):73–81.
Article PubMed CAS Google Scholar - Hussain R, Graham U, Elder A, Nedergaard M. Air pollution, glymphatic impairment, and Alzheimer’s disease. Trends Neurosci. 2023;46(11):901–11.
Article PubMed PubMed Central CAS Google Scholar - Jiang Z, Zhang S, Chen K, Wu Y, Zeng P, Wang T. Long-term influence of air pollutants on morbidity and all-cause mortality of cardiometabolic multi-morbidity: A cohort analysis of the UK Biobank participants. Environ Res. 2023;237(Pt 1):116873.
Article PubMed CAS Google Scholar - Luo H, Zhang Q, Yu K, Meng X, Kan H, Chen R. Long-term exposure to ambient air pollution is a risk factor for trajectory of cardiometabolic multimorbidity: a prospective study in the UK biobank. EBioMedicine. 2022;84:104282.
Article PubMed PubMed Central CAS Google Scholar - Zheng Y, Zhong X, Peng W, Chen Z, Wang L, Xia C, et al. Associations of prenatal exposures to fine particulate matter and its compositions with preterm birth risk in twins. Green Health. 2025;1(2):11.
Article Google Scholar - Zu P, Zhou L, Yin W, Zhang L, Wang H, Xu J, et al. Association between exposure to air pollution during preconception and risk of gestational diabetes mellitus: the role of anti-inflammatory diet. Environ Res. 2023;235:116561.
Article PubMed CAS Google Scholar - Buxton MA, Perng W, Tellez-Rojo MM, Rodriguez-Carmona Y, Cantoral A, Sanchez BN, et al. Particulate matter exposure, dietary inflammatory index and preterm birth in Mexico city, Mexico. Environ Res. 2020;189:109852.
Article PubMed PubMed Central CAS Google Scholar - Farrokhyar F, Skorzewski P, Phillips MR, Garg SJ, Sarraf D, Thabane L, et al. When to believe a subgroup analysis: revisiting the 11 criteria. Eye (Lond). 2022;36(11):2075–7.
Article PubMed Google Scholar - Richardson M, Garner P, Donegan S. Interpretation of subgroup analyses in systematic reviews: a tutorial. Clin Epidemiol Global Health. 2019;7(2):192–8.
Article Google Scholar - Choi JH, Cho YJ, Kim HJ, Ko SH, Chon S, Kang JH, et al. Effect of carbohydrate-restricted diets and intermittent fasting on obesity, type 2 diabetes mellitus, and hypertension management: consensus statement of the Korean society for the study of obesity, Korean diabetes association, and Korean society of hypertension. Diabetes Metab J. 2022;46(3):355–76.
Article PubMed PubMed Central Google Scholar - Yokose C, McCormick N, Rai SK, Lu N, Curhan G, Schwarzfuchs D, et al. Effects of low-fat, mediterranean, or low-carbohydrate weight loss diets on serum urate and cardiometabolic risk factors: a secondary analysis of the dietary intervention randomized controlled trial (DIRECT). Diabetes Care. 2020;43(11):2812–20.
Article PubMed PubMed Central CAS Google Scholar - Willems AEM, Sura-de Jong M, van Beek AP, Nederhof E, van Dijk G. Effects of macronutrient intake in obesity: a meta-analysis of low-carbohydrate and low-fat diets on markers of the metabolic syndrome. Nutr Rev. 2021;79(4):429–44.
Article PubMed Google Scholar - Tan LJ, Kim SA, Shin S. Association between three low-carbohydrate diet scores and lipid metabolism among Chinese adults. Nutrients. 2020;12(5):1307.
Article PubMed PubMed Central CAS Google Scholar - Kim SA, Lim K, Shin S. Associations between low-carbohydrate diets from animal and plant sources and dyslipidemia among Korean adults. J Acad Nutr Diet. 2019;119(12):2041–54.
Article PubMed Google Scholar - Sievenpiper JL. Low-carbohydrate diets and cardiometabolic health: the importance of carbohydrate quality over quantity. Nutr Rev. 2020;78(Suppl 1):69–77.
Article PubMed PubMed Central Google Scholar - Barber TM, Hanson P, Kabisch S, Pfeiffer AFH, Weickert MO. The low-carbohydrate diet: short-term metabolic efficacy versus longer-term limitations. Nutrients. 2021;13(4):1187.
Article PubMed PubMed Central CAS Google Scholar - Chen H, Quick M, Kaufman JS, Chen C, Kwong JC, van Donkelaar A, et al. Impact of lowering fine particulate matter from major emission sources on mortality in Canada: a nationwide causal analysis. Proc Natl Acad Sci U S A. 2022;119(49):e2209490119.
Article PubMed PubMed Central CAS Google Scholar - Stensrud MJ, Hernan MA. Why test for proportional hazards? JAMA. 2020;323(14):1401–2.
Article PubMed PubMed Central Google Scholar - Zhang Q, Du X, Li H, Jiang Y, Zhu X, Zhang Y, et al. Cardiovascular effects of traffic-related air pollution: a multi-omics analysis from a randomized, crossover trial. J Hazard Mater. 2022;435:129031.
Article PubMed CAS Google Scholar - Wu Y, Gasevic D, Wen B, Yu P, Xu R, Zhou G, et al. Association between air pollution and telomere length: a study of 471,808 UK Biobank participants. The Innovation Medicine. 2023;1(2):100017.
Article CAS Google Scholar - Bernstein MA, Tucker KL, Ryan ND, O’Neill EF, Clements KM, ME N. Higher dietary variety is associated with better nutritional status in frail elderly people. J Am Diet Assoc. 2002;102(8):1096–104.
Article PubMed Google Scholar - Nettleton JA, McKeown NM, Kanoni S, Lemaitre RN, Hivert MF, Ngwa J, et al. Interactions of dietary whole-grain intake with fasting glucose- and insulin-related genetic loci in individuals of European descent: a meta-analysis of 14 cohort studies. Diabetes Care. 2010;33(12):2684–91.
Article PubMed PubMed Central Google Scholar - Ley SH, Hamdy O, Mohan V, Hu FB. Prevention and management of type 2 diabetes: dietary components and nutritional strategies. Lancet. 2014;383(9933):1999–2007.
Article PubMed PubMed Central CAS Google Scholar - Di Angelantonio E, Kaptoge S, Wormser D, Willeit P, Butterworth AS, Bansal N, et al. Association of cardiometabolic multimorbidity with mortality. JAMA. 2015;314(1):52–60.
Article PubMed CAS Google Scholar - Abe SK, Saito E, Sawada N, Tsugane S, Ito H, Lin Y, et al. Green tea consumption and mortality in Japanese men and women: a pooled analysis of eight population-based cohort studies in Japan. Eur J Epidemiol. 2019;34(10):917–26.
Article PubMed CAS Google Scholar
Acknowledgements
This research used the UK Biobank Resource, which was approved under Application Number 69550. The authors appreciate all UK Biobank participants and all staff for their contribution to these studies.
Funding
This work was supported by research grants from the State Key Research and Development Program of China (grant number 2022YFC2305305), the National Natural Science Foundation of China (grant number 82373534), and the Science and Technology Planning Project of Guangdong.
Author information
Author notes
- Guzhengyue Zheng and Lan Chen contributed equally to this work.
Authors and Affiliations
- School of Medicine, Xizang Minzu University, Xianyang, 712082, China
Guzhengyue Zheng - Department of Epidemiology, School of Public Health, Sun Yat-Sen University, Guangzhou, 510080, China
Lan Chen, Shanshan Ran, Shengtao Wei, Hui Shi, Peng Hu, Ge Chen & Hualiang Lin - JC School of Public Health and Primary Care, The Chinese University of Hong Kong, Shatin, New Territories, Hong Kong SAR, 999077, China
Kin Fai Ho - Department of Geriatric Medicine, Affiliated Nanshan Hospital of Shenzhen University, Shenzhen, 518051, China
Zhenhe Huang
Authors
- Guzhengyue Zheng
- Lan Chen
- Shanshan Ran
- Shengtao Wei
- Kin Fai Ho
- Zhenhe Huang
- Hui Shi
- Peng Hu
- Ge Chen
- Hualiang Lin
Contributions
Guzhengyue Zheng: conceptualization, methodology, formal analysis, writing–original draft, and writing–review & editing; Lan Chen: writing–review & editing; Shanshan Ran: methodology and software; Shengtao Wei: software and data curation; Kin Fai HO: writing–review & editing; Zhenhe Huang: writing–review & editing; Hui Shi: software and data curation; Peng Hu: conceptualization and methodology; Ge Chen: writing–review & editing; Hualiang Lin: writing–review & editing, resources, conceptualization, supervision, data curation, and project management. All authors have read and approved the final manuscript.
Corresponding author
Correspondence toHualiang Lin.
Ethics declarations
Ethics approval and consent to participate
The project has approval from the North West Multi-Centre Research Ethics Committee (MREC) (REC reference: 11/NW/0382).
Consent for publication
Not applicable.
Competing interests
The authors declare no competing interests.
Additional information
Publisher’s Note
Springer Nature remains neutral with regard to jurisdictional claims in published maps and institutional affiliations.
Supplementary Information
12916_2025_4489_MOESM1_ESM.docx
Additional file 1: Method S1. Air pollution exposure assessment. Method S2. Assessment of dietary pattern scores. Method S3. Multiple imputation details. Method S4. Quantile g-computation and mvGPS model fitting procedures. Method S5. Counterfactual scenario specifications. Method S6. Parametric g-formula assumption validation. Method S7. Covariate assessment methodology. Method S8. Covariate and outcome model specifications. Table S1. Handling of air pollution and dietary exposures under four intervention strategies. Table S2. Specific interventions for each dietary pattern. Table S3. List of covariates included. Table S4–S9. Baseline characteristics by chronic disease status. Table S10. Air pollutant exposure comparison between dietary assessment completers and non-completers. Table S11. Air pollution mixture associations with chronic disease risk. Table S12–S14. The 13-year cumulative risks under different dietary pattern interventions. Table S15–S20. Sensitivity analyses adjusting for time-varying covariates. Table S21–S23. Sensitivity analyses with alternative percentile thresholds. Table S24–S26. Sensitivity analyses with increased Monte Carlo simulations. Fig. S1. Study population flowchart for air pollution-health outcome analysis. Fig. S2. Participant inclusion flowchart for g-formula analysis. Fig. S3-S4. Minimal adjustment sets diagrams. Fig. S5. Annual trends of six air pollutants. Fig. S6. Correlation matrix of eleven dietary pattern scores. Fig. S7. Cumulative incidence curves: simulated natural course vs observed data. Fig. S8–S18. Annual cumulative incidence risk differences under dietary interventions vs natural course
Rights and permissions
Open Access This article is licensed under a Creative Commons Attribution-NonCommercial-NoDerivatives 4.0 International License, which permits any non-commercial use, sharing, distribution and reproduction in any medium or format, as long as you give appropriate credit to the original author(s) and the source, provide a link to the Creative Commons licence, and indicate if you modified the licensed material. You do not have permission under this licence to share adapted material derived from this article or parts of it. The images or other third party material in this article are included in the article’s Creative Commons licence, unless indicated otherwise in a credit line to the material. If material is not included in the article’s Creative Commons licence and your intended use is not permitted by statutory regulation or exceeds the permitted use, you will need to obtain permission directly from the copyright holder. To view a copy of this licence, visit http://creativecommons.org/licenses/by-nc-nd/4.0/.
About this article
Cite this article
Zheng, G., Chen, L., Ran, S. et al. A hypothetical intervention analysis for the effects of healthy dietary patterns on reducing major chronic diseases and mortality associated with air pollutant mixtures.BMC Med 23, 655 (2025). https://doi.org/10.1186/s12916-025-04489-x
- Received: 17 June 2025
- Accepted: 28 October 2025
- Published: 24 November 2025
- Version of record: 24 November 2025
- DOI: https://doi.org/10.1186/s12916-025-04489-x