A contrast‑enhanced CT histogram‑driven nomogram for predicting post‑radiotherapy liver regeneration in hepatocellular carcinoma (original) (raw)
Background
Hepatocellular carcinoma (HCC) remains a leading cause of cancer-related mortality worldwide [1]. Radical hepatic resection is the standard curative treatment for early-stage HCC; however, many patients present with high-risk pathological features such as narrow surgical margins (< 1 cm) or microvascular invasion (MVI) [2, 3]. Even after R0 resection, the 5-year progression-free survival (PFS) in these patients is typically below 40% [4].
Radiotherapy(RT) is increasingly recognized as a cornerstone treatment for advanced HCC [5, 6]. For postoperative high-risk patients, adjuvant RT improves local control and survival by addressing residual microscopic disease [5, 7].Among RT modalities, stereotactic body radiotherapy (SBRT) and brachytherapy are effective for small or recurrent liver lesions, yet their applicability in the postoperative setting is limited [8,9,10]. In this context, intensity-modulated radiotherapy (IMRT) has emerged as the preferred adjuvant approach, offering superior dose conformity that ensures adequate coverage of tumor beds with narrow margins or microvascular invasion [5, 11]. However, RT-related hepatic decompensation occurs in approximately 20% of patients, which substantially impairs liver regeneration (LR) [5, 12, 13]. In addition, extensive hepatic resection and surgical trauma further compromise regenerative capacity after curative hepatectomy [14,15,16]. Therefore, accurate evaluation of LR potential following IMRT is essential to balance oncologic control with preservation of hepatic function. However, conventional methods for evaluating LR are often inadequate. Volumetric imaging usually lags behind true physiological recovery [17]; Invasive assays such as Ki-67 staining are also impractical in patients with cirrhosis or thrombocytopenia, and they are unsuitable for longitudinal monitoring [18].
Recent advances in imaging technologies have shown promise in evaluating liver function and regeneration [19]. The iodine washout rate (IWR) derived from multiphasic liver CT can effectively identify patients with significant hepatic dysfunction (ICG-R15 ≥ 20%), demonstrating superior accuracy compared to extracellular volume (ECV) fraction and liver-spleen volume parameters [20]. Gadolinium-ethoxybenzyl-diethylenetriamine pentaacetic acid (Gd-EOB-DTPA)-enhanced magnetic resonance imaging (MRI) combined with T1 mapping enables quantitative assessment of hepatic functional reserve and regenerative capacity [21]. Preoperative computed tomography (CT) texture analysis integrated with clinical parameters has also been used to predict liver regeneration after right hepatectomy in patients with HCC [22]. However, whether histogram-based features derived from contrast‑enhanced CT (CE-CT) can be used to evaluate LR in HCC patients following IMRT remains unclear.
To address this gap, this multicenter retrospective study analyzed clinical data from 315 HCC patients who underwent postoperative adjuvant IMRT. Histogram-based features from pre-IMRT portal venous phase CE-CT images, combined with clinical parameters, were used to develop and validate a predictive model for liver regeneration. The model aims to support individualized IMRT planning by balancing oncologic efficacy with preservation of hepatic function.
Methods
Patient inclusion
This study complied with the Declaration of Helsinki and was approved by the Institutional Ethics Committee (approval no. 2025 A-539), with informed consent waived. We retrospectively collected data from 315 pathologically confirmed HCC patients treated between January 2019 and June 2024 at three centers: Center 1 served as the training cohort (n = 139), Center 2 as validation cohort 1 (n = 91), and Center 3 as validation cohort 2 (n = 85). Inclusion criteria were: (1) age 18–80 years; (2) resectable HCC classified as BCLC stage 0/A/B; (3) confirmed narrow surgical margin (< 1 cm) or pathological evidence of MVI by surgical and pathological reports; (4) receipt of and tolerance to complete adjuvant RT 4–6 weeks postoperatively; and (5) Availability of high-quality CE-CT imaging both prior to and within one year following adjuvant RT. Exclusion criteria were: (1) history or presence of other malignancies; (2) preoperative major vascular invasion or extrahepatic metastasis; (3) prior HCC‑specific treatments; (4)palliative resection with residual tumor, tumor progression within one year post‑RT; and (5) Patients were excluded if they had incomplete clinical data or if their pre-RT contrast-enhanced CT scans exhibited any of the following: Artifacts that significantly impaired image quality; Inadequate contrast enhancement༛Non-standard imaging protocols. These criteria were assessed by two experienced radiologists, and any discrepancies were resolved through consensus.
During postoperative RT follow-up, remnant liver volume (RLV) was assessed using CE-CT scans. The imaging protocol included portal venous phase CE-CT scans acquired both prior to RT and within one-year post-RT. These scans were obtained using a standardized protocol with a slice thickness of ≤ 5 mm to ensure high-resolution images suitable for volumetric analysis. Volumetric analysis was performed using dedicated imaging software, which allowed for semi-automated segmentation of the liver parenchyma. The software facilitated the delineation of liver contours on each axial slice, excluding vascular structures and biliary ducts, to calculate the total liver volume [23].
In accordance with previously published prospective studies [24], we defined effective liver regeneration (ELR) as a relative increase of 10% or more in residual liver volume (RLV) within one year after RT. This threshold was originally proposed by Su et al. [17], where a 10% increase in liver volume approximated the median volumetric change observed in the study cohort. In the present analysis, patients who experienced tumor progression within one year following RT were excluded from the LR assessment to minimize potential confounding effects and to align with the anticipated physiological trajectory of hepatic regeneration.
Data collection – variable definitions
In this study, we collected clinical, laboratory, imaging, and histopathological data to assess hepatic function, regenerative potential, and inflammatory status. Key demographic data included age, sex (male/female), body mass index (BMI), hepatitis virus status (positive/negative), and Barcelona Clinic Liver Cancer (BCLC) stage.Pre-IMRT laboratory indices were computed as follows: Systemic Immune‑Inflammation Index (SII) = platelet count × neutrophil count / lymphocyte count; neutrophil-to-lymphocyte ratio (NLR) = neutrophils / lymphocytes; platelet-to-lymphocyte ratio (PLR) = platelets / lymphocytes; Model for End-Stage Liver Disease (MELD) = 3.78 × ln[total bilirubin (mg/dL)] + 11.2 × ln[INR] + 9.57 × ln[creatinine (mg/dL)] + 6.43; Albumin–Bilirubin (ALBI) score = 0.66 × log₁₀[total bilirubin (µmol/L)] − 0.085 × albumin (g/L); Fibrosis-4 (FIB-4) index = [age (years) × AST (IU/L)] / [platelet count × √ALT (IU/L)]. Child-Pugh class (A/B) was assigned according to standard criteria. Pre-IMRT histopathological data were categorized according to the New Inuyama Classification, which grades necroinflammatory activity from A0 (none) to A3 (severe) and fibrosis stage from F0 (none) to F4 (cirrhosis) [25]. Dosimetric and volumetric parameters: Mean liver dose (Liver-Dmean) was the mean dose to the contoured whole liver (Gy) reported by the treatment-planning system, RLV, Body surface area (BSA) was calculated by the DuBois formula [BSA (m²) = 0.007184 × weight (kg)^0.425 × height (cm)^0.725], and standard remnant liver volume (SRLV) was computed as SRLV = RLV / BSA (mL/m²). Future liver volume after IMRT (FLVFU) was defined as the maximum remnant liver volume measured on follow-up CE-CT within 1 year after adjuvant IMRT, and the regenerative index (RI) was calculated as RI = (FLVFU − RLV) / RLV × 100%. Detailed definitions, calculation formulas, and grading criteria are provided in Supplementary Materials Table S1.
Adjuvant IMRT for HCC: target volume delineation and dose prescription
All patients received adjuvant IMRT within 4–6 weeks postoperatively. Target delineation was primarily based on CE-CT, which served as the standardized imaging modality across participating centers. Target volumes were defined based on the tumor bed and adjusted to account for surgical changes, organ motion, and surrounding gastrointestinal structures. IMRT was delivered in 20–25 fractions, with a total dose ranging from 50 to 60 Gy, depending on individual risk assessment and anatomical proximity to critical organs. The detailed protocol is provided in Supplementary Materials Method 1.
CE-CT scanning protocol
The CE-CT protocol was implemented using GE Discovery CT750 HD, GE Revolution CT, or Philips Brilliance iCT 256-slice scanners. Patients were instructed to fast for 4–6 h prior to the examination and to consume 500 mL of water within 30 min before scanning to ensure adequate gastric distension. Positioned supine with arms elevated, patients underwent scanning from the diaphragm to the symphysis pubis. Scanning parameters included a tube voltage of 120 kVp and an automatic tube current modulation ranging from 100 to 600 mA. The collimation width was set at 0.625 mm, with a gantry rotation time of 0.6 s per rotation and a pitch of 0.983. Images were reconstructed with a slice thickness and interval of 1.25 mm, utilizing a 512 × 512 matrix and a field of view (FOV) adjusted between 35 and 40 cm based on patient size.For contrast enhancement, nonionic iodinated contrast agents (e.g., iohexol or iopromide at 320–350 mg I/mL) were administered intravenously via the antecubital vein using a power injector. The injection rate was maintained at 3.5–4.0 mL/s, with a total volume of 1.2 mL/kg body weight, followed by a 20–30 mL saline flush to ensure optimal vascular opacification. Subsequent imaging phases were acquired at specific intervals: the arterial phase at an 8-second delay post-threshold, the portal venous phase at a 25–30-second delay, and the delayed phase at a 90-second delay.
Histogram analysis
The the portal venous phase CT images scans were stored in DICOM format and transferred to FireVoxel software (FireVoxel, 456; https://www.firevoxel.org). Two radiologists with more than 5 years of experience in hepatic imaging diagnosis independently performed histogram analysis on the acquired images in a double-blind manner. Any discrepancies between the two were resolved through discussion. The full-layer region of interest (ROI) encompassing the entire liver parenchyma were manually delineated layer by layer, avoiding visible blood vessels, bile ducts, artifacts, and the liver edge. Once the ROIs were delineated, the software automatically generated the histogram parameters for the entire volume iodine map, including minimum value (Min), maximum value (Max), mean (Mean), standard deviation (SD), variance, skewness, kurtosis, entropy, percentiles (V10, V25, V50, V75, V90, V95) (Figs. 1). To ensure the consistency and reliability of the iodine map histogram parameters, the intra-class correlation coefficient (ICC) was calculated to validate the ROI characteristics independently labeled by the two radiologists.
Fig. 1
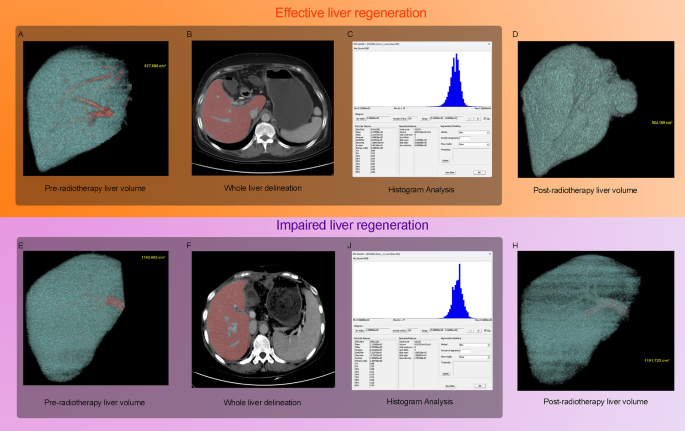
Workflow of the study and representative imaging cases from the effective liver regeneration (ELR) and impaired liver regeneration (ILR) cohorts. (A–D) A 66-year-old female patient with hepatocellular carcinoma (HCC) who underwent adjuvant intensity-modulated radiotherapy (IMRT). (A) Pre-RT portal-venous phase contrast-enhanced computed tomography (CE-CT) image showing a residual liver volume (RLV) of 817.680 cm³. (B) Manual delineation of the liver parenchyma for histogram analysis. (C) Extracted histogram distribution of voxel intensity values, from which parameters such as kurtosis, skewness, and entropy were derived. (D) Follow-up CE-CT within one year post-RT showing increased RLV of 954.189 cm³, corresponding to a regeneration index (RI) of 16.69%. (E–H) A 52-year-old female patient in the ILR cohort. (E) Pre-RT CE-CT showed an RLV of 1162.602 cm³. (F) Manual histogram delineation. (G) Extracted histogram features. (H) Follow-up CE-CT one year post-RT demonstrated an RLV of 1191.722 cm³, yielding an RI of only 2.50%
Statistical analysis
Statistical analysis was conducted using IBM SPSS 25.0 and R 4.2.1 software. The Shapiro-Wilk test was used to assess normality. Data were presented as means ± standard deviation for normally distributed variables, and medians (interquartile range) for non-normally distributed variables. Categorical variables were analyzed using χ² or Fisher’s exact test. Multivariable logistic regression was used to identify independent risk factors for ELR and develop a nomogram. The variance inflation factor (VIF) was used to check for multicollinearity among variables. The model’s performance was assessed using ROC curves, calibration curves, and decision curve analysis (DCA). Statistical significance was defined as P < 0.05.
Results
Patient characteristics
This study enrolled a total of 315 patients with HCC, including 139 in the training cohort, 85 in validation cohort 1, and 91 in validation cohort 2. As summarized in Table 1, the median age of the entire cohort was 57.0 years (interquartile range [IQR]: 51.0–71.0), with a predominance of male patients (81.9%). Among these patients, 187 (59.4%) achieved ELR, whereas 128 (40.6%) exhibited ILR. No significant differences were observed in major imaging parameters (e.g., minimum, mean, standard deviation, skewness, kurtosis, entropy) or in most clinical variables, including the SII, liver function indices, and the ALBI score (all p > 0.05). Interobserver agreement for histogram features was excellent, with ICCs exceeding 0.75 for all measurements. Baseline characteristics were comparable across the training and both validation cohorts. Representative cases are shown in Fig. 1, demonstrating an ELR case with RI of 16.69% (Figs. 1A–D) and an ILR case with an RI of 2.50% (Figs. 1E–H). These include pre-IMRT CE-CT volume reconstructions (Figs. 1A, E), manually delineated CE-CT images (Figs. 1B, F), extracted histogram features (Figs. 1C, G), and one-year post-IMRT volume reconstructions (Figs. 1D, H).
Table 1 Baseline characteristics of patients in the training and validation cohorts
Independent predictors of ELR in the training cohort
As shown in Table 2, several variables significantly differed between the ELR and ILR cohorts. Patients in the ILR group demonstrated a higher mean liver dose (Liver-Dmean; p < 0.001), an elevated FIB-4 index (p = 0.003), and increased systemic immune-inflammation index (SII; p = 0.022). Radiological features derived from contrast-enhanced CT histogram analysis also varied significantly: the ILR cohort exhibited less negative skewness (p = 0.047), lower kurtosis (p < 0.001), and higher entropy values (p = 0.039). In addition, the SRLV was markedly lower in the ILR cohort (p < 0.001), underscoring the combined role of dosimetric, clinical, and imaging parameters in differentiating regenerative outcomes.
Table 2 Comparison of key variables between ELR and ILR cohorts in the training cohort
Development of the ELR prediction model with independent risk factors
In the univariate analysis, multiple variables were significantly associated with ELR, including kurtosis, entropy, SII, FIB-4 index, advanced fibrosis stage (F2–F4), SRLV, and Liver-Dmean (all p < 0.05). However, when entered into the multivariate logistic regression model, only kurtosis (OR = 1.09, 95% CI: 1.03–1.15; p = 0.004), advanced fibrosis stage (F2–F4), SRLV (OR = 1.01, 95% CI: 1.01–1.01; p = 0.006), and Liver-Dmean (OR = 0.89, 95% CI: 0.81–0.97; p = 0.009) remained independent predictors of ELR, with all VIF < 5, indicating no multicollinearity (Table 3). These predictors were subsequently incorporated into a nomogram to facilitate individualized prediction of ELR (Fig. 2A).
Table 3 Multivariate logistic regression analysis for predictors of effective liver regeneration
Fig. 2
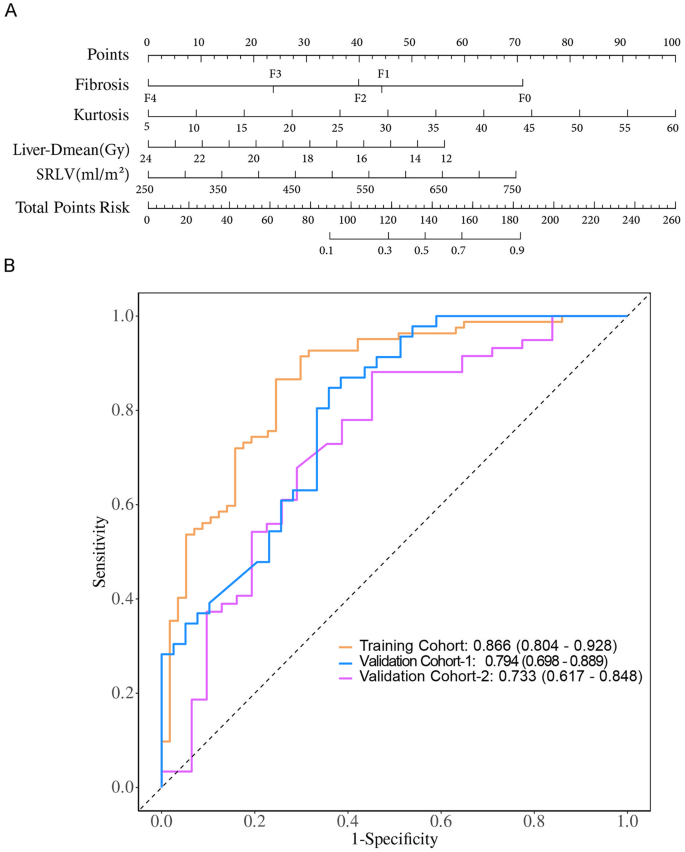
Development and validation of the nomogram for predicting ELR in HCC patients following adjuvant IMRT. (A) Nomogram integrating four independent predictors identified by multivariable analysis: kurtosis, fibrosis stage (F0–F4, according to the New Inuyama classification), standardized remnant liver volume (SRLV), and mean liver dose (Liver-Dmean, Gy). Each predictor is assigned a point score, and the total score corresponds to the probability of ELR. (B) Receiver operating characteristic (ROC) curves of the nomogram in the training cohort (yellow), validation cohort-1 (blue), and validation cohort-2 (magenta). The area under the curve (AUC) values were 0.866, 0.794, and 0.733, respectively, indicating good discrimination. The x-axis represents 1-specificity and the y-axis represents sensitivity
Predictive performance and external validation of the ELR nomogram
The nomogram, developed by integrating significant predictors identified in multivariate analysis including kurtosis, fibrosis stage, SRLV, and Liver‑Dmean, showed promising potential for predicting ELR following postoperative IMRT. To evaluate its generalizability, we assessed the model’s performance across the training and two independent validation cohorts.Training Cohort: The model achieved an AUC of 0.866 (95% CI: 0.804–0.928), with an accuracy of 82.0% (95% CI: 74.6–88.0%), sensitivity of 75.4% (95% CI: 64.3–86.6%), specificity of 86.6% (95% CI: 79.2–94.0%), positive predictive value (PPV) of 79.6% (95% CI: 68.9–90.4%), and negative predictive value (NPV) of 83.5% (95% CI: 75.6–91.4%); Validation Cohort 1: The model maintained good discrimination, with an AUC of 0.794 (95% CI: 0.698–0.889), accuracy of 72.9% (95% CI: 62.2–82.0%), sensitivity of 53.8% (95% CI: 38.2–69.5%), specificity of 89.1% (95% CI: 80.1–98.1%), PPV of 80.8% (95% CI: 65.6–95.9%), and NPV of 69.5% (95% CI: 57.7–81.2%); Validation Cohort 2: The model achieved an AUC of 0.733 (95% CI: 0.617–0.848), accuracy of 65.6% (95% CI: 54.8–75.3%), sensitivity of 71.0% (95% CI: 55.0–86.9%), specificity of 62.7% (95% CI: 50.4–75.1%), PPV of 50.0% (95% CI: 35.2–64.8%), and NPV of 80.4% (95% CI: 69.0–91.9%) (Fig. 2B; Table 4).Calibration curves indicated good agreement between predicted and observed outcomes in both training and validation cohorts(Fig. 3A–C). Decision curve analysis (DCA) further demonstrated a net clinical benefit across a range of threshold probabilities, suggesting the model’s potential utility in guiding individualized treatment planning(Fig. 3D–F). These findings collectively suggest that the nomogram may serve as a valuable tool for clinicians to assess liver regeneration potential following postoperative IMRT in patients with HCC, offering significant clinical implications for personalized treatment strategies.
Table 4 Performance metrics of the ELR prediction nomogram
Fig. 3
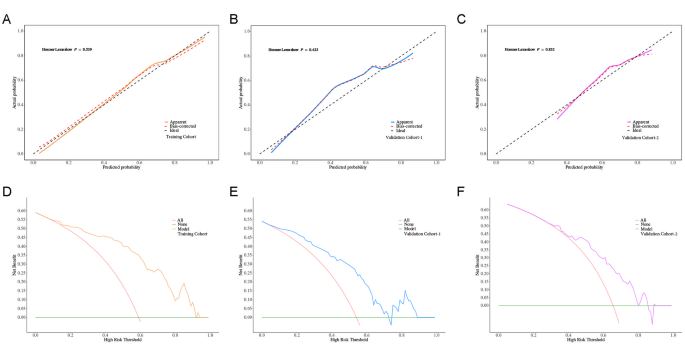
Calibration and clinical utility of the ELR nomogram. (A–C) Calibration curves comparing predicted probabilities of ELR with observed outcomes in the training cohort (A), validation cohort-1 (B), and validation cohort-2 (C). The dashed 45° line represents perfect calibration.The y-axis indicates predicted probability, and the x-axis indicates actual probability. (D–F) Decision curve analysis (DCA) in the training cohort (D), validation cohort-1 (E), and validation cohort-2 (F), showing the net clinical benefit of the nomogram across a range of threshold probabilities. The y-axis indicates net benefit, and the x-axis indicates high risk threshold
Discussion
HCC patients who undergo resection with a narrow surgical margin (< 1 cm) or present with MVI are at high risk of early intrahepatic recurrence [5]. RT has been shown to improve survival but may compromise liver regeneration, particularly in patients with impaired hepatic function [26]. In this study, we developed a predictive model that integrates CE-CT histogram features with clinical and dosimetric parameters to evaluate liver regeneration after IMRT. Multivariate logistic regression identified kurtosis, Liver-Dmean, SRLV, and fibrosis as independent predictors of ELR. Based on these factors, a nomogram was constructed to identify patients at risk of impaired regeneration and to support personalized adjuvant RT planning, aiming to balance oncologic control with preservation of liver function.
Clinically, patients undergoing hepatectomy for tumors located near vital vasculature or the hepatic hilum often require major resection to achieve oncological clearance, which results in a reduced RLV [16]. The accompanying surgical stress can impair liver function, limiting regeneration capacity [14, 15, 27]. Postoperatively, RLV directly correlates with the liver’s regenerative capacity [14, 15]. However, absolute liver volume can vary among individuals due to differences in BSA [15, 28]. Therefore, SRLV is considered a more reliable metric for assessing hepatic function [29]. In this study, higher SRLV was associated with an increased likelihood of ELR, further supporting its value in evaluating hepatic functional reserve and regenerative potential. Common liver function scores, such as Child-Pugh, MELD, and ALBI, are widely used to assess hepatic reserve and predict postoperative outcomes [30]. For example, the Child-Pugh score reflects liver function and correlates with the risk of postoperative liver failure [30]; the MELD score is used to assess prognosis in end-stage liver disease [31]; and the ALBI score objectively captures liver function changes and their impact on regeneration [32]. In our cohort, although these indices showed slight differences between ELR cohorts, none reached statistical significance, likely due to the limited sample size and the homogeneity of baseline liver function.
Several studies have confirmed that adjuvant RT reduces recurrence and improves prognosis in HCC [5, 32]. In clinical practice, radiotherapy strategies are tailored to patient characteristics. SBRT and brachytherapy achieve excellent local control with low toxicity in small, oligoprogressive, or recurrent lesions [8, 9, 33], but their use in the postoperative adjuvant setting is limited. For high-risk resected patients, IMRT remains the preferred modality owing to its superior conformity and gradient control, which allow coverage of tumor beds with narrow margins or microvascular invasion while minimizing exposure to the remnant liver and adjacent gastrointestinal organs [11]. A phase II trial confirmed that postoperative IMRT reduced early recurrence and improved local control with acceptable safety [5], while a recent network meta-analysis showed longer overall survival than -dimensional conformal RT (3D-CRT) and longer disease-free survival than SBRT [11]. Collectively, these findings suggest IMRT provides a favorable balance of efficacy and safety, although its long-term benefits warrant further study.The biological effect of RT on liver tissue is dose dependent: low-dose irradiation (3.2–8.0 Gy) stimulates hepatocyte proliferation, whereas high-dose irradiation (> 25 Gy) induces apoptosis and suppresses regeneration [33]. In addition, segmental doses exceeding 11 Gy have been associated with reduced liver volume [34]. Consistent with these observations, our study identified a negative correlation between Liver-Dmean and ELR, highlighting the need to balance tumor control with regenerative capacity.From a radiotherapy delivery perspective, efficiency and parenchymal sparing vary across modalities. brachytherapy offers steep dose fall-off and excellent conformity for small, well-defined targets, whereas SBRT provides high precision but is influenced by motion management, target size, and organ proximity [35,36,37]. In contrast, IMRT ensures comprehensive coverage of postoperative beds but inevitably increases low-to-intermediate dose exposure to non-tumorous liver [38]. Therefore, optimizing postoperative RT requires weighing tumor-bed coverage against regenerative dose constraints, and comparative studies are needed to refine modality selection. Furthermore, advances in precise targeting and delivery systems have improved the ability to reduce radiation to functional parenchyma while maintaining adequate tumor-bed coverage. proton therapy can further decrease the integral dose to normal liver by exploiting the Bragg peak [39, 40]. In addition, emerging nano-platforms that selectively deliver radiosensitizers to tumors may enhance low-dose RT efficacy and support better regenerative outcomes [41].In summary, while this study centered on IMRT, the identified predictors may also be relevant for other radiotherapy modalities. Future research should aim to develop and validate more advanced predictive models to evaluate hepatic regenerative capacity.
Globally, approximately 80–90% of HCC patients have underlying hepatic fibrosis or cirrhosis, which poses a significant barrier to effective liver regeneration [42]. Higher radiation doses (> 30–40 Gy in conventional fractionated RT or > 25 Gy in SBRT) can exacerbate this by inducing TGF-β1 expression and macrophage polarization, resulting in fibrosis and impaired regenerative capacity [26]. Clinical studies have confirmed that patients with cirrhosis may experience a net loss of liver volume within the first few months post-surgery, while non-fibrotic livers demonstrate rapid regeneration [43]. In our study, histopathological fibrosis staging was an independent predictor of ELR, whereas the non-invasive FIB-4 index, though significant in univariate analysis, lost its significance in multivariate modeling. FIB-4 is a non-invasive and easily accessible tool for assessing hepatic fibrosis with moderate diagnostic accuracy (sensitivity ~ 69%, specificity ~ 64% for ≥ F3 fibrosis) [44]. However, histopathological staging remains the gold standard for evaluating fibrosis severity. Scoring systems such as METAVIR and New Inuyama classification assess architectural distortion, collagen deposition, and portal expansion, which are strongly linked to impaired hepatocyte proliferation and reduced liver regeneration post-resection [45]. Future research should focus on integrating advanced imaging technologies (e.g., magnetic resonance elastography and radiomics) with AI-driven multi-omics approaches for more accurate, early, and non-invasive monitoring of hepatic fibrosis [46].
In the treatment of HCC, CE-CT remains a cost-effective and widely accessible imaging modality when compared to MRI. Beyond its role in diagnosis, CE-CT is integral to radiotherapy planning, providing reliable information for both target delineation and dose distribution [47]. Prior studies have demonstrated that CT-based texture analysis, particularly histogram-derived metrics, can predict postoperative liver regeneration [22]. Among these features, kurtosis, a first-order statistical parameter that quantifies the peakedness of voxel intensity distribution, has demonstrated potential biological relevance. Studies utilizing diffusion kurtosis imaging (DKI) have reported elevated kurtosis values in patients with robust hepatic regeneration, showing positive correlations with hepatocyte size and Ki-67 expression levels [48]. Conversely, higher arterial-phase intratumoral kurtosis has been linked to adverse clinical outcomes in HCC, suggesting a context-dependent role [49]. In our analysis, among all first-order texture features examined, kurtosis was the only parameter that remained independently associated with effective liver regeneration in multivariable modeling. Although the role of kurtosis in assessing radiotherapy-related hepatic regeneration is still being elucidated, our findings suggest that it may provide incremental predictive value when combined with conventional clinical and dosimetric factors. Given that kurtosis can be derived from conventional CE-CT through basic histogram-based analysis, it represents a practical and accessible imaging biomarker for incorporation into clinical workflows in centers equipped with appropriate image processing capabilities [22]. However, further investigations are warranted to confirm its reproducibility and to elucidate the underlying biological mechanisms linking kurtosis to liver regenerative capacity. Clinically, the nomogram integrates kurtosis, fibrosis stage, SRLV, and Liver-Dmean, all of which are available before the initiation of adjuvant radiotherapy, enabling estimation of liver regeneration probability during individualized treatment planning. This information can guide the optimization of radiotherapy parameters while ensuring adequate tumor-bed coverage and local control. Patients with a high predicted risk of impaired regeneration may benefit from approaches that reduce whole-liver dose, such as refined IMRT planning or proton and heavy-ion therapy when feasible [39, 40]. Patients with a favorable predicted regenerative capacity can safely receive standard-dose IMRT with greater confidence in preserving hepatic function. Overall, the nomogram provides a quantitative framework to balance tumor control with functional liver preservation and to improve postoperative quality of life.
Several limitations of this study should be acknowledged. First, the retrospective nature and limited sample size may contribute to selection bias and increase the likelihood of model overfitting. Second, our analysis was limited to multiphase CE-CT data, and did not incorporate functional imaging techniques such as gadoxetic acid–enhanced MRI (Gd-EOB-DTPA) or magnetic resonance elastography, both of which may provide more comprehensive characterization of hepatic parenchymal heterogeneity and regenerative capacity. Third, the manual delineation of residual liver regions of interest is labor-intensive and susceptible to interobserver variability. Our radiomic analysis was confined to first-order histogram metrics, without incorporating advanced feature extraction techniques such as wavelet transformations or deep learning-derived features, which could potentially enhance predictive performance.Finally, the threshold of a ≥ 10% increase in liver volume used to define LR was derived from a prior prospective study [24], While this threshold is contextually justified, a universally accepted definition of liver regeneration has not yet been established. Future studies should prospectively validate the model in larger multicenter cohorts, incorporate automated segmentation and higher-order radiomic or deep learning–derived features, and evaluate the clinical impact of using the nomogram as a decision-support tool to optimize treatment planning and reduce radiation-induced liver toxicity.
Conclusions
In this multicenter study involving 315 patients with HCC, we analyzed whole-liver histogram features derived from pre-IMRT portal venous phase CE-CT images to construct a predictive nomogram for post-IMRT liver regeneration capacity. The resulting model demonstrated strong predictive performance in the training cohort and was further validated in two independent external cohorts. This nomogram may offer clinically valuable guidance for individualizing IMRT strategies throughout the disease course of HCC by facilitating a more precise balance between antitumor efficacy and preservation of hepatic function.