Regional Hemodynamic Responses to Visual Stimulation in Awake Infants (original) (raw)
- Rapid Publication
- Published: 01 June 1998
- Michael Firbank2,
- Clare E Elwell2,
- Janette Atkinson3,
- Oliver Braddick3 &
- …
- John S Wyatt1
Pediatric Research volume 43, pages 840–843 (1998)Cite this article
- 2849 Accesses
- 210 Citations
- 3 Altmetric
- Metrics details
Abstract
This study presents the first measurements using near infrared spectroscopy of changes in regional hemodynamics as a response to a visual stimulus in awake infants. Ten infants aged 3 d to 14 wk viewed a checkerboard with a 5-Hz pattern reversal. The emitter and detector (optodes) of a near infrared spectrophotometer were placed over the occipital region of the head. Changes in concentration of oxy- and deoxyhemoglobin (Hbo2 and Hb) were measured and compared during 10-s epochs of stimulus on and off. A control group of 10 infants aged 18 d to 13 wk were examined with the same setup, but with the optodes over the frontoparietal region. In the test group the total hemoglobin concentration (Hbo2 + Hb) increased while the stimulus was on by a mean (±SD) of 2.51 (±1.48) μmol·L-1. Nine out of 10 infants showed an Hbo2 increase, and 9 out of 10 an Hb increase related to the stimulus. There was no significant change in any of these parameters in the control group. The results imply that there is increased cerebral blood flow due to stimulation that is specific to the visual cortex and that infants, unlike adults, show increased cerebral oxygen utilization during activation that outstrips this hemodynamic effect. The study demonstrates that near infrared spectroscopy can be used as a practical and noninvasive method of measuring visual functional activation and its hemodynamic correlates in the awake infant.
Main
The past decade has seen the development of new techniques, based on changes in regional cerebral blood flow, for detecting and localizing cerebral functional activation. The most widely used of these are positron emission tomography and functional MRI. These cannot routinely be used in the investigation of infants without sedation. NIRS is a noninvasive and portable technique that is used for studying cerebral hemodynamics in adults and infants(1–3). Several groups have demonstrated its use in the detection of evoked changes in regional hemodynamics in adults(4, 5). This study describes the first application of NIRS to detect such changes in the occipital cortex of infants while viewing a visual stimulus.
METHODS
Twenty infants aged 2 d to 3 mo were studied. None had pathology likely to affect cerebral function. Ten infants were studied over the occipital region(test group), and 10 were studied over the parietofrontal region, acting as controls (control group). The median age was 6 wk (range 3 d to 14 wk) in the test group, and 9.5 wk (18 d to 13 wk) in the control group. Informed parental consent was obtained before each study. The protocol was approved by the University College London Hospitals committee on the ethics of human research.
The theory of near infrared spectroscopy and its application to measurements in neonates has been described in detail elsewhere(2, 6). Changes in [Hbo2] and [Hb] concentration from an arbitrary zero were measured. The total change in hemoglobin concentration, [Hbo2] + [Hb] = [Hbvol] is related to changes in CBV(2).
The transmitting and detecting optodes of a NIRS system (NIRO500, Hamamatsu Photonics KK, Japan) were placed 3.5 cm apart on the infant's head. A controlling computer converted the changes in OD, which were measured once per second, into changes in cerebral Hbo2 and Hb concentrations. Infants were studied while they were in a quiet, alert state. The optodes were secured on the infant's head and a dark felt hat was used to prevent ambient light reaching the detecting optode. For the test infants the optodes were placed over the occipital region, 1 cm above the inion in the midline. For the control studies the optodes were placed over the right frontoparietal region.
Infants viewed a visual stimulus while sitting still on the examiner's(J.H.M.) lap, 40 cm from a 14-inch monitor. The stimulus consisted of a black and white checkerboard with 5-Hz pattern reversal. This image was displayed for 10 s (ON epoch) alternating with a blank dark screen for 10 s (OFF epoch), resulting in a 20-s stimulus cycle. The average luminance of the stimulus was 72.4 candela/m2, and of the blank screen was 2.1 candela/m2. The check size was 1 cm, subtending an angle of 1.4 °, which is near the peak size for VEP activation infants aged 2-3 mo(7). A trigger signal was sent to the NIRO500 marking transitions between ON and OFF epochs. A further signal was sent by the examiner to mark periods when the infant was both still and fixing on the screen.
Changes in Hbo2 and Hb concentration were analyzed on a spreadsheet. Movement artifacts resulted in sharp spikes in both the Hb and the Hbo2 traces, and cycles containing these were excluded. Studies were accepted if the infant remained still and fixing for more than one ON/OFF cycle. The changes in [Hbo2], [Hb], and [Hbvol] were averaged for epochs with the stimulus on and off, to obtain a better signal:noise ratio. Attempts were made to study 58 infants, but studies were stopped if the infant moved or became distressed. Twenty infants were successfully studied.
RESULTS
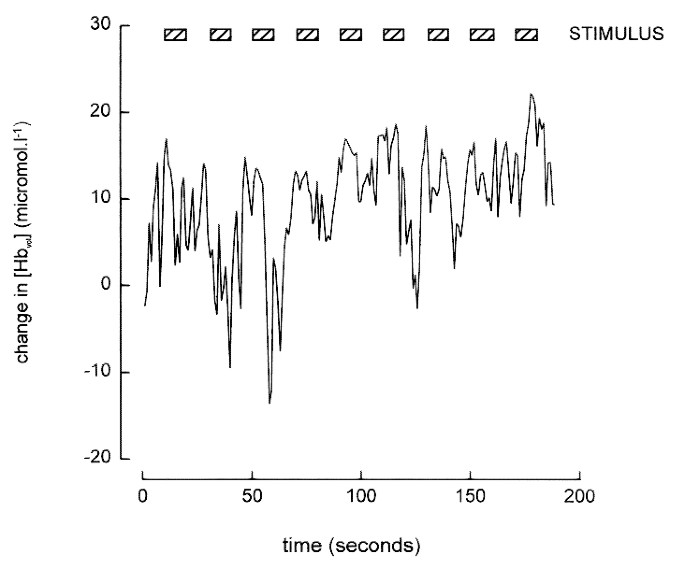
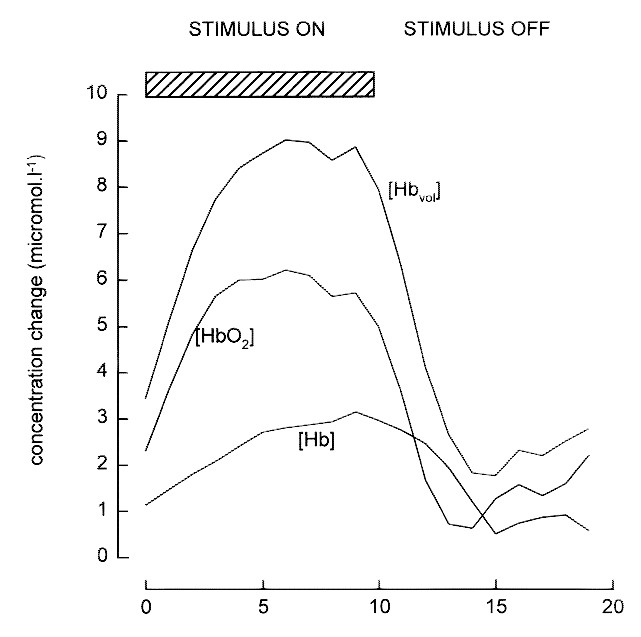
Figure 1 shows the NIRS data collected over the occipital cortex for one subject. Changes in [Hbvol] from an arbitrary baseline are plotted against time with the ON epochs shown separately from the OFF epochs. Figure 2 shows the [Hbo2], [Hb], and[Hbvol] data from the same infant averaged over nine cycles and smoothed. [Hbo2], [Hb], and [Hbvol] increased with visual stimulation, rising over the first 5 s. Table 1 shows the averaged differences in [Hbo2], [Hb], and [Hbvol] between epochs of stimulus ON and OFF for all subjects. For 9 infants [Hbo2] increased when the stimulus was on, for a different 9 out of 10 infants [Hb] increased, and overall, for all 10 infants [Hbvol] increased. There was no relation between the magnitude of the concentration change and age.
Figure 1
Changes in [Hbvol] in one infant showing a response to repeated stimulation.
Figure 2
Changes of [Hbo2], [Hb], and [Hbvol] with stimulation averaged over nine cycles in the same infant.
Table 1 Results for test group
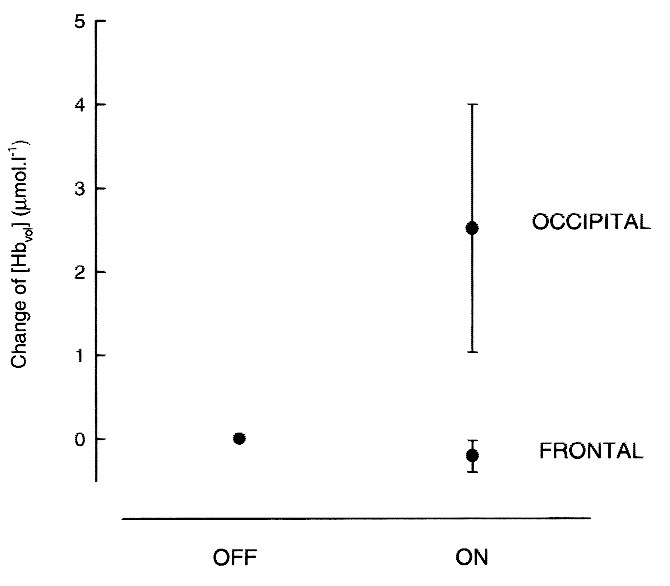
Table 2 displays similar data for the control infants. No significant changes were seen in any of the parameters. The concentration changes in the control group were significantly different from those in the test group for Hbo2 (p < 0.001), Hb (p < 0.004), and Hbvol (p < 0.0001, unpaired t test).Figure 3 illustrates the difference between the changes in [Hbvol] over the occipital and frontal regions. The SEM of the observations of [Hbvol] during the nonactivated state ranged from 0.06 to 0.24 μmol·L-1. The mean (±SD) time to the peak change in [Hbo2] in the test group was 4.2 (±2.0) s.
Table 2 Results for control group
Figure 3
Comparison of changes in [Hbvol] over the occipital and frontal regions.
DISCUSSION
This study demonstrates that NIRS can be used to measure regional changes in cerebral hemodynamics resulting from visual stimulation in awake infants. There was a wide variation in the magnitude of the change in [Hbvol] between subjects, but all showed an increase with stimulation. The mean change of 2.43 μmol·L-1 s-1 represents a fractional change in CBV of the order of 5% (assuming a CBV of 50 μmol·L-1)(2). This is greater than the change of 0.61μmol·L-1 we have measured using NIRS in adults(4). This difference may be due to the underestimation by NIRS of concentration changes in adults, where as little as 14% of the light attenuation originates from the brain(8), compared with 70-90% in the neonate(9). Belliveau et al.(10) have measured a 32 ± 10% change in CBV in adults as a result of photic stimulation using MRI. To date no quantified measurements of cerebral hemodynamic changes in infants have been published.
There was no significant change in [Hbo2] or [Hb] concentration over the frontal region in the control infants. The changes observed over the occipital region in the test infants were therefore unlikely to result from movement artifact, increased blood flow in extracerebral tissue, or a generalized increase in cerebral blood flow. The trend toward a small negative concentration change was not significant; the standard deviations in the control group exceeding the mean values.
The variability in the magnitude of the responses is likely to reflect variations both in individual regional cerebral blood flow and oxygen consumption changes, in anatomy, and in the location of the optodes relative to cerebral structures. It was not possible to define the precise anatomical area studied as near infared light is highly scattered in tissue. This means that it is likely that areas outside the primary visual cortex were included in the study region.
The increase in CBV with visual stimulation consisted in most cases of increases in both [Hbo2] and [Hb]. This differs from the response seen in adult studies, in which [Hb] decreases whereas CBV increases, measured by both NIRS and BOLD MRI(11, 12). Two groups have reported preliminary functional MRI studies with sleeping or sedated infants. Martin et al.(13) studied six sedated neonates, stimulated with red LED goggles (8 Hz). One infant showed stimulus-related increases in [Hb]. Born et al.(14) studied seven infants, one asleep and six sedated, stimulated with 8-Hz flashes. Areas of significant signal change were seen in the occipital region, with an increase in [Hb]. However, in the youngest infants activation was restricted to the anterolateral region of the calcarine fissure. Modeling studies suggest that this region is within the volume measured by the NIRS setup we used over the occiput(9).
The increase in [Hbvol] shows that 0-14 wk infants have a hemodynamic response to neuronal activation that is similar both qualitatively and in its time course to the adult response. However, our NIRS results, like the infant BOLD MRI studies, show an increase in [Hb] during stimulation, rather than the decrease shown by both methods in adults. During oxygen consumption there is an increase in [Hb] and a corresponding decrease in[Hbo2]. When regional perfusion increases there is a rise in[Hbo2] and often a decrease in [Hb] due to washout. The relative contribution of these two effects determines whether [Hb] increases or decreases. Our results imply that in infants, unlike adults, the increase in oxygen consumption outpaces the increase in blood flow. For both the MRI studies cited infants were sedated, and the use of sedation has been shown to reverse the direction of the BOLD signal in some adults(15). However the present study shows that the reversal of the awake adult pattern also occurs in alert and unsedated infants.
The most widely used method of studying visually related neural activity in infants of all ages is the VEP, recorded by surface electrodes placed over the occipital scalp. The checkerboard pattern with pattern reversal yields a reliable VEP signal in newborns. We have adapted this stimulus in the present study. Whereas VEPs measure integrated neuronal activation, NIRS measures changes in cerebral hemodynamics. In normal circumstances these are coupled, but the study of cerebral hemodynamics may produce new insights into the mechanisms and development of both normal and damaged cerebral function. Compared with the VEP there is less indirect calculation involved in attributing the NIRS signal to a region within the cerebral volume; the NIRS method may therefore prove valuable in locating activation within the brain.
We have reported measurements of functional hemodynamic responses in awake infants. The technique has many advantages when studying both the sedated and the unsedated child. The spectrophotometer is portable, and can be used to study infants at the cotside who are too sick to be moved. It is noninvasive, and does not involve the administration of radioactive substances or other contrast media. Thus it allows repeated measurements of the same infant. The precise region interrogated is not known, but using mapping techniques(16) or a new generation of imaging spectrophotometers(17) more spatial information should become available. The technique can be applied to sick infants undergoing intensive care and may provide a sensitive means for the early detection of cortical injury in the developing brain.
Abbreviations
BOLD:
blood oxygenation level-dependent
CBV:
cerebral blood volume
Hb:
deoxyhemoglobin
Hbo2:
oxyhemoglobin
Hbvol:
total hemoglobin
MRI:
magnetic resonance imaging
NIRS:
near infrared spectroscopy
VEP:
visual evoked potentials
References
- Jobsis FF 1977 Noninvasive infrared monitoring of cerebral and myocardial oxygen sufficiency and circulatory parameters. Science 198: 1264–1267.
Article CAS Google Scholar - Wyatt JS, Cope M, Delpy DT, Wray S, Reynolds EOR 1986 Quantification of cerebral oxygenation and haemodynamics in sick newborn infants by near infrared spectrophotometry. Lancet 2: 1063–1066.
Article CAS Google Scholar - Elwell CE, Cope M, Edwards AD, Wyatt JS, Delpy DT, Reynolds EOR 1994 Quantification of adult cerebral haemodynamics by near infrared spectroscopy. J Appl Physiol 77: 2753–2760.
Article CAS Google Scholar - Meek JH, Elwell CE, Khan MJ, Romaya J, Wyatt JS, Delpy DT, Zeki S 1995 Regional changes in cerebral haemodynamics as a result of a visual stimulus measured by near infrared pectroscopy. Proc R Soc Lond B 261: 351–356.
Article CAS Google Scholar - Villringer A, Planck J, Stodick S, Botzel K, Schleinkofer L, Dirnagl U 1993 Noninvasive assessment of cerebral haemodynamics and tissue oxygenation during activation of brain cell function in human adults using NIRS. Neurosci Lett 154: 1-2, 101–104.
Article CAS Google Scholar - Cope M, Delpy DT 1988 A system for the long term measurement of cerebral blood and tissue oxygenation in newborn infants by near infrared transillumination. Med Biol Eng Comput 26: 289–294.
Article CAS Google Scholar - Sokol S 1978 Measurement of visual acuity from pattern reversal evoked potentials. Vision Res 18: 33–39.
Article CAS Google Scholar - Okada E, Firbank M, Schweiger M, Arridge SR, Cope M, Delpy DT 1997 Theoretical and experimental investigation of near-infrared light propagation in a model of the adult head. Appl Optics 36: 21–31.
Article CAS Google Scholar - Okada E, Delpy DT 1996 The effect of overlying tissue on NIR light propagation in neonatal brain. OAS TOPS 2: 338–343.
Google Scholar - Belliveau JW, Kennedy DN, McKinstry RC, Buchbinder BR, Weisskoff RM, Cohen MS, Vevea JM, Brady TJ, Rosen BR 1991 Functional mapping of the human visual cortex by magnetic resonance imaging. Science 254: 716–719.
Article CAS Google Scholar - Kleinschmidt A, Obrig H, Requardt M, Merboldt KD, Dirnagl U, Villringer A, Frahm J 1996 Simultaneous recording of cerebral blood oxygenation changes during human brain activation by MRI and near-infrared spectroscopy. J Cereb Blood Flow Metab 16: 817–826.
Article CAS Google Scholar - Ogawa S, Lee TM, Kay AR, Tank DW 1990 Brain magnetic resonance imaging with contrast dependent on blood oxygenation. Proc Natl Acad Sci USA 87: 9868–9872.
Article CAS Google Scholar - Martin E, Ekatodramis D, Huisman TH, Loenneker Th, Joeri Ph, Szekely G, Link J, Rumpel H 1996 Visual processing in infants and children using fMRI. MAG*MA ( suppl IV) II: 176
- Born P, Rostrup E, Leth H, Peiterson B, Lou HC 1996 Change of visually induced cortical activation patterns during development[letter]. Lancet 347: 543
Article CAS Google Scholar - Joeri P, Huisman T, Rumpel H, Ekatodramis D, Loenneker Th, Martin E 1996 Comparison of fMRI-signal changes during visual stimulation, in awake vs. phenobarbital sedated volunteers. MAG*MA ( suppl IV) II: 176–177.
Google Scholar - Hirth C, Obrig H, Villringer K, Thiel A, Bernarding J, Muhlnickel W, Flor H, Dirnagl U, Villringer A 1996 Non invasive functional mapping of the human motor cortex using near infrared spectroscopy. Neuroreport 7: 1977–1981.
Article CAS Google Scholar - van Houten JP, Benaron DA, Spilman S, Stevenson DK 1996 Imaging brain injury using time resolved near infrared light scanning. Pediatr Res 39: 470–476.
Article CAS Google Scholar
Acknowledgements
The authors thank Professor David Delpy for valuable discussions, and the staff of the pediatric outpatients department, the neonatal intensive care unit, and the postnatal wards of University College London Hospitals Trust for their assistance.
Author information
Authors and Affiliations
- Department of Paediatrics, University College London Hospital Medical School, University Street, London, WC1E 6JJ, United Kingdom
Judith H Meek & John S Wyatt - Department of Medical Physics and Bioengineering, University College London, London, WC1E 6JA, United Kingdom
Michael Firbank & Clare E Elwell - Department of Psychology, Visual Development Unit, University College London, London, WC1E 6BT, United Kingdom
Janette Atkinson & Oliver Braddick
Authors
- Judith H Meek
You can also search for this author inPubMed Google Scholar - Michael Firbank
You can also search for this author inPubMed Google Scholar - Clare E Elwell
You can also search for this author inPubMed Google Scholar - Janette Atkinson
You can also search for this author inPubMed Google Scholar - Oliver Braddick
You can also search for this author inPubMed Google Scholar - John S Wyatt
You can also search for this author inPubMed Google Scholar
Additional information
Supported by Action Research.
Rights and permissions
About this article
Cite this article
Meek, J., Firbank, M., Elwell, C. et al. Regional Hemodynamic Responses to Visual Stimulation in Awake Infants.Pediatr Res 43, 840–843 (1998). https://doi.org/10.1203/00006450-199806000-00019
- Received: 07 November 1997
- Accepted: 12 February 1998
- Issue Date: 01 June 1998
- DOI: https://doi.org/10.1203/00006450-199806000-00019


