Zeb1 affects epithelial cell adhesion by diverting glycosphingolipid metabolism (original) (raw)
Repression of Zeb1 decreases expression of a‐series GSLs and St3gal5
To examine a putative role of selected EMT‐TFs in controlling GSL metabolism, we made use of mammary epithelial NM18 cells. These cells are derived from heterogeneous NMuMG cells and represent a morphological‐homogenous subpopulation that has been characterized in previous studies 6–[8](/article/10.15252/embr.201439333#ref-CR8 "Feuerborn A, Mathow D, Srivastava PK, Gretz N, Grone HJ (2014) Basonuclin‐1 modulates epithelial plasticity and TGF‐beta1‐induced loss of epithelial cell integrity. Oncogene doi: https://doi.org/10.1038/onc.2014.54
            "). The considered TFs (FoxA2, FoxQ1, Zeb1, Zeb2, c‐Jun and Bnc1) were selected based on their proven impact on cell cohesion and our previous knowledge about their constitutive expression in NM18 cells [8](/article/10.15252/embr.201439333#ref-CR8 "Feuerborn A, Mathow D, Srivastava PK, Gretz N, Grone HJ (2014) Basonuclin‐1 modulates epithelial plasticity and TGF‐beta1‐induced loss of epithelial cell integrity. Oncogene doi:
              https://doi.org/10.1038/onc.2014.54

            ").
RNAi‐mediated suppression of these TFs in conjunction with thin‐layer chromatography of GSLs identified Zeb‐TFs to exert a notable influence on the expression of GSLs (Supplementary Fig S1A and B).
We subsequently characterized changes of GSLs in Zeb1‐repressed cells in more detail. Suppression of Zeb1 elevated levels of lactosylceramide (LacCer) in the neutral fraction as well as 0‐series GSL GM1b in the acidic fraction. Acidic a‐series GSLs GM1a and GM2 were reduced (Fig 1A and B, Supplementary Fig S1A). Similar results were obtained with an independent siRNA targeting Zeb1 (Supplementary Fig S1C, left panel and D).
Figure 1
Suppression of St3gal5/GM3 synthase recapitulates changes in GSL expression of Zeb1 knockdown cells and repression of Zeb1 decreases St3gal5 expression
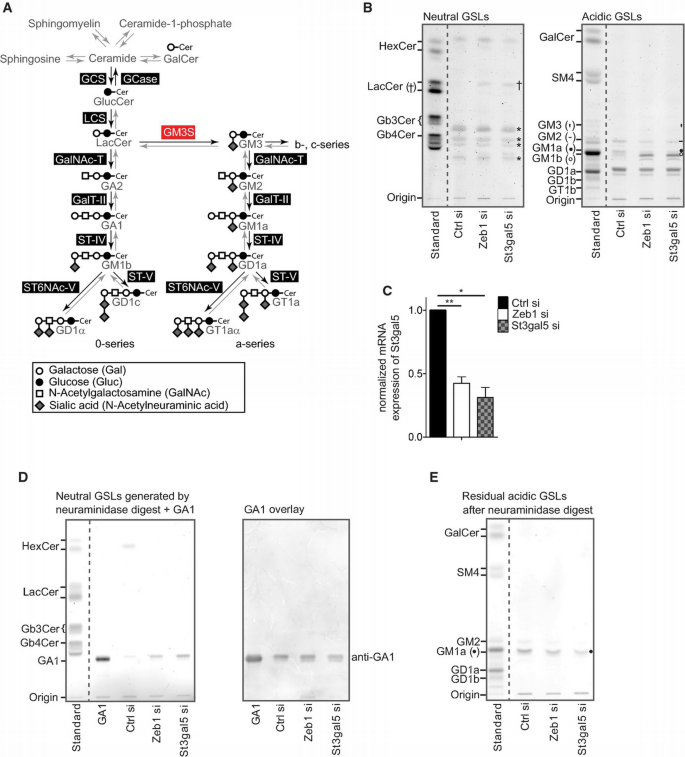
A. Schematic representation of enzymes (black boxes) and metabolites (grey) related to (G)SL metabolism. GM3 synthase (GM3S, red box) converts LacCer into GM3, the precursor for all higher gangliosides of a‐, b‐ and c‐series. Gangliosides of the b‐ and c‐series were not detected in NM18 cells.
B. TLC‐based comparison of GSLs. Cells repressed in Zeb1 or St3gal5 (72 h) reveal similar alterations in GSL expression as indicated by elevated levels of LacCer (†) and GM1b (○) and reduced levels of GM2 (‐) and GM1a (●). * indicates no GSL.
C. qRT–PCR‐based analysis of St3gal5 mRNA expression in Zeb1‐ and St3gal5‐repressed cells. Cells were transfected for 72 h with indicated siRNAs (n = 3). Mean ± SD, n = 3, *P ≤ 0.05, **P ≤ 0.01, paired _t_‐test.
D. Acidic GSLs after treatment with sialidase reveal elevated levels of GA1 in the neutral fraction of Zeb1‐ and St3gal5‐repressed cells (left panel). Validation of GA1 via immune overlay (right panel).
E. Acidic GSLs of Zeb1‐ and St3gal5‐silenced cells after treatment with Vibrio cholera sialidase. Sialidase cleavage leads to conversion of GM1b to GA1, detectable in the TLC of neutral GSLs (see D). GM1a levels are decreased in Zeb1‐ and St3gal5‐knockdown cells (●).
Next, we performed gene expression profiling of Zeb1‐repressed cells and specifically extracted differentially expressed genes annotated with gene‐ontology terms ‘lipid metabolic process’ and ‘sialyltransferase activity’ (Supplementary Table S1). Within this panel, we noted reduced expression of St3gal5 (GM3 synthase) in Zeb1 knockdown cells, which was further confirmed via qRT–PCR (Fig 1C, Supplementary Fig S1C, right panel). GM3 synthase converts LacCer to GM3, the precursor of higher gangliosides belonging to a‐, b‐ and c‐series (Fig 1A). Reduced expression of St3gal5 switches expression of GSLs from the a‐series towards the 0‐series 9, just as we observed for Zeb1 knockdown cells, implicating that Zeb1 may affect GSL expression by transcriptionally regulating the expression of St3gal5. Indeed, the repression of St3gal5 mimicked knockdown of Zeb1 with regard to changes in GSL expression (Fig 1B). Quantification of neutral GSLs via liquid chromatography–electrospray ionization tandem mass spectrometry confirmed a significant increase in overall LacCer levels with similar acyl chain saturation in Zeb1‐ and St3gal5‐silenced cells (Supplementary Fig S1E).
Acidic GSLs were further treated with Vibrio cholera sialidase which cleaves terminal sialic acid residues (from e.g. GM1b), but not inner sialic acid residues (from e.g. GM1a). Sialidase treatment resulted in accumulation of GA1 (GM1b without sialic acid) in the neutral fraction (Fig 1D, left panel), whereas GM1a remained present in the acidic fraction (Fig 1E). Immune overlay further confirmed the accumulation of GA1 upon incubation of acidic GSLs with sialidase (Fig 1D, right panel). Hence, the acidic GSL enriched upon Zeb1 and St3gal5 knockdown is GM1b, a 0‐series specific compound harbouring a terminal sialic acid residue.
These results identify Zeb1 as a novel regulator of GSL metabolism, controlling the turnover of LacCer into a‐series GSLs (b‐ and c‐series GSLs were not detected in NM18 cells). Consistently, levels of LacCer increase upon Zeb1 repression, which, in the case of NM18 cells, is partially metabolized into 0‐series GSLs (exemplified by the increase in GM1b). The findings that exclusive repression of St3gal5 mimics the GSL pattern of Zeb1‐impaired cells and that expression of St3gal5 is reduced upon Zeb1 knockdown strongly imply that St3gal5 is the key target gene of Zeb1 for the observed alterations in GSL expression.
Zeb1 exerts a dual‐regulatory role on St3gal5 expression
Next, we addressed regulatory mechanisms underlying Zeb1‐dependent control of St3gal5 expression. Zeb1 binds to E‐box sequences, and in silico analysis of St3gal5 promoter regions identified a single consensus (5′‐CACCT(G)‐3′) and seven degenerated (5′‐CANNT(G)‐3′) E‐boxes within ~2.8 kb upstream of the transcription start site (TSS) (Fig 2A, Supplementary Fig S2A).
Figure 2
Zeb1 regulates expression of St3gal5 in a direct and indirect manner
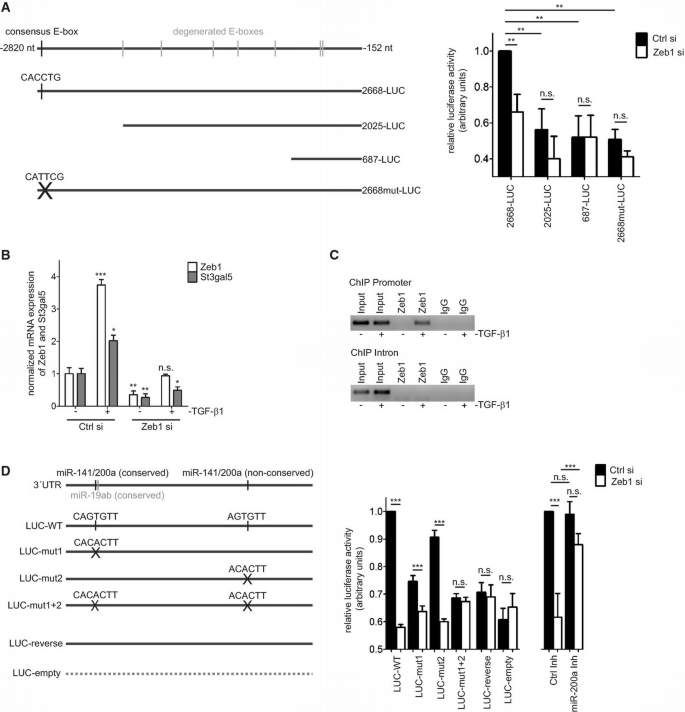
A. Luciferase assays employing St3gal5 promoter fragments of different lengths. Cells were transfected as indicated. Activity readings of cells transfected with Ctrl‐siRNA and ‘full‐length’ promoter (2668‐LUC) were set to 1 and used as reference. Mean ± SD, n = 4, **P ≤ 0.01, one‐way ANOVA with Tukey's Multiple Comparison Test.
B. qRT–PCR‐based analysis of mRNA expression of Zeb1 and St3gal5 in transfected cells (24 h) in conjunction with TGF‐β1 stimulation (24 h). Significance refers to untreated cells transfected with Ctrl‐siRNA (n = 3). Mean ± upper/lower limit, n = 3, ***P ≤ 0.001, **P ≤ 0.01, *P ≤ 0.05, one‐way ANOVA with Tukey's Multiple Comparison Test.
C. ChIP experiments of endogenous St3gal5 promoter after immunoprecipitation of Zeb1. Promoter regions (upper panel) were detectable by PCR after cells were treated with TGF‐β1 (24 h). In contrast, a control region within intron 1 of St3gal5 (lower panel) was not amplified. ChIP experiments were independently performed twice with similar outcome.
D. Schematic representation of St3gal5 3′‐UTR constructs. Predicted binding sites for miR‐141/200a were mutated as indicated. Controls included empty luciferase plasmid (Luc‐empty) and a construct with St3gal5 3′‐UTR cloned in reversed orientation (Luc‐reverse) (left panel). Cells were transfected with luciferase reporters in conjunction with Ctrl‐ or Zeb1‐siRNA. Activity readings of cells transfected with wild‐type plasmid (WT) and Ctrl‐siRNAs were arbitrarily set to 1 and used as reference. The plot displays the loss of reporter activity of respective reporter plasmids upon Zeb1 knockdown. Independently, cells were also transfected with Ctrl‐ or Zeb1‐siRNA together with a Ctrl or miRNA inhibitor. Activity readings of cells transfected with Ctrl‐siRNA and Ctrl‐inhibitor were arbitrarily set to 1 and used as reference. Mean ± SD, n = 3, ***P ≤ 0.001, one‐way ANOVA with Tukey's Multiple Comparison Test.
Luciferase reporter assays testing St3gal5 promoter fragments of different lengths (~2.7 kb, ~2 kb and ~0.7 kb) revealed strongest expression of the reporter containing the longest promoter fragment (Fig 2A). Truncated versions (2 kb and 0.7 kb) only expressed ~50% of luciferase compared to the 2.7 kb variant. Reporter activity of the 2.7 kb construct decreased to ~66% in Zeb1‐repressed cells compared to respective controls. In contrast, the repression of Zeb1 did not significantly decrease reporter activity of the intermediate (2025‐LUC) or shorter (687‐LUC) promoter fragments (Fig 2A). These results suggest that Zeb1 may directly influence the St3gal5 promoter within the region containing the consensus E‐box sequence. Consistently, site‐directed mutagenesis of this site reduced reporter activity which was not further significantly impaired by Zeb1 repression (Fig 2A).
Luciferase activities of 2025‐LUC and 2668mut‐LUC seemed slightly reduced upon Zeb1 knockdown. Though the differences did not reach statistical significance, we assume that degenerated E‐box binding sites and/or binding sites of TFs regulated by Zeb1 may contribute to these observations.
Next, we tested a putative interaction of Zeb1 with endogenous St3gal5 promoter. Previous work suggested that low protein expression levels of Zeb1 limit applicability of ChIP experiments 10. We thus induced Zeb1 expression by exposing NM18 cells to TGF‐β1, which also increased expression levels of St3gal5 mRNA (Fig 2B). ChIP experiments resulted in reproducible PCR‐based detection of St3gal5 promoter (Fig 2C) after precipitation of Zeb1 from TGF‐β1‐induced cells. In contrast, a control region in intron 1 was not detected. These results argue that Zeb1 is a direct regulator of St3gal5 expression. Following the above outlined observations (e.g. Fig 2A–C), the Zeb1–St3gal5 regulatory axis seems to be constitutively present in NM18 cells but only robustly traceable in ChIP experiments upon TGF‐β1 stimulation and increased levels of Zeb1 in these cells.
Zeb1 also represses microRNA (miRNA) expression, including the miR‐200 family. Members of the miR‐200 family themselves are established inhibitors of Zeb1 expression 11. _St3gal5‐_3′‐UTR contains two conserved binding sites for miRNAs, namely miR‐19a/b and miR‐141/200a, as well as a non‐conserved binding site for miR‐141/200a (Supplementary Fig S2B). Expression analyses of miR‐19a/b and miR‐141/200a in Zeb1 knockdown cells revealed increased expression of miR‐200a, whereas miR‐19a/b remained unaffected (Supplementary Fig S2B and C). Expression of miR‐141 could not be reliably detected. Luciferase assays employing _St3gal5‐_3′‐UTR revealed reduced expression of luciferase reporter in Zeb1 knockdown cells (Fig 2D), compatible with increased expression of miR‐200a. Site‐directed mutagenesis of the conserved miR‐141/200a binding site partially antagonized the loss of luciferase signal in Zeb1 knockdown cells as did exclusive mutation of the non‐conserved miR‐141/200a binding site, though to a lesser extent. Mutating both sites blocked the decrease of luciferase activity upon Zeb1 knockdown (Fig 2D). Finally, a miR‐200a inhibitor impaired the decrease of luciferase activity in Zeb1 siRNA‐transfected cells (Fig 2D, right side).
Together, these results imply that Zeb1 exerts a dual‐regulatory impact on St3gal5 expression including St3gal5 promoter and St3gal5 3′‐UTR, the latter involving miRNA‐200a. Several observations independent from this study suggest that Zeb1 may control expression of St3gal5 in various additional cell types. For example, ChIP data deposited at ENCODE 12 (Hudson Alpha Institute for Biotechnology, Richard Myers) suggest Zeb1 binding to St3gal5 promoter regions in B lymphocytes. Moreover, expression profiling of renal cell carcinoma samples with reduced expression of miR141/200a reveals increased expression of St3gal5 and Zeb1 13.
Expression of Zeb1 and St3gal5 mRNA is also increased in human lung cancer cells (H358 cells) undergoing Twist‐induced EMT‐like progression as implicated by gene expression profiling 14. This pattern is in line with our previous notion that Zeb1 regulates the expression of St3gal5. However, to further experimentally assess this, we repressed Zeb1 in H358 cells and analysed the expression of St3gal5 as well as GSLs. As shown, knockdown of Zeb1 resulted in decreased expression of St3gal5 mRNA (Supplementary Fig S2D) and reduced expression levels of a‐series GSLs (e.g. GM3 and GM2), similar to repression of St3gal5 (Supplementary Fig S2D and E). However, unlike in NM18 cells, the repression of St3gal5 in H358 did not fully mimic changes in GSL expression imposed by Zeb1 repression as exemplified by the stronger elevation of LacCer as well as globotriaosylceramide (Gb3Cer) in St3gal5 knockdown cells. These results imply that in H358 cells Zeb1 may affect the expression of additional enzymes besides GM3 synthase, which may continuously metabolize substrates, such as LacCer or Gb3Cer.
The differences between H358 and NM18 cells in GSL expression upon Zeb1/St3gal5 repression are consistent with the notion that overall shifts in GSL expression patterns are the result of cell type‐specific enzymatic repertoires, which determine the overall metabolite accumulation and utilization.
Repression of St3gal5 fosters expression of junction‐associated proteins and elevates intercellular adhesion
Zeb1 represses the expression of junction‐related proteins 15, and knockdown of Zeb1 suffices to elevate intercellular adhesion [8](/article/10.15252/embr.201439333#ref-CR8 "Feuerborn A, Mathow D, Srivastava PK, Gretz N, Grone HJ (2014) Basonuclin‐1 modulates epithelial plasticity and TGF‐beta1‐induced loss of epithelial cell integrity. Oncogene doi: https://doi.org/10.1038/onc.2014.54
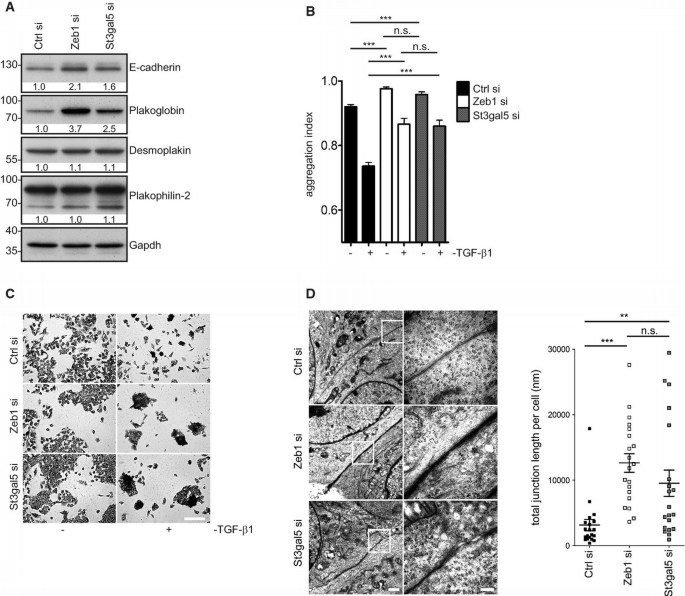
"). We thus tested next whether repression of St3gal5, like Zeb1, may affect the expression of junction‐related proteins and intercellular adhesion [15](/article/10.15252/embr.201439333#ref-CR15 "Aigner K, Dampier B, Descovich L, Mikula M, Sultan A, Schreiber M, Mikulits W, Brabletz T, Strand D, Obrist P et al (2007) The transcription factor ZEB1 (deltaEF1) promotes tumour cell dedifferentiation by repressing master regulators of epithelial polarity. Oncogene 26: 6979–6988"), [16](/article/10.15252/embr.201439333#ref-CR16 "Eger A, Aigner K, Sonderegger S, Dampier B, Oehler S, Schreiber M, Berx G, Cano A, Beug H, Foisner R (2005) DeltaEF1 is a transcriptional repressor of E‐cadherin and regulates epithelial plasticity in breast cancer cells. Oncogene 24: 2375–2385"). Knockdown of St3gal5 partly mimicked the effects of Zeb1 repression and resulted in increased protein expression of E‐cadherin as well as plakoglobin (Fig [3](/article/10.15252/embr.201439333#Fig3)A, [Supplementary Fig S3A](/article/10.15252/embr.201439333#MOESM1)), findings also reproducible in H358 cells ([Supplementary Fig S3B](/article/10.15252/embr.201439333#MOESM1)).Figure 3
St3gal5, like Zeb1, modulates epithelial cell adhesion
A. Western blot of E‐cadherin, plakoglobin, desmoplakin 1 and 2 and plakophilin‐2 in cells transfected with Zeb1‐ or St3gal5‐siRNA (72 h).
B. Hanging‐drop assays of Zeb1‐ and St3gal5‐repressed cells. Cells were transfected with siRNAs (48 h) and stimulated with TGF‐β1 for another 24 h. Mean ± SD, number of drops analysed per condition = 5, ***P ≤ 0.001, one‐way ANOVA with Tukey's Multiple Comparison Test. The assay was independently repeated at least twice with similar outcome.
C. Giemsa staining of cells transfected as in (B). Scale bar: 200 μm.
D. Electron microscopy of cell–cell contacts in Zeb1‐ and St3gal5‐suppressed cells (72 h). Scale bars: 1,000 nm (left panel), 250 nm (right panel). Total lengths of junctions between adjacent cells were measured in 20 randomly selected areas per condition. **P ≤ 0.01, ***P ≤ 0.001.
The increased expression of E‐cadherin and plakoglobin was paralleled by elevated intercellular adhesion in Zeb1‐ and St3gal5‐repressed cells as assessed by hanging‐drop assays, which became especially evident upon antagonizing intercellular adhesion by TGF‐β1 stimulation (Fig 3B and C).
These findings were further supported by ultra‐structural analyses (Fig 3D, left panel), which revealed an increase in total junction length (Fig 3D, right panel) as well as an increase in average length per junction between interfacing cells (Supplementary Fig S3C) upon Zeb1 or St3gal5 knockdown.
These findings demonstrate that suppression of St3gal5, like knockdown of Zeb1, elevates the expression of cell junction components as well as intercellular adhesion and implies that Zeb1 may partially affect these features by controlling GSL expression.
Overexpression of enzymatically active St3gal5 partially impairs elevated cell adhesion of Zeb1‐repressed cells
Our results suggested that Zeb1 may modulate cell–cell adhesion via St3gal5‐dependent control of GSL metabolism. To further assess a causal relation between Zeb1, St3gal5, cell–cell adhesion and GSLs, we tested whether overexpression of enzymatically active or inactive St3gal5 antagonizes elevated cell–cell adhesion of Zeb1‐knockdown cells.
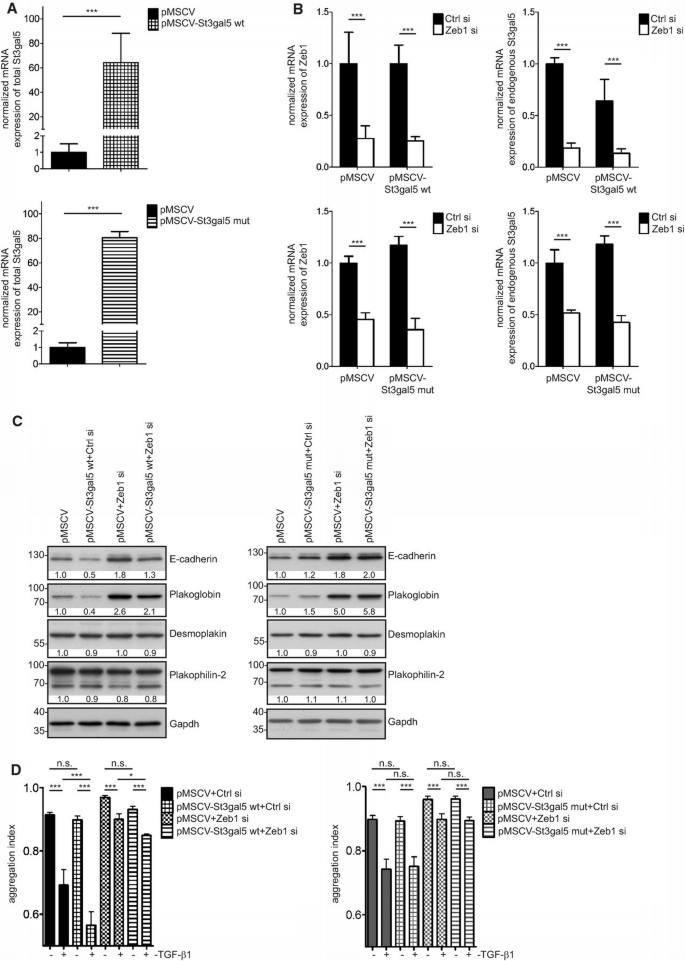
NM18 cells stably overexpressing wild‐type St3gal5 (St3gal5‐wt) (Fig 4A, upper panel) revealed decreased expression levels of LacCer (Supplementary Fig S4A and B) as well as 0‐series lipids (GM1b) and maintained expression of a‐series GSLs despite Zeb1 knockdown (Supplementary Fig S4A, right panel). Also, LacCer remained decreased upon Zeb1 knockdown (Supplementary Fig S4A, left panel and b) despite the decrease of endogenously expressed St3gal5 upon Zeb1 repression (Fig 4B, upper panels). In other words, alterations in GSL expression imposed by Zeb1 repression and subsequent decrease of endogenous St3gal5 expression are overcome by exogenously overexpressed St3gal5‐wt.
Figure 4
Overexpression of St3gal5 mitigates Zeb1‐mediated increase in cell adhesion
A. qRT–PCR‐based analysis of mRNA expression of total St3gal5 in cells stably overexpressing wild‐type St3gal5 (pMSCV‐St3gal5 wt, upper panel) and inactive St3gal5 (pMSCV‐St3gal5 mut, lower panel) compared to control cells (pMSCV) (n = 4). Mean ± upper/lower limit, n = 4, ***P ≤ 0.001, unpaired _t_‐test.
B. qRT–PCR‐based analysis of mRNA expression of Zeb1 (left) and endogenous St3gal5 (right) upon Zeb1 repression in cells overexpressing wild‐type (upper panel) or mutant St3gal5 (lower panel) (72 h). Mean ± upper/lower limit, n = 4, ***P ≤ 0.001, one‐way ANOVA with Tukey's Multiple Comparison Test.
C. Western blot analysis of E‐cadherin, plakoglobin, desmoplakin 1 and 2 and plakophilin‐2 in wild‐type (left panel) or mutant St3gal5‐overexpressing cells (right panel) (72 h).
D. Relative quantification of intercellular adhesion by hanging‐drop assays in cells overexpressing wild‐type (left panel) or mutant St3gal5 (right panel) ± Zeb1 suppression (48 h) ± TGF‐β1 stimulation (24 h). Mean ± SD, number of drops analysed per condition = 5, ***P ≤ 0.001, *P ≤ 0.05, one‐way ANOVA with Tukey's Multiple Comparison Test. The assay was independently repeated at least twice with similar outcome.
Phenotypically, overexpression of St3gal5‐wt resulted in reduced expression of E‐cadherin and plakoglobin (Fig 4C, left panel) and hanging‐drop assays revealed an enhanced sensitivity towards TGF‐β1‐mediated disruption of cell–cell adhesion. Repression of Zeb1 partially antagonized reduced intercellular adhesion of St3gal5‐overexpressing cells in the context of TGF‐β1 induction (Fig 4D, left panel).
In contrast, NM18 cells overexpressing mutant St3gal5 (St3gal5‐mut) (Fig 4A, lower panel), which also showed decreased expression of endogenous St3gal5 upon Zeb1 knockdown (Fig 4B, lower panel), were incapable of counteracting lipid changes imposed by the repression of Zeb1 (Supplementary Fig S4C). Neither did they reveal decreased levels of E‐cadherin nor plakoglobin (Fig 4C, right panel). Additionally, these cells were not sensitized towards TGF‐β1‐induced loss of intercellular adhesion (Fig 4D, right panel).
These phenotypic differences between cells overexpressing wild‐type versus mutant St3gal5 further support the conclusion that the altered cell–cell adhesion and expression levels of junction components are determined by Zeb1‐ and St3gal5‐dependent expression changes of GSLs.
However, overexpression of wild‐type St3gal5 only mitigates but does not block the elevation of cell–cell adhesion upon Zeb1 knockdown, stressing that the control over GSL expression forms only a part of the repertoire of Zeb1 to influence cell–cell adhesion.
The Zeb1–St3gal5 regulatory axis promotes expression of a‐series GSLs during TGF‐β1‐induced EMT‐like progression
As previously outlined, a characterizing aspect of EMT‐like processes is the impairment of intercellular adhesion. Based on our earlier observations of increased expression of St3gal5 (and Zeb1) upon TGF‐β1 stimulation (Fig 2B), we speculated that TGF‐β1‐induced EMT‐like progression of NM18 cells may be accompanied by elevated expression of a‐series GSLs.
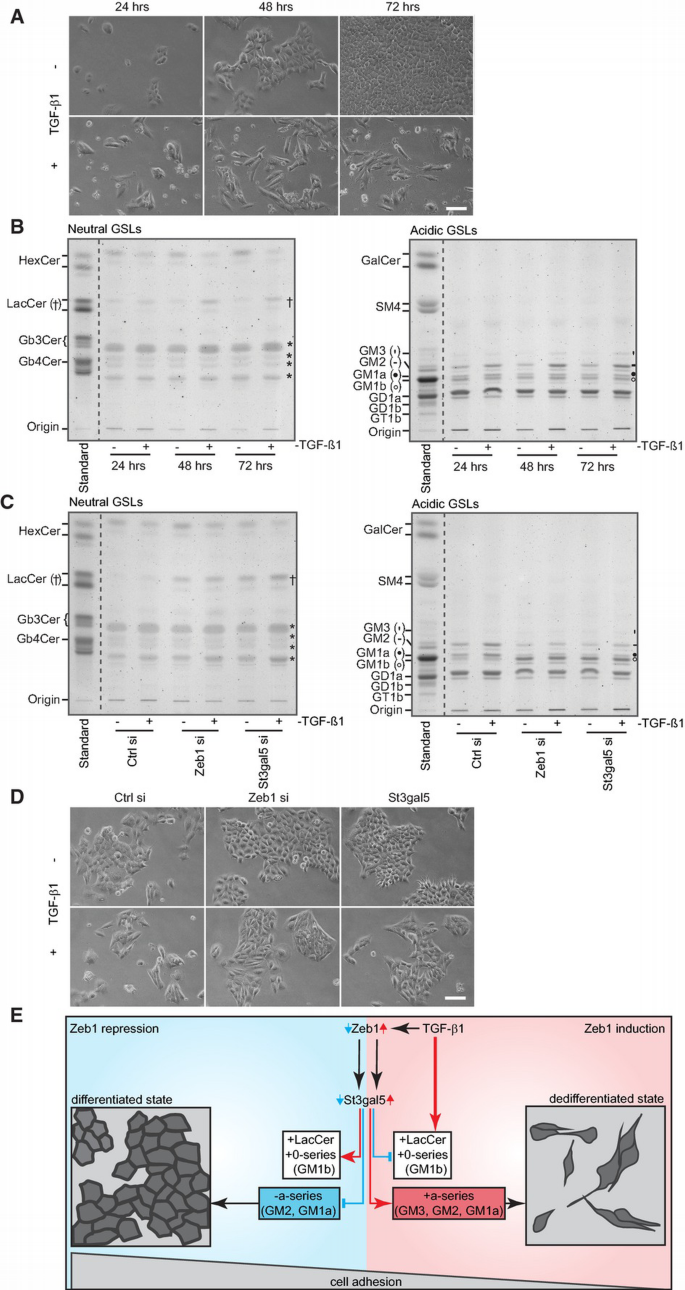
As shown, NM18 cells undergoing EMT‐like progression (Fig 5A) indeed expressed elevated levels of GM1a, GM2 and GM3 (Fig 5B, right panel). Additionally, however, they revealed a slight increase in GM1b (Fig 5B, right panel) and clearly accumulated LacCer as well as decreased levels of hexosylceramide (HexCer) (Fig 5B, left panel). Repression of Zeb1 or St3gal5 (± TGF‐β1 stimulation) antagonized elevation of a‐series GSLs GM1a as well as GM2 and expectedly accumulated LacCer as well as GM1b (Fig 5C).
Figure 5
The Zeb1–St3gal5 axis promotes expression of a‐series GSLs during TGF‐β1‐induced EMT‐like progression
A. Bright‐field microscopy of cells treated with TGF‐β1 for indicated times. Scale bar: 200 μm.
B. TLC‐based analyses of neutral and acidic GSLs of NM18 cells treated with TGF‐β1 as in (A). TGF‐β1‐treated cells reveal accumulation of LacCer (†) and decrease of HexCer in the neutral GSL fraction. *indicates no GSL. Expression of acidic a‐series GSLs GM3 (′), GM2 (−), GM1a (•) and of 0‐series lipid GM1b (○) increased upon TGF‐β1 stimulation.
C. Repression of Zeb1 or St3gal5 partially impaired TGF‐β1‐induced accumulation of acidic GSLs of the a‐series (GM1a (•), GM2 (−)). Cells were transfected with indicated siRNAs (48 h) and treated with TGF‐β1 (24 h). Cells accumulate LacCer (†) and GM1b (○) upon Zeb1 and St3gal5 repression.
D. Bright‐field microscopy of cells repressed for Zeb1 or St3gal5 (48 h) ± TGF‐β1 (24 h). Scale bar: 200 μm.
E. Scheme summarizing the effects of Zeb1 on expression of GSLs. Repression of Zeb1 decreases expression of St3gal5 and results in accumulation of LacCer and 0‐series GSLs (e.g. GM1b). Concomitantly, levels of a‐series GSLs are reduced and cell–cell adhesion is increased. Conversely, Zeb1 promotes the expression of St3gal5 and a‐series GSLs (GM3, GM2 and GM1a) during TGF‐β1‐induced EMT‐like progression with alleviating effects on intercellular adhesion. Despite increased expression of St3gal5, TGF‐β1‐stimulated cells accumulate LacCer (and some GM1b), possibly as a consequence of elevated turnover of HexCer.
The alterations in GSL expression in the absence of TGF‐β1 stimulation were phenotypically paralleled by a pronounced epithelial morphology, as indicated by the ‘cobblestone’‐like arrangement of cells within sheets (Fig 5D). An augmented alignment of cells within sheets was also evident in H358 cells upon Zeb1 and St3gal5 knockdown (Supplementary Fig S5A), though this was less pronounced than in NM18 cells.
In the presence of TGF‐β1, Zeb1‐ and St3gal5‐repressed NM18 cells became partially elongated but maintained sheet structures (Fig 5D), in line with cells failing to detach from each other.
The identified changes in GSL expression in NM18 cells undergoing EMT‐like progression are coherent based on the following interpretation—an increased turnover of HexCer results in the accumulation of LacCer. LacCer is preferably metabolized into a‐series GSLs with some leak into the 0‐series, which is consistent with enhanced expression/activity of St3gal5 (GM3 synthase) and Zeb1 upon TGF‐β1 stimulation (Fig 5E).
Previously, Kim et al showed that lens epithelial cells express increased levels of St3gal5 and notably accumulate a‐series GSL GM3 within 24 h of TGF‐β1‐induced EMT‐like progression. Further, knockdown of St3gal5 in these cells strongly impairs activation of Smad2 and Smad3, suggesting that TGF‐β1 receptor activation and signalling require GM3 5. In NM18 cells, however, GM3 accumulation occurs after prolonged exposure to TGF‐β1 and is merely part of several alterations found. Moreover, both Smad2 and Smad3 became strongly activated upon exposure to TGF‐β1 in Zeb1‐ or St3gal5‐repressed cells, though a slight reduction in Smad2 phosphorylation was notable (Supplementary Fig S5B). Together, these patterns may emphasize the functional and regulatory diversity of GSL expression in different systems, despite a similar induction of St3gal5 expression upon TGF‐β1 signalling.
The outlined pattern of GSL expression and the increase of St3gal5 in response to TGF‐β1 in NM18 cells differ from data from Guan et al, who noted unaltered expression of St3gal5 and reduced GM2 (and Gg4/GA1) in a related cell model (NMuMG cells) 4, 17. The reasons for these differences remain unknown but may be associated with the inherent cellular heterogeneity of NMuMG cultures, which has previously been noted to partially obscure comparability between studies. NMuMG cells contain morphologically and behaviourally distinct populations of cells 6, 18 with different subpopulations potentially dominating different cultures. That is why this study uses NM18 cells, a single‐cell derived culture that maintains stable epithelial morphology 6.
Despite the divergent changes in GSL expression patterns and their reported various implications in different cells, we assume that they are all functionally united by affecting the organization of the cellular membrane. GSLs are known to separate membranes into specialized domains. These ‘GSL microdomains’ have been implicated in diverse cellular processes, such as those evoked during EMT‐like processes, including receptor signalling 5, migration 4, 5 and cell–cell adhesion (this study).
With regard to intercellular adhesion, GSLs are thought to participate in the formation of ‘glycosynapses’, GSL microdomains in which carbohydrate‐mediated _trans‐_interactions of GSLs with GSLs or proteins of adjacent cells 19 mediate cell–cell adhesion.
Here, we suggest that the loss of intercellular adhesion during TGF‐β1‐induced EMT‐like progression is partially mediated via the engagement of Zeb1‐St3gal5 and subsequent fostered expression of a‐series GSLs. Though we can functionally not exclude changes in lipid expression that remained undetected in our study or combinatory effects of different lipids, the expression of a‐series GSLs seems associated with elevated or reduced intercellular adhesion (Fig 5E).
Future work will need to test our assumption that Zeb1‐ or St3gal5‐mediated expression changes of GSLs primarily modify plasma membrane organization, in particular GSL microdomains (‘glycosynapses’), accounting for altered intercellular adhesion.