Revealing Callisto’s Carbon-rich Surface and CO2 Atmosphere with JWST (original) (raw)
The Galilean moon Callisto has one of the most ancient surfaces in the solar system (>4 Ga, e.g., Zahnle et al. 2003). As first seen by Voyager during its flyby of the Jovian system in 1977, the surface of Callisto is heavily cratered with minimal evidence for endogenic modification, unlike the other Galilean moons that each display ubiquitous evidence for recent resurfacing. The arrival of the Galileo orbiter in 1996 revealed the surfaces of the Galilean moons in stunning detail (e.g., Showman & Malhotra 1999). Observed during multiple close flybys, Callisto’s surface geology is dominated by heavily degraded craters, large mass wasting deposits, and fields of bright, icy pinnacles protruding from a smooth blanket of dark material that is pervasive across Callisto’s surface (Moore et al. 2004).
Near-infrared, ground-based observations determined that Callisto’s surface is primarily composed of H2O ice mixed with a dark component that could include organics, phyllosilicates, and other hydrated minerals (e.g., Pollack et al. 1978; Clark 1980; Calvin & Clark 1991), such as ammonium- (NH4) bearing compounds (Calvin & Clark 1993). Reflectance spectra collected by the Near Infrared Mapping Spectrometer (NIMS) on Galileo confirmed the presence of H2O ice mixed with dark material, and also provided the first detection of sulfur-bearing species and large amounts of solid-state CO2 (Carlson et al. 1996). Furthermore, NIMS detected subtle absorption features between 3.3 and 3.5 _μ_m that may result from C–H stretching modes of short-chain aliphatic organics, as well as broad bands centered near 3.88, 4.02, and 4.57 _μ_m, likely resulting from carbon- and/or sulfur-bearing species (McCord et al. 1997, 1998a). The possible presence of these components suggests that dark material on Callisto includes amorphous carbon and complex organic residues perhaps similar to “tholins” generated in the laboratory (e.g., Cruikshank et al. 1991; Khare et al. 1993). In an off-limb scan above the leading hemisphere, NIMS also detected gaseous emissions from a tenuous CO2 atmosphere, 5–40 km above Callisto’s surface (Carlson 1999), further highlighting Callisto’s C-rich environment.
The large amount of CO2 on Callisto’s surface, the presence of CO2 gas, and a mean subsolar temperature of 165 K (Spencer 1987), at which CO2 ice on Callisto would be thermodynamically unstable (e.g., Brown & Ziegler 1980; Fray & Schmitt 2009 and references therein), have been implicated in crater degradation and icy pinnacle formation processes on Callisto. In this scenario, H2O ice and crustal CO2 ice sublimate, spurring the disaggregation of crater rims and triggering large mass wasting events (Moore et al. 1999, 2004; Howard & Moore 2008; White et al. 2016; Steckloff et al. 2022). CO2 molecules sublime and are then transported to ice-rich, reflective terrains where they might condense in cold traps such as H2O ice-rich remnant crater rim segments and other high standing terrains. Callisto’s ubiquitous dark material could therefore result from widespread, sublimation-driven erosion of crustal sources of CO2, building up a lag deposit rich in carbonaceous material mixed with hydrated minerals.
Exogenic processes are also likely contributing to Callisto’s surface inventory of CO2 and other carbon oxides. Charged particle interactions with C-rich, icy deposits on Callisto’s surface drive radiolytic chemistry, likely resulting in a carbon cycle, including production of CO2 molecules. The “bullseye” shaped distribution of solid-state CO2 detected by NIMS, with band depths peaking near Callisto’s trailing side apex, is consistent with CO2 generated by radiolytic interactions between fast rotating plasma in the Jovian magnetosphere and C-rich material and H2O ice in Callisto’s regolith (e.g., Hibbitts et al. 2000). A wide variety of laboratory experiments demonstrate that CO2 is efficiently produced at the interface between solid elemental carbon (amorphous carbon, residues from energetic processing of C-bearing ices, bitumens, etc.) and H2O ice (e.g., Spinks & Woods 1990; Mennella et al. 2004; Gomis & Strazzulla 2005; Strazzulla & Moroz 2005; Raut et al. 2012). In contrast, solid-state CO2 on Callisto’s leading hemisphere appears to be spatially associated with craters and their ejecta, consistent with a crustal source of CO2 (Hibbitts et al. 2002) and/or cold trapping of radiolytically produced CO2 on relatively bright crater floors, rims, and ejecta blankets. Supporting a native origin for CO2, satellite formation models indicate that Callisto accreted large amounts of this molecule as it formed in the Jovian subnebula (e.g., Mousis & Alibert 2006; Melwani Daswani et al. 2021). Whether radiolytic or crustal sources dominate Callisto’s observed surface inventory of CO2 is uncertain.
The solid-state CO2 feature is centered near 4.258 _μ_m in NIMS data (Carlson et al. 1996), notably offset from the asymmetric stretch fundamental (_v_3) of crystalline CO2 ice measured in the laboratory (∼4.27 _μ_m; e.g., Hansen 1997; Quirico & Schmitt 1997). This 4.27 _μ_m band is exhibited by CO2 ice produced by energetic processing of C- and O-bearing frozen gases, as well as after energetic processing of H2O ice deposited on top of solid carbonaceous materials at low temperatures (<100 K; e.g., Raut et al. 2012; Jones et al. 2014). CO2 ice is not stable at Callisto’s peak surface temperatures, and instead, CO2 molecules are likely bound to more refractory components such as dark material possibly including salts (Villanueva et al. 2023a) or H2O ice (McCord et al. 1997, 1998a). Landscape evolution modeling of crater degradation and icy pinnacle formation, however, rests on the assumption that Callisto’s crust includes a substantial abundance of CO2 ice or did so in the geologic past (10% crustal content, White et al. 2016). Consequently, spectral tracers of recently exposed deposits rich in crustal CO2 ice might be present on the ancient surface of Callisto.
If both complexed CO2 and crystalline CO2 ice are present, they could express a double-lobed CO2 feature, with bands centered near 4.25 and 4.27 _μ_m, as is the case on Europa (Trumbo & Brown 2023; Villanueva et al. 2023a). However, NIMS’ coarse resolving power (R ∼ 40–200 between 0.7 and 5.3 _μ_m; Carlson et al. 1992) was too low to disentangle the spectral signatures of these two features and likely would have convolved them into a single band, possibly explaining the ∼4.26 _μ_m feature it detected. Similarly, NIMS was unable to resolve the individual rovibrational emission lines of CO2 gas in Callisto’s atmosphere, instead detecting a broad, two-lobed peak spanning 4.2 to 4.3 _μ_m (Carlson 1999). Analyses of absorption bands detected by NIMS were also limited by its low sensitivity at wavelengths ≳ 4 _μ_m and the numerous ∼0.125 _μ_m wide filter junctions between 3 and 5 _μ_m that fully or partly overlapped several spectral features of interest, including subtle features between 3.3 and 3.5 _μ_m, the broad 3.88 and 4.02 _μ_m bands, and another subtle band near 4.36 _μ_m that might result from the heavy stable isotope 13CO2 (McCord et al. 1998a).
Confirming the spectral features detected by NIMS with higher spectral resolution, ground-based observations (R ∼ 2500) has proven challenging due to absorption by Earth’s atmosphere. Such observations have confirmed the presence of the wide 4.02 and 4.57 _μ_m bands (Cartwright et al. 2020), but strong absorption by telluric CO2 has prevented the analysis of solid-state and gaseous CO2 features between 4.2 and 4.4 _μ_m. Spectral lines for telluric CH4 and other gases overprint the wavelength range of the subtle bands detected by NIMS between 3.3 and 3.5 _μ_m, complicating their analysis.
The NIRSpec spectrograph on the James Webb Space Telescope (Gardner et al. 2023) is uniquely capable of investigating CO2 and possible organic features, as demonstrated by the recent detection of a double-lobed CO2 feature on Europa (Villanueva et al. 2023a) and high sensitivity characterization of CO2 on Ganymede (Bockelée-Morvan et al. 2024). Here, we report JWST/NIRSpec spectral cubes (G395H) of Callisto (Figure 1). These data reveal Callisto’s spectral properties at dramatically higher spectral resolution and signal-to-noise ratios (S/N) compared to existing NIMS or ground-based data sets. We used these NIRSpec cubes to measure the spectral properties and spatial distribution (∼320 km spaxel−1) of solid-state and gaseous CO2 and investigate a suite of other spectral features, some of which are reported here for the first time, including absorption bands that might result from CO and carbonyl sulfide (OCS). Our results shed new light on the evolution of Callisto’s surface geology and composition. Our findings also highlight JWST’s capabilities for analyzing the spectral properties of CO2, an important molecule in the chemical cycles operating on the Galilean moons and other icy bodies observed across the outer solar system (e.g., Brown & Fraser 2023; Pinto et al. 2023; Trumbo & Brown 2023; Villanueva et al. 2023a; Wong et al. 2023, 2024; Bockelée-Morvan et al. 2024; De Pra et al. 2024; Emery et al. 2024; Markwardt et al. 2024; Protopapa et al. 2024; Souza-Feliciano et al. 2024).
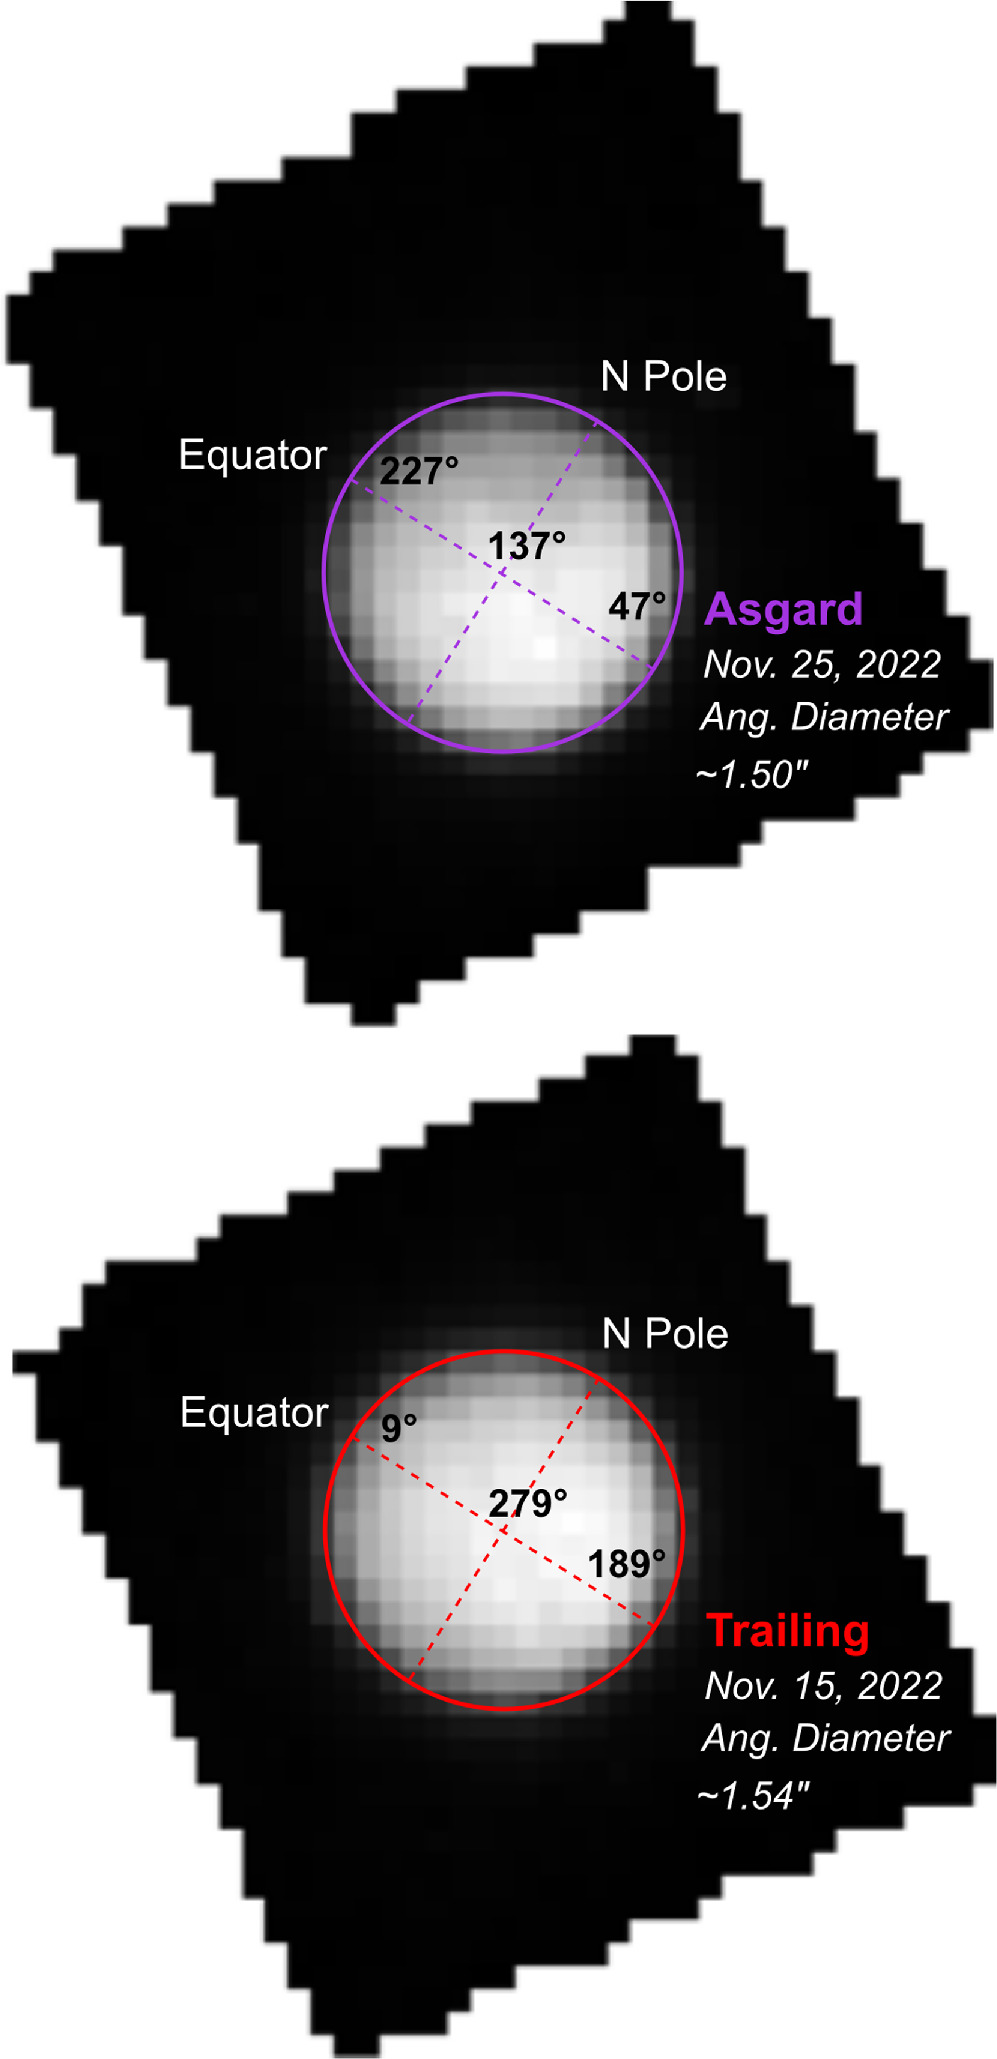
Figure 1. Raw JWST/NIRSpec spectral cubes (G395H) of Callisto. Dashed lines show the approximate location of Callisto's equator and poles. Subobserver longitudes for the center and limbs of each cube are labeled.
Download figure:
Standard imageHigh-resolution image
2.1. Observations and Data Reduction
Callisto was observed with the G395H grating of the NIRSpec spectrograph (2.85–5.35 _μ_m, R ∼ 2700) on JWST as part of the General Observer Program 2060 (Cartwright et al. 2021). These observations occurred on 2022 November 15th and 25th when the subobserver point was near longitude 279°W (trailing hemisphere) and 137°W (leading hemisphere, roughly centered on the Asgard impact basin), respectively. Data were collected using NIRSpec’s integral field unit (IFU) that has a 3″ × 3″ field of view, placing roughly 157 spaxels (0 1 × 01 dimensions) across Callisto’s disk (Figure 1). Each observation had a total exposure time of ∼128 s, spread over four dithers (∼32 s each) that sample different parts of the detector, using the NRSRAPID readout mode (see Jakobsen et al. 2022 for more details). G395H data have a ∼0.1 _μ_m wide unrecoverable gap that shifts between 4 and 4.2 _μ_m across each of the 29 image slices comprising NIRSpec’s IFU. For extended targets like Callisto, the wavelength range of the gap therefore changes across its resolved disk. Consequently, some of the wavelength range covered by the gap can be recovered by extracting spectra from smaller subsets of spaxels on its disk, effectively shrinking the gap in these Callisto data (∼4.06–4.13 _μ_m).
All data were downloaded from the Mikulski Archive for Space Telescopes (MAST) at the Space Telescope Science Institute, and they can be accessed via doi:10.17909/w8qj-5v21. These data were processed using the JWST Science Calibration Pipeline v1.9.4 with CRDS context jwst_1041.pmap (Bushouse et al. 2023). Additional custom codes were developed to combine dithered frames and remove bad pixels. 14 The four dithers were georeferenced to Callisto’s disk and then median combined, which assisted in removing abnormal pixels. At each spaxel, we separated the reflectance and thermal signatures of the emission by fitting a two-component model consisting of a realistic solar model and a Planck source function for the thermal radiation. The solar model was generated with the Planetary Spectrum Generator (PSG; Villanueva et al. 2018, 2022). PSG accounts for all Doppler shifts and uses the high-quality ACE solar spectrum (e.g., Hase et al. 2010) to integrate the solar Fraunhofer lines and adopts the Kurucz (2005) solar model to replicate the continuum intensity. After removing the thermal component, reflectance spectra at each spaxel were determined by dividing the calibrated fluxes with a solar model scaled by the projected spatial size of the pixel and corrected for the distances between the Sun and Callisto, and JWST and Callisto, at the time of each observation. A similar process was used to analyze NIRSpec IFU cubes of the Galilean moon Europa (Villanueva et al. 2023a) and the Saturnian moon Enceladus (Villanueva et al. 2023b). Finally, the spaxels covering Callisto’s disk were summed to generate disk-integrated spectra for the trailing and Asgard observations, hereon referred to as the trailing and leading hemisphere integrated spectra, respectively. The uncertainties for these integrated spectra were estimated by standard error propagation routines that utilize the underlying calibrated uncertainties for each spaxel (as reported by the pipeline).
2.2. Band Parameter Measurements for the Integrated Spectra
We identified eleven absorption features for analysis in the integrated spectra of Callisto’s trailing and leading hemisphere (Table 1). We measured the band area and depth for each of these eleven features with a band parameter program used previously to measure absorption features in icy satellite spectra (e.g., Cartwright et al. 2022, 2023). The program identifies the continuum within 0.005–0.01 _μ_m on both sides of each band and fit it with a line, then divides each band by its continuum. The resulting continuum-divided bands were visually inspected prior to measuring the area and depth of each feature. The program measured the depth of each continuum-divided band by calculating the mean reflectance within ±0.002–0.003 μ_m of each band center (Table 1) and propagating errors. The band center reflectances were then subtracted from 1 to calculate the band depth for each feature. The program used the trapezoidal rule to calculate band areas and ran Monte Carlo simulations to estimate the 1_σ uncertainties by resampling the errors of all channels within the wavelength range of each absorption band.
Table 1. Band Measurements for the Integrated Spectra
| Band Name | Band Center | Band Wavelength Range (_μ_m) | Hemisphere | Band Depth | Band Area | >3_σ_ Band Depth and Area? |
|---|---|---|---|---|---|---|
| (_μ_m) | (_μ_m) | (%) | (10−4 _μ_m) | |||
| 3.28 _μ_m | 3.278 | 3.223–3.319 | Leading | 1.27 ± 0.29 | 4.95 ± 0.56 | Yes |
| Trailing | 1.32 ± 0.18 | 4.30 ± 0.31 | Yes | |||
| 3.43 _μ_m | 3.428 | 3.410–3.445 | Leading | 1.05 ± 0.24 | 1.63 ± 0.27 | Yes |
| Trailing | 0.97 ± 0.20 | 1.28 ± 0.19 | Yes | |||
| 3.51 _μ_m | 3.512 | 3.494–3.529 | Leading | 0.63 ± 0.19 | 0.91 ± 0.24 | Yes |
| Trailing | 0.90 ± 0.16 | 0.92 ± 0.18 | Yes | |||
| 3.72 _μ_m | 3.720 | 3.686–3.769 | Leading | 0.07 ± 0.20 | 0.039 ± 0.35 | No |
| Trailing | 0.76 ± 0.17 | 3.10 ± 0.28 | Yes | |||
| 4.02 _μ_m a | 4.012 | 3.950–4.050 | Leading | 2.67 ± 0.15 | 12.80 ± 0.28 | Yes |
| Trailing | 0.64 ± 0.27 | 1.26 ± 0.26 | No | |||
| 4.25 _μ_m | L4.255 | 4.208–4.305 | Leading | 18.90 ± 0.16 | 83.54 ± 0.35 | Yes |
| T4.250 | Trailing | 33.23 ± 0.46 | 148.92 ± 0.21 | Yes | ||
| 4.30 _μ_m b | 4.295 | 4.293–4.302 | Leading | 1.16 ± 0.45 | 0.19 ± 0.11 | No |
| Trailing | 1.48 ± 0.29 | 0.34 ± 0.09 | Yes | |||
| 4.38 _μ_m | 4.382 | 4.335–4.415 | Leading | 2.31 ± 0.27 | 7.54 ± 0.34 | Yes |
| Trailing | 2.86 ± 0.20 | 8.76 ± 0.27 | Yes | |||
| 4.57 _μ_m | 4.565 | 4.487–4.619 | Leading | 5.98 ± 0.21 | 40.53 ± 0.42 | Yes |
| Trailing | 2.78 ± 0.19 | 20.87 ± 0.35 | Yes | |||
| 4.67 _μ_m | 4.670 | 4.648–4.699 | Leading | 0.35 ± 0.20 | 0.89 ± 0.28 | No |
| Trailing | 0.71 ± 0.16 | 1.70 ± 0.21 | Yes | |||
| 4.92 _μ_m | 4.922 | 4.835–4.969 | Leading | 0.87 ± 0.21 | 7.27 ± 0.48 | Yes |
| Trailing | 1.61 ± 0.21 | 11.70 ± 0.37 | Yes | |||
| 5.00 _μ_m c | 4.996 | 4.975–5.010 | Leading | 2.49 ± 0.19 | 2.32 ± 0.25 | Yes |
| Trailing | 1.91 ± 0.26 | 1.61 ± 0.21 | Yes | |||
| 5.04 _μ_m c | 5.042 | 5.025–5.056 | Leading | 1.01 ± 0.22 | 1.44 ± 0.23 | Yes |
| Trailing | 0.91 ± 0.23 | 1.34 ± 0.18 | Yes | |||
| 5.07 _μ_m c | 5.074 | 5.060–5.084 | Leading | 1.12 ± 0.24 | 1.45 ± 0.21 | Yes |
| Trailing | 1.06 ± 0.21 | 1.39 ± 0.16 | Yes |
Notes. Leading (L); trailing (T).
aBand measured using smaller subset of 18 spaxels (leading) and 15 spaxels (trailing). bPossible residual solar line. cPossible artifact.
Download table as: ASCIITypeset image
2.3. Spatially Resolved Band Parameter Maps
To investigate the spatial distribution of different species, we generated spectral maps using the individual spaxels in the two thermally corrected, dither-averaged cubes. We focused our analysis on the three non-H2O ice features with the strongest bands, centered near 4.25, 4.38, and 4.57 μ_m, previously attributed to 12CO2 (Carlson et al. 1996), 13CO2 (McCord et al. 1998a), and other C-bearing species (McCord et al. 1997; Johnson et al. 2004; Cartwright et al. 2020), respectively. We generated continuum-divided band depth and band center maps for these three features. The band-fitting procedure was conducted with the Python lmfit package (Newville et al. 2014). We fit a line to the continuum of each band in each spaxel, and then divided by the modeled continuum. After manually inspecting the quality of the resulting continuum-divided bands in each spaxel, the program determined their central wavelength positions, using Gaussian fits to each band. To estimate 1_σ uncertainties for the band depth and center measurements, we used a least squares minimization approach (error maps shown in Figures A1–A3).
For the 4.25 _μ_m 12CO2 band, we utilized a two-Gaussian approach to better capture subtle shifts in the band center. For the 4.38 _μ_m 13CO2 band, we used a similar two-Gaussian fit, where one Gaussian fit the entire width of the band (4.34–4.42 _μ_m), and another Gaussian fit a narrower and deeper feature centered near 4.38 _μ_m, which overprints the broad band in a large number of (but not all) spaxels. Consequently, we mapped the distribution of the 4.38 _μ_m 13CO2 band both with and without the narrow peak feature (band depth map for the 13CO2 peak feature is shown in Figure A4). The 4.57 _μ_m bands only required single-Gaussian fits to conduct satisfactory band depth and band center measurements.
Once the band parameter measurements were finalized, we projected the data onto a regularly spaced latitude/longitude grid. To do this, we determined the center of Callisto’s disk in the dither-averaged cubes and registered this central point to a specific latitude and longitude, based on the approximate angular radius and north pole position angle of Callisto at the midobservation time. The latitude and longitude coordinates of each spaxel vertex were then used to form a projectable polygon, using the Python shapely package (Gillies et al. (2023). The retrieved measurement parameters and errors for each spaxel, and their map-projected polygons, were stored in separate arrays within a GeoPanda data series (Jordahl et al. 2021) for each of the three features we mapped and report here (Figure 2). Because of higher noise and poor geometric sampling in spaxels near the edges of Callisto’s disk, we only used spaxels within 057 of Callisto’s disk center (red polygons in Figure 2) and omitted spaxels beyond this threshold from the finalized spectral maps.
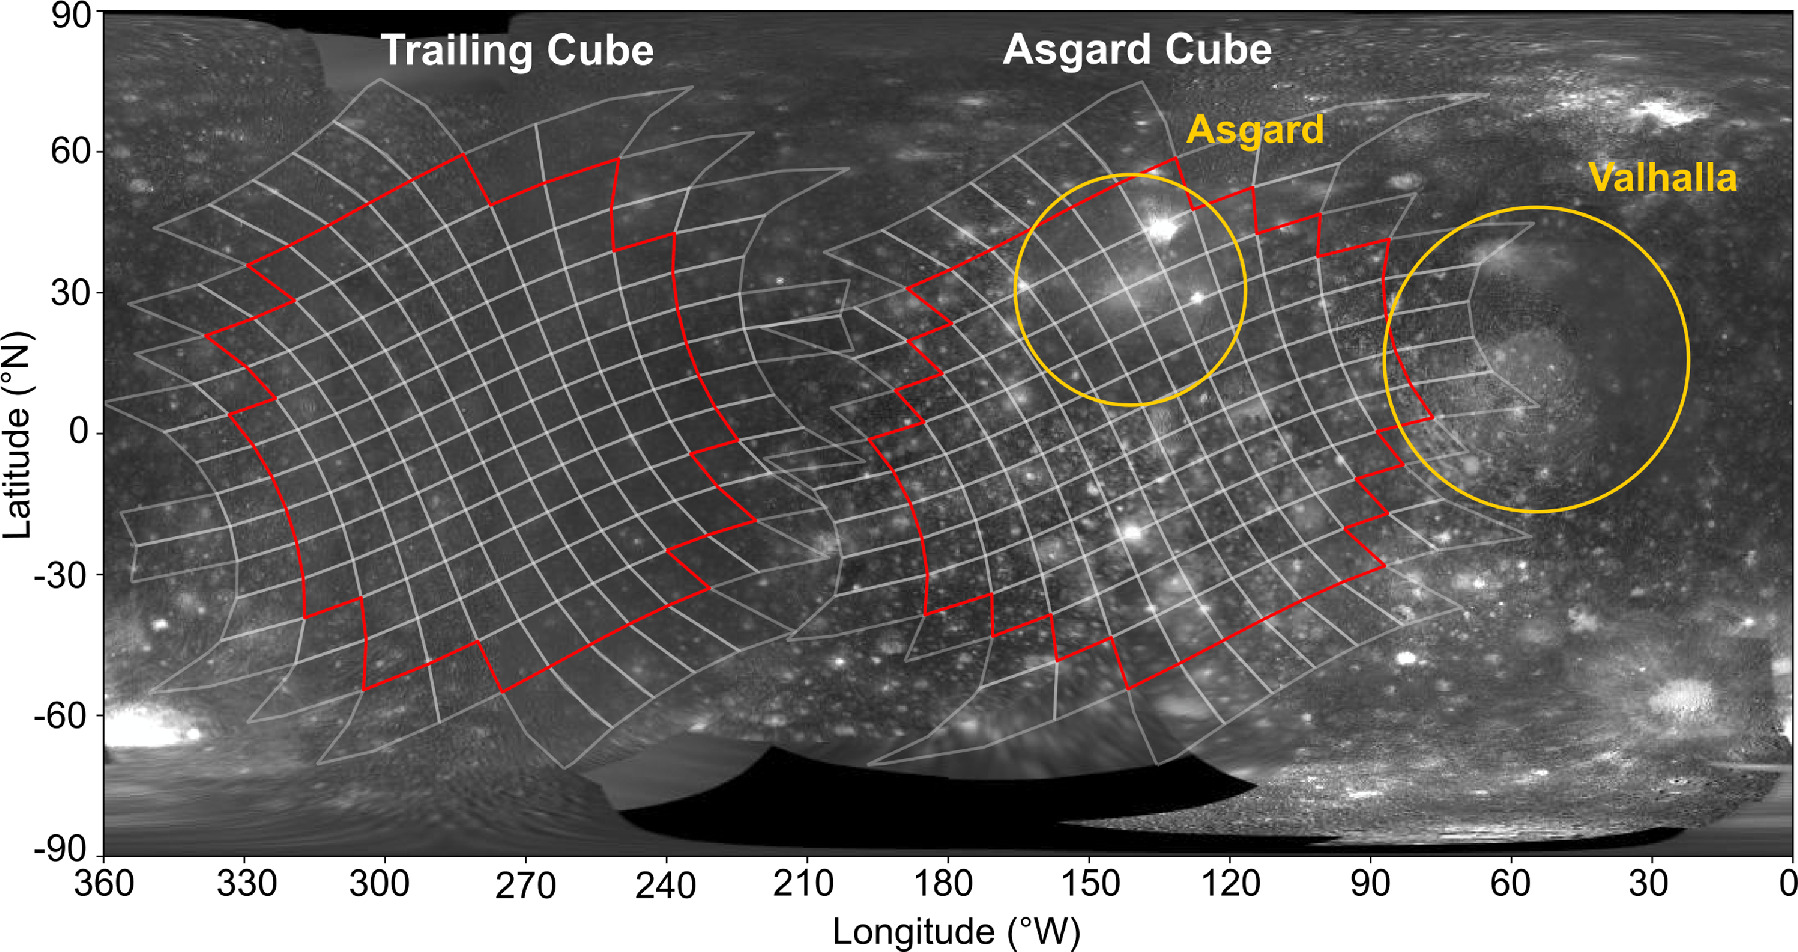
Figure 2. Callisto base map generated using Galileo Solid State Imager data (NASA/JPLCaltech/ USGS), overprinted by map-projected versions of the full NIRSpec footprints (white polygons) and the higher signal NIRSpec footprints utilized in the results and analyses reported here (red polygons). The approximate boundaries of the Asgard and Valhalla impact basins are indicated (gold circles).
Download figure:
Standard imageHigh-resolution image
2.4. Extraction of CO2 Gas Emission Lines and Calculation of Column Densities
Atmospheric species like CO2 gas absorb solar radiation, become excited, and then exhibit fluorescent emission. In the case of the strong fundamental v 3 band of CO2, solar-pumped fluorescence leads to emissions between 4.2 and 4.3 _μ_m in the _v_3 fundamental stretching band, separated into two sets of narrow rovibrational lines, called “_P_” and “_R_” branches. Although a double-lobed emission peak for CO2 gas was detected by NIMS in Callisto’s atmosphere (Carlson 1999), the individual rovibrational lines could not be detected with NIMS due to its low resolving power (R 40–200). The G395H grating (R ∼ 3000 at 4.25 _μ_m) is ideally suited for investigating CO2 gas emission lines.
To measure CO2 gas in fluorescence, we first generated a continuum model by smoothing the Callisto spectra between 4.2 and 4.3 _μ_m until the sawtooth pattern detected by NIRSpec was removed from the data (R ∼ 1000, Figure 3). We then subtracted the continuum model from the native resolution NIRSpec data (R ∼ 3000), generating residual spectra. We performed this technique on all spaxels covering Callisto’s disk and a ∼03 wide annulus of spaxels beyond its disk to search for CO2 gas over a range of altitudes above its surface (∼1000 km). Next, we generated synthetic spectra of CO2 gas rovibrational lines between 4.2 and 4.3 μ_m using PSG, performed the same smoothing/subtraction as applied to the data, and compared these residual models to the residual spectra using cross-correlation (Villanueva et al. 2018, 2022). We iterated this approach, varying the CO2 concentration, until the model matched the spikiness of the residual spectra (synthetic spectra in Figure 3). This approach provided an estimate of the average line-of-sight CO2 gas column density as seen by the observer and did not correct for the observing geometries (i.e., incidence and emission angles). Furthermore, we assume that the excitation process is dominated by solar-pumped fluorescence, and meaningful contributions to molecular excitation by electrons at Callisto would likely lower the CO2 gas column density estimates reported here. An approximation of electron excitation of CO2, utilizing an electron population similar to the one used to interpret ultraviolet emissions (Cunningham et al. 2015; Roth 2021), suggests only minor contributions (<0.1%), supporting solar-pumped fluorescence as the dominant excitation process at Callisto. rms and chi-square statistics between the finalized continuum model and the data were used to define the 1_σ uncertainties for the resulting 12CO2 column density estimates.
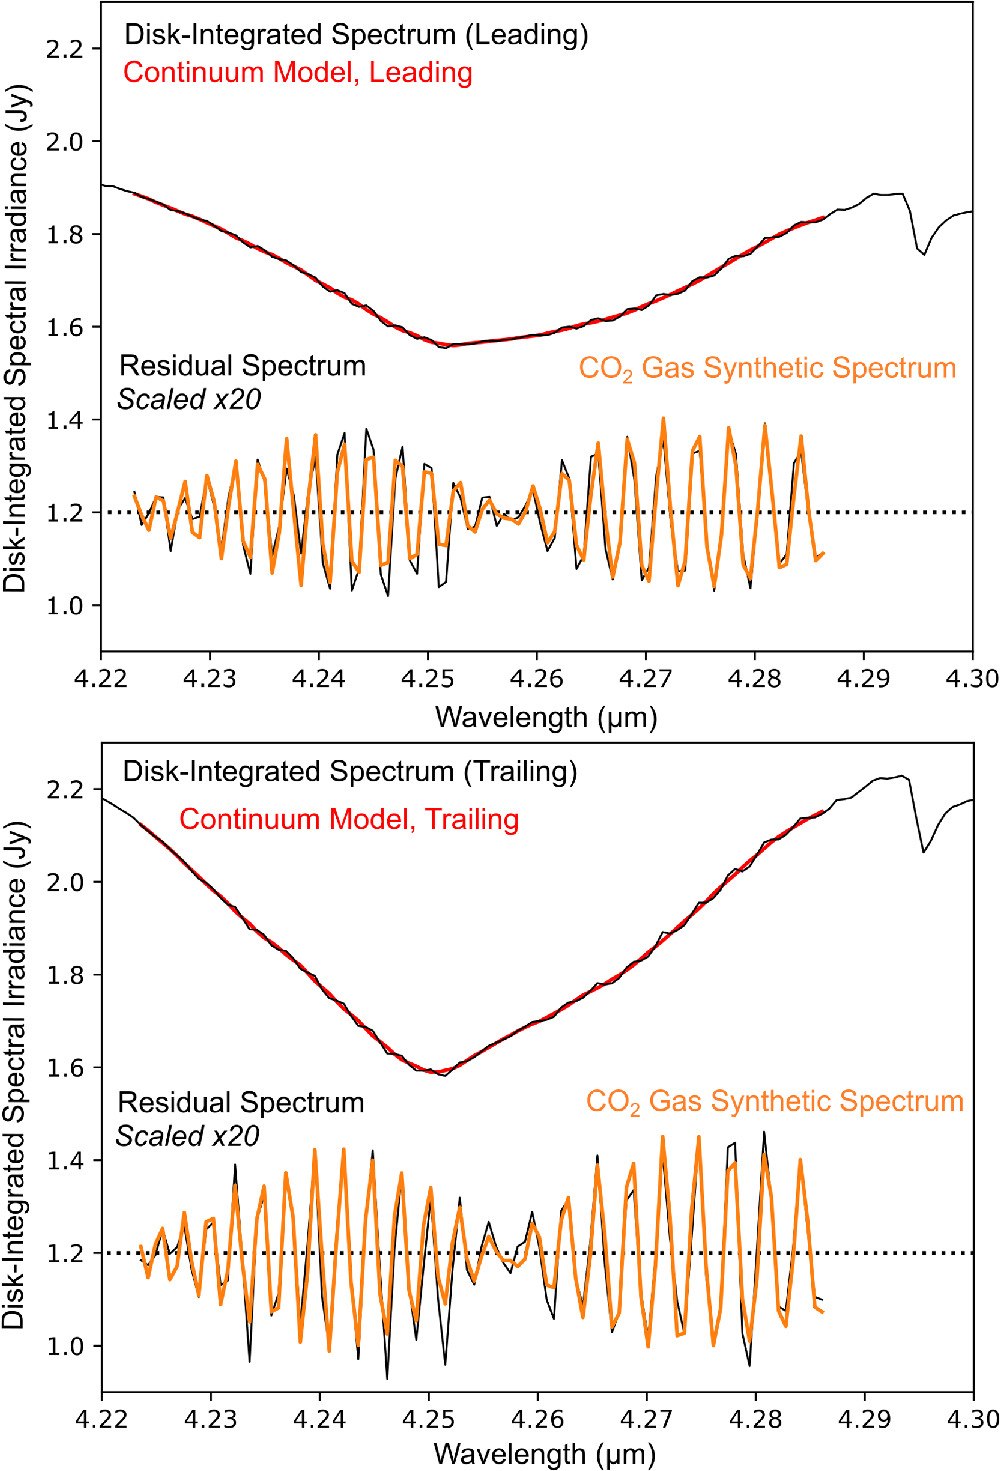
Figure 3. Integrated NIRSpec spectra for Callisto's leading (top) and trailing (bottom) hemispheres at their native resolutions (black) and continuum models (red). The residual spectra (i.e., spectrum minus continuum model) are plotted below each integrated spectrum, offset from 1.0 and scaled by a factor of 20 for clarity. Best-fit CO2 gas synthetic spectra (orange) are plotted over the residual spectra.
Download figure:
Standard imageHigh-resolution image
3.1. Detected Absorption Features
Prominent C-bearing features. The integrated spectra of Callisto’s leading and trailing hemisphere (Figure 4) show conclusive evidence for the global presence of the 4.25 _μ_m 12CO2 absorption band detected previously by NIMS (e.g., Carlson et al. 1996). The integrated NIRSpec data confirm that this feature is significantly stronger on Callisto’s trailing hemisphere (Table 1). NIRSpec also confirmed the presence of a broad 4.57 _μ_m absorption feature that was previously detected by NIMS and attributed to refractory CN-bearing organic residues (McCord et al. 1997). However, the exact identity of the 4.57 _μ_m band remains uncertain (d’Hendecourt et al. 1986; Accolla et al. 2018; Gerakines et al. 2022), and carbon suboxide (C3O2; Johnson et al. 2004) and carbon disulfide (CS2; Cartwright et al. 2020) have also been suggested. Furthermore, we report the detection of a band centered near 4.38 _μ_m that likely results from the v 3 mode of 13CO2, as measured in the laboratory for CO2 (e.g., Hansen 1997), which was recently detected on Europa (Villanueva et al. 2023a) and numerous trans-Neptunian objects (TNOs; e.g., Brown & Fraser 2023; De Pra et al. 2024) using NIRSpec. A subtle absorption band centered near 4.36 _μ_m was originally noted in NIMS data of Callisto and tentatively attributed to 13CO2 (McCord et al. 1998a; Table 2), but no quantitative analyses were made on the feature at that time. Laboratory experiments demonstrate that 13CO2 is frequently detected alongside 12CO2 in irradiated substrates composed of H2O ice and carbonaceous material that includes 13C (e.g., Bennett et al. 2010), and the presence of this isotope on Callisto is therefore unsurprising, albeit the similarly broad 4.38 _μ_m features detected in G395H NIRSpec data of Ganymede (Bockelée-Morvan et al. 2024) and Io (de Pater et al. 2023) might result from calibration artifacts. We consider whether Callisto’s 4.38 _μ_m feature may be contaminated by an artifact in Section 4.3 and Appendix A.3.
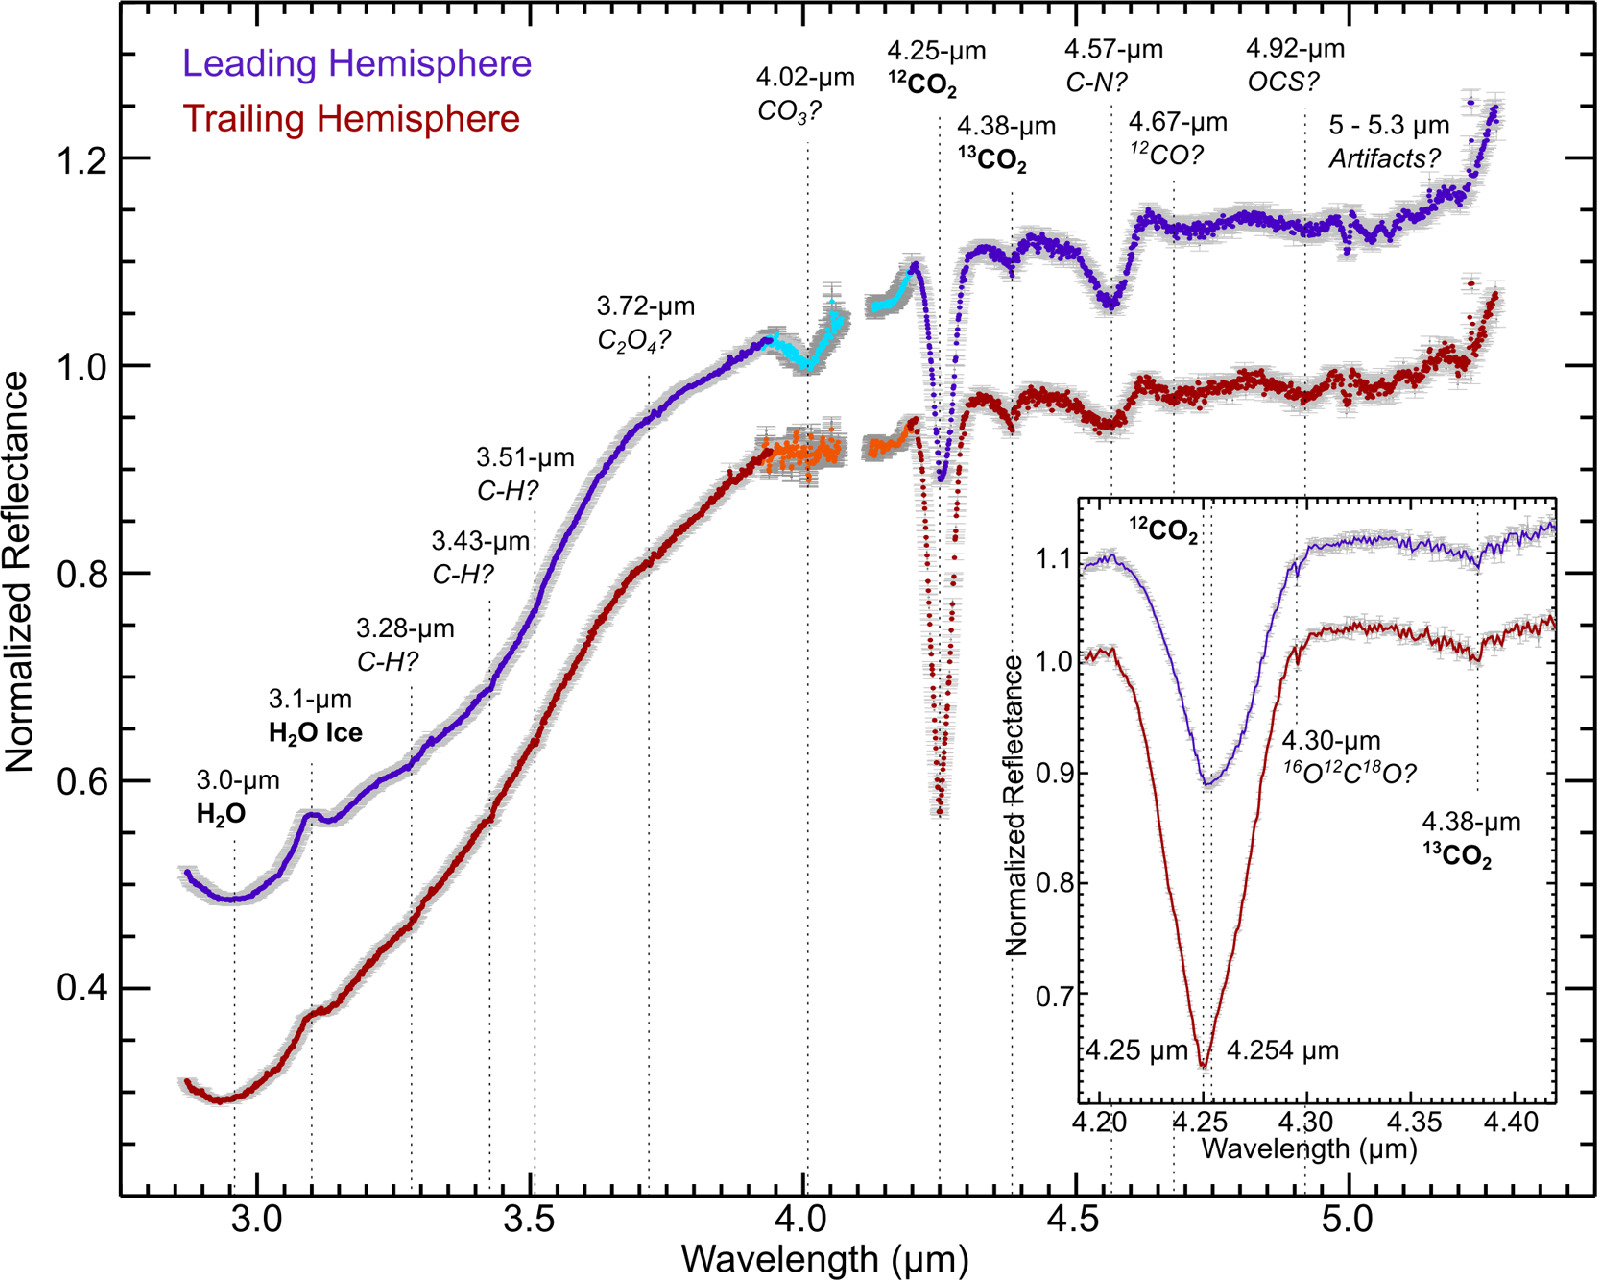
Figure 4. JWST/NIRSpec integrated spectra and 1_σ_ uncertainties (gray error bars) of Callisto's leading (purple) and trailing (red) hemisphere, normalized to 1 at 3.82 _μ_m and offset vertically for clarity. The G395H grating has a ∼0.1 _μ_m wide wavelength gap, shifting between ∼4 and 4.2 _μ_m across NIRSpec IFU's 29 image slices. Some of the image slices that span Callisto's disk include wavelength coverage between ∼4 and 4.2 _μ_m, which are shown here for Callisto's leading (bright blue) and trailing (bright orange) hemispheres. All spectral features identified in this study are labeled, with dotted lines indicating their central wavelengths. Features with confirmed compositions have bolded labels, whereas weak features, or those with multiple compositional interpretations, are italicized and followed by question marks. Possible bands and spectral structure at wavelength >4.98 _μ_m may result from data calibration artifacts and are not analyzed in this study. The inset box shows a close-up of the 4.19–4.42 _μ_m wavelength range, highlighting the CO2 features we have identified and the different band centers for 12CO2 on Callisto's leading (4.254 _μ_m) and trailing (4.250 _μ_m) hemisphere, as well as a feature near 4.3 _μ_m that may result from an isotope of CO2 or could be a residual solar line (Appendix A.3).
Download figure:
Standard imageHigh-resolution image
Table 2. Absorption Bands Detected between 3 and 5 _μ_m and Possible Constituents
| Band Name | Detected in Integrated NIRSpec Data? | Detected in NIMS Data? | Detected in Ground-based Data? | Constituents (confirmed, bolded; suggested, italicized) | References |
|---|---|---|---|---|---|
| 3.00 _μ_m | Yes | Yes | Yes | H 2 O (ice & hydrates) | Pollack et al. (1978) |
| 3.05 _μ_m | aNo | Yes | Yes | NH 4 -bearing | Calvin & Clark (1993) |
| OH-bearing | Moore et al. (2004) | ||||
| 3.10 _μ_m | Yes | Yes | Yes | H 2 O ice | Calvin & Clark (1993) |
| 3.28 _μ_m | Yes | Yes | No | CH-bearing | Moore et al. (2004) |
| Carbonates | This work | ||||
| 3.43 _μ_m | Yes | Yes | Yes | H 2 O frost | Calvin & Clark (1993) |
| CH-bearing | McCord et al. (1998a) | ||||
| Carbonates | b McCord et al. (1998a) | ||||
| OCS | Cartwright et al. (2020) | ||||
| 3.51 _μ_m | Yes | Yes | Yes | CH-bearing | McCord et al. (1998a) |
| Carbonates | b McCord et al. (1998a) | ||||
| 3.72 _μ_m | Yes | Yes | Yes | Oxalates | This work |
| Sulfates | Cartwright et al. (2020) | ||||
| 3.88 _μ_m | aNo | Yes | cYes | H 2 CO 3 | Johnson et al. (2004) |
| H 2 S | McCord et al. (1997, 1998a)) | ||||
| 4.02 _μ_m | Yes | Yes | Yes | SO 2 | McCord et al. (1997), McCord et al. 1998a) |
| Carbonates | Johnson et al. (2004) | ||||
| S-allotropes, H 2 S 2 , HS 2 | Cartwright et al. (2020) | ||||
| 4.12 _μ_m | dNo | Yes | No | D 2 O, HDO | Clark et al. (2019) |
| 4.25 _μ_m | Yes | Yes | No | 12 CO 2 | Carlson et al. (1996) |
| 4.30 _μ_m | Yes | No | No | 16 O 12 C 18 O | This work |
| Residual solar line | |||||
| 4.38 _μ_m | Yes | Yes | No | 13 CO 2 | McCord et al. (1998a) |
| 4.57 _μ_m | Yes | Yes | Yes | CN-bearing | McCord et al. (1997), McCord et al. 1998a) |
| C 3 O 2 | Johnson et al. (2004) | ||||
| CS 2 | Cartwright et al. (2020) | ||||
| 4.67 _μ_m | Yes | No | No | CO | This work |
| 4.92 _μ_m | Yes | No | No | OCS CO 3 12 CO 2 | This work |
Notes.
aFeature may be present in some individual NIRSpec spaxels. bCarbonates were considered but ruled out based on the available spectral libraries. cFeature is much weaker and narrower in ground-based data compared to NIMS data. dFeature is entirely within the unrecoverable wavelength gap of the G395H.
Download table as: ASCIITypeset image
H 2 O features. The integrated spectra show definitive evidence for H2O via the global detection of a strong 3 _μ_m band, resulting from H2O ice and hydrated minerals, and a 3.1 _μ_m Fresnel peak, indicative of crystalline H2O ice (e.g., Grundy & Schmitt 1998; Mastrapa et al. 2009; Figure 4). We find no convincing evidence for the broad 4.5 _μ_m H2O ice feature nor the 3.6 _μ_m H2O ice peak, consistent with prior analyses of Callisto using NIMS (e.g., McCord et al. McCord et al. 1998) and ground-based data (Cartwright et al. 2020). These relatively weaker H2O ice features could be obscured by a global ∼1 cm thick layer of dark dust (likely thicker in some locations), based on the analysis of Callisto’s radar backscatter properties (Ostro et al. 1992; Black et al. 2001; Moore et al. 2004). Additionally, the absence of these H2O ice features indicates that hydrated minerals are a significant reservoir of H2O on Callisto’s surface and contribute to its strong 3 _μ_m band, supporting prior assessments of Callisto’s H2O inventory (e.g., McCord et al. 1998a). Unlike Callisto, the 4.5 and 3.6 _μ_m H2O ice features are present in NIRSpec data of Europa (Villanueva et al. 2023a) and Ganymede (Bockelée-Morvan et al. 2024) and have been detected in other data sets of the icy Saturnian moons (e.g., Cruikshank et al. 2005; Emery et al. 2005), Saturn’s rings (e.g., Hedman et al. Hedman 2024), the Uranian moons (Cartwright et al. 2018), Charon (Protopapa et al. 2024), and other TNOs (e.g., De Pra et al. 2024), highlighting the relatively distinct spectral signature of H2O on Callisto. A detailed analysis of H2O features is beyond the scope of this project and left for future work.
Other detected features. Another six more subtle features centered near 3.28, 3.43, 3.51, 3.72, 4.67, and 4.92 _μ_m are also apparent in the integrated spectra (Figure 4). The 4.67 and 4.92 _μ_m features have not been previously identified on Callisto, and we report their detection for the first time. Subtle features between 3.3 and 3.5 _μ_m were previously identified in NIMS spectra (McCord et al. 1998a) and some ground-based data sets (Cartwright et al. 2020). Subtle features between 3.7 and 3.8 _μ_m were identified in ground-based data (Cartwright et al. 2020) and some NIMS spectra (M.J. Malaska 2024, private communication). These subtle absorption features could be associated with the presence of carbon-rich species, in particular CO2 and other carbon oxides, as well as possible CH-bearing (hydrocarbons), CN-bearing (nitriles and isonitriles), and CS-bearing constituents.
The subtle 3.43 and 3.51 _μ_m features detected in NIRSpec data of Ganymede may result from calibration artifacts (Bockelée-Morvan et al. 2024). Because 3.4 and 3.5 _μ_m bands were previously detected in NIMS (McCord et al. 1998a) and some ground-based (Cartwright et al. 2020) data sets of Callisto, we think these two features are probably real and associated with surface components. Other detected features that may be spurious, or were detected in other data sets but not in the integrated NIRSpec spectra, are described in Appendix A.3. All detected features with band depths ≲1% of the continuum likely require follow-up observations by JWST and other telescope facilities to corroborate their presence. We consider the species that could be contributing to these subtle features in Section 4.5 (summarized in Table 2).
3.2. Band Area and Depth Measurements
We conducted continuum-divided, band area, and depth measurements on the three strongest absorption bands near 4.25, 4.38, and 4.57 μ_m, finding that they are present at >3_σ levels on both hemispheres (Table 1). The prominent 4.25 μ_m 12CO2 band is the most ubiquitous non-H2O feature on Callisto and is significantly stronger (>>3_σ difference) on its trailing hemisphere (band depth ∼33%) compared to its leading side (band depth ∼19%; Table 1, Figure 4). The strong 4.57 μ_m band is also ubiquitous and displays a significant hemispherical asymmetry (>>3_σ difference), with a notably stronger band on Callisto’s leading side (band depth ∼6%) compared to its trailing side (band depth ∼3%). The broad 4.38 μ_m band is somewhat evenly distributed across Callisto’s leading and trailing hemispheres and is only marginally stronger on its trailing side (respective band depths of ∼2.3% and ∼2.6%, <1_σ difference). The spatial trends and hemispherical distributions of these three bands are described in greater detail in Section 3.4.
We also conducted continuum-divided, band area, and depth measurements on the six subtle spectral features centered near 3.28, 3.43, 3.51, 3.72, 4.67, and 4.92 _μ_m, as well as possibly spurious bands near 4.3 μ_m and between 5 and 5.3 μ_m (described in Appendix A.3), finding that they are all present at >3_σ levels with band depths ranging between 0.6% and 1.6% (Table 1). The 3.72 and 4.67 μ_m features are notably weaker on Callisto’s leading side (<3_σ_ detection), and we only report their detection on Callisto’s trailing hemisphere. Similarly, the 4.92 _μ_m feature is modestly stronger on Callisto’s trailing hemisphere (>1_σ difference in band depth, >3_σ difference in band area). The implications of these hemispherical asymmetries are considered in greater detail in Section 4.
3.3. Estimated Column Densities and Distribution of CO2 Gas
We calculated CO2 gas column densities ranging between ∼0.4 and 1.0 × 10¹⁹ m−2 on both sides of Callisto. These NIRSpec-derived estimates are consistent with the column density estimates for Callisto’s leading hemisphere made using NIMS data (0.8 × 10¹⁹ m−2; Carlson 1999). The signature of CO2 gas in the NIRSpec data drops off substantially beyond the edge of Callisto’s disk (∼320 km spaxel−1), suggesting that it is retained close to its surface, consistent with the previous characterization of Callisto’s CO2 atmosphere (estimated to be between ∼5 and 40 km above its surface; Carlson 1999).
The column density maps indicate that the distribution of CO2 gas does not coincide with the regions of peak reflected emission and peak surface temperatures (Figure 5). To estimate Callisto’s temperature, we fit a two blackbody function to its spectrum in each spaxel, consisting of a Planck function set to 5777 K (reflected solar component), and a Planck function where temperature is a free parameter (thermal emission component). On Callisto’s leading hemisphere, the peak CO2 gas column densities are associated with spaxels slightly west of Valhalla, whereas the minimum CO2 column densities are in spaxels clustered on Callisto’s anti-Jovian side. Solid-state CO2 exhibits slightly larger band depths in spaxels near the relatively bright Asgard and slightly west of Valhalla compared to the darker surrounding terrains (Figure 6), perhaps contributing to the higher column densities near Valhalla. On Callisto’s trailing side, the peak CO2 gas column densities are near 290°W and 45°S, notably offset from the peak reflected emissions and peak surface temperatures. Additionally, the largest CO2 column densities on Callisto’s trailing side are clearly offset from the spaxels that exhibit the strongest solid-state CO2 bands (Figure 6).
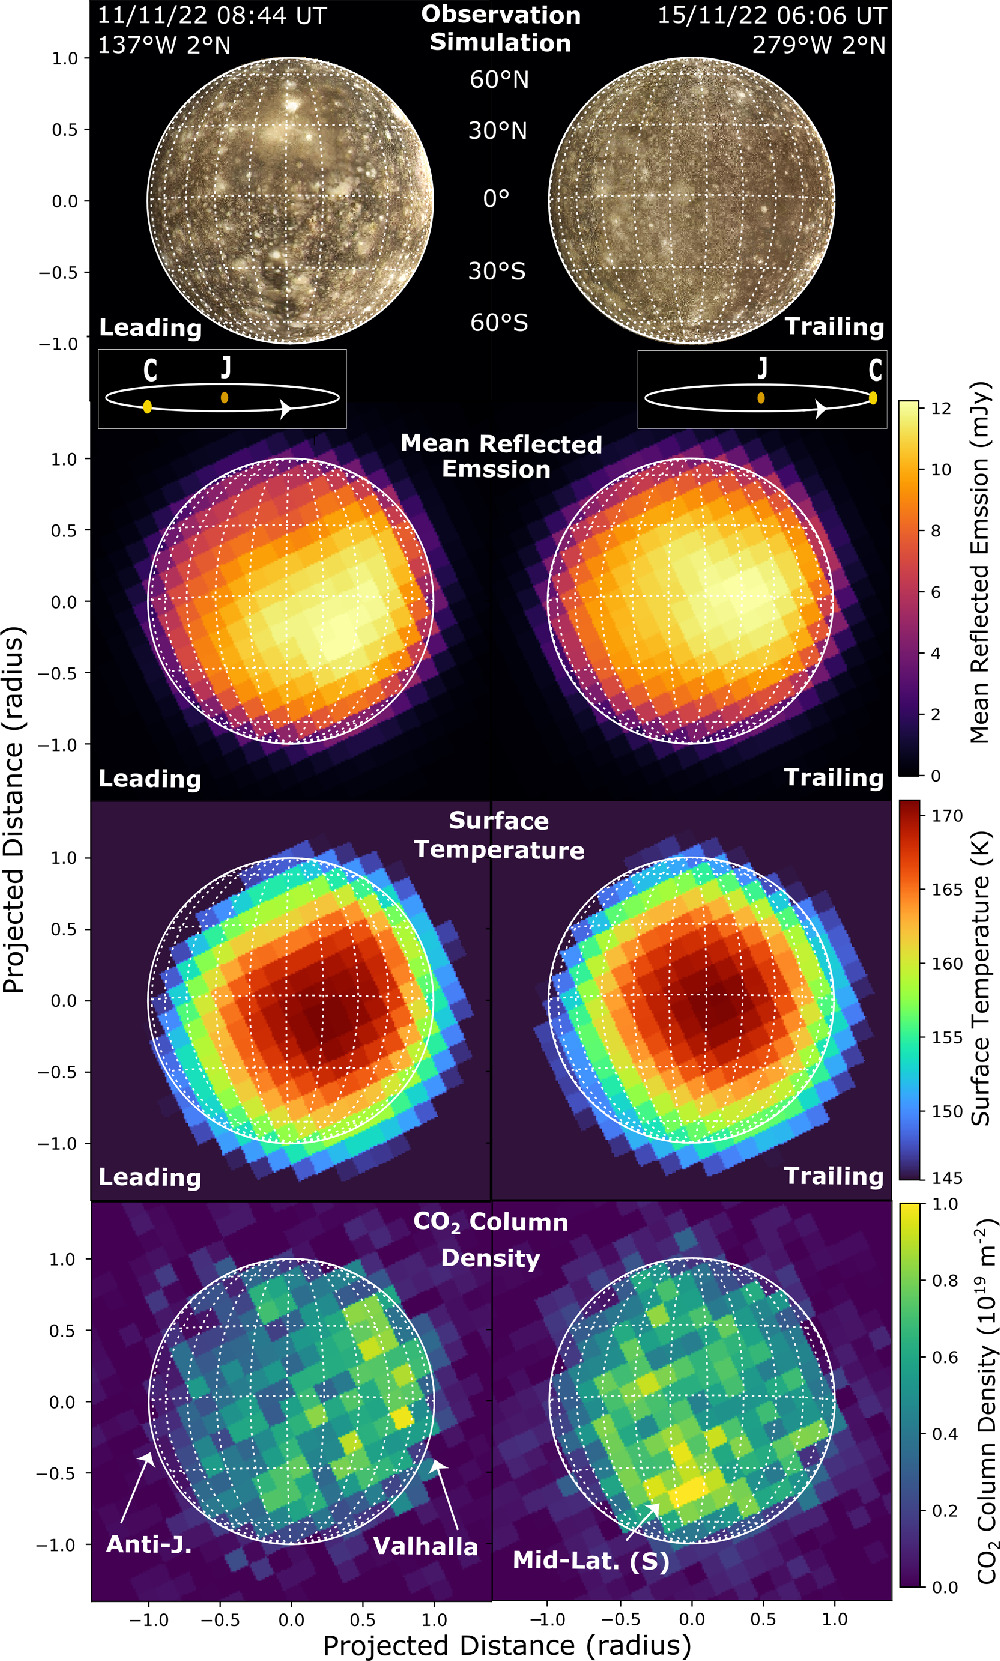
Figure 5. NIRSpec IFU images for Callisto's leading (left column) and trailing (right column) hemisphere. The globes show the simulated observing geometries (inset plot shows the orbit of Callisto around Jupiter), the mean reflected emission at 2.9 _μ_m, the estimated surface temperatures, and the retrieved CO2 column densities, from the top row to bottom row, respectively. Notable asymmetries in the distribution of CO2 gas are indicated with white arrows (discussed in Section 4.2).
Download figure:
Standard imageHigh-resolution image
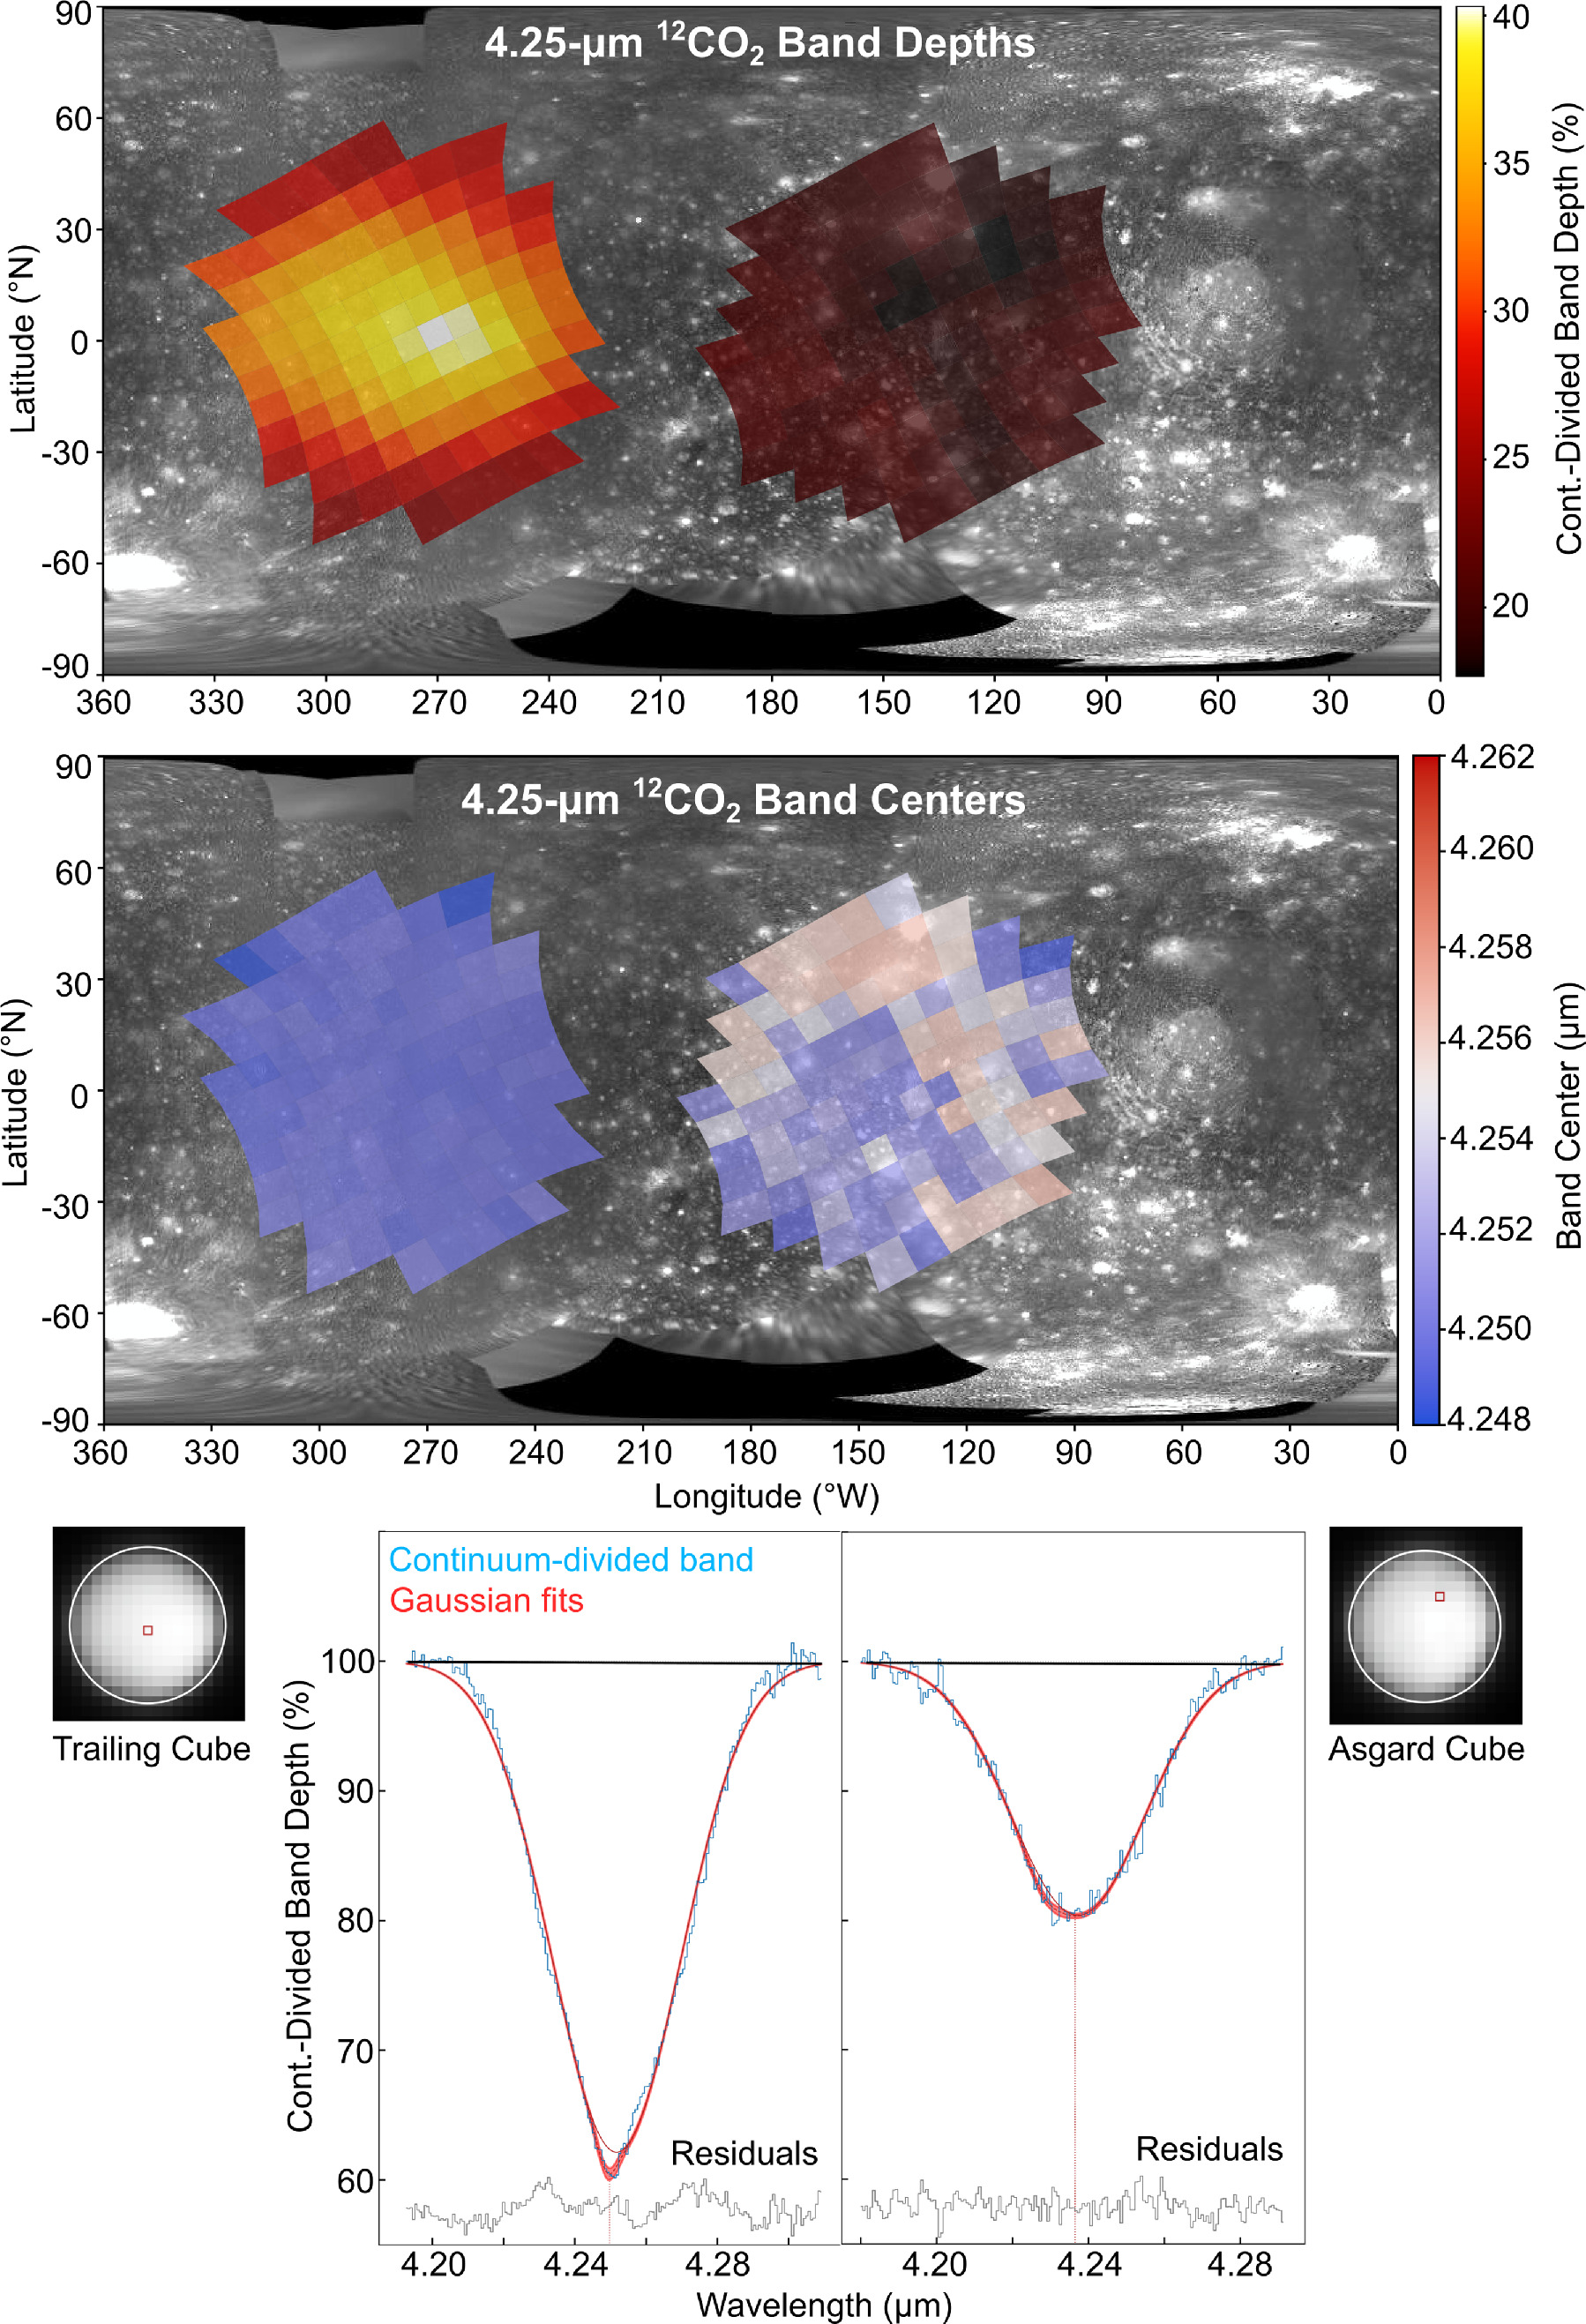
Figure 6. 4.25 _μ_m 12CO2 band depth (top) and band center (middle) maps. Example continuum-divided 4.25 _μ_m bands and model fits (bottom) are shown for spaxels near the center of Callisto's trailing side (left) and in the Asgard impact basin (right). These maps highlight the substantially stronger 12CO2 feature on Callisto's trailing side and the shifted central wavelength of the 12CO2 band on Callisto's leading side.
Download figure:
Standard imageHigh-resolution image
3.4. Spatial Distribution of Solid-state CO2 and the 4.57 _μ_m Band
12CO2. Consistent with the integrated spectra, our spectral maps highlight the ubiquitous presence of CO2 on Callisto (Figure 6, error maps shown in Figure A1). Near the center of Callisto’s trailing hemisphere, the continuum-divided band depths range between 35% and 40%, representing the largest values we measured. The depth of the 12CO2 feature gradually decreases away from this central point, toward transitional longitudes (180° and 360°), ranging between 30% and 35% at low latitudes (30°S–30°N) and 25%–30% at mid latitudes (30°–60°). This distribution of 12CO2 mirrors the bullseye pattern identified in the NIMS data set, where the peak band depths at low latitudes near the center of Callisto’s trailing side are up to 40% of the continuum (see Plate 4 in Hibbitts et al. 2000). The band depths of the 12CO2 feature on Callisto’s leading side are lower than on its trailing side (Figure 6), consistent with the integrated spectra and prior measurements made with NIMS. In the NIRSpec cubes, the spaxels covering the anti-Jovian side of Asgard and the sub-Jovian side near Valhalla display the largest band depths measured on the leading hemisphere (20%–25%). In between these zones, near the center of Callisto’s leading side (subobserver longitude 90°), band depths are notably lower (18%–20%). In the higher spatial resolution NIMS data set, 12CO2 band depths can approach 40% of the continuum in craters and their ejecta blankets on Callisto’s leading side, but outside of these features, 12CO2 band depths are much lower, ranging between ∼5% and 20% of the continuum (e.g., Figures 5 and 6 in Hibbitts et al. 2002). These CO2-enriched craters and their ejecta blankets are too small to be resolved with NIRSpec. The band center of the 12CO2 feature is remarkably consistent across Callisto’s trailing hemisphere (4.250 ± 0.002 _μ_m; Figure 6). On Callisto’s leading side, the band center for 12CO2 is similar to its trailing side (4.252 ± 0.002 _μ_m), except for the spaxels covering and proximal to Asgard and Valhalla, where the band center is notably shifted to longer wavelengths (4.258 ± 0.002 _μ_m).
13CO2. The heavy stable isotope 13CO2 is present across Callisto (Figure 7, error maps shown in Figure A2), and it exhibits much weaker continuum-divided band depths (1%–5%) compared to the 12CO2 feature (18%–40%). The morphology of the 13CO2 feature in the integrated spectra is similar on Callisto’s leading and trailing sides. At the individual spaxel scale, however, we have identified two components to the 13CO2 band, with a broad base feature (spanning 4.335 to 4.415 _μ_m) exhibiting smaller band depths (1%–3%) overprinted by a narrow peak feature centered close to 4.38 _μ_m that shows larger band depths (2%–5%). Both the base and peak components of the 13CO2 feature are stronger near the center of Callisto’s trailing hemisphere and are generally weaker on Callisto’s leading side, similar to the distribution of 12CO2 (Figure 7). The band center of the peak feature is essentially unchanging and very near 4.38 _μ_m. To investigate possible wavelength shifts in the broader base component, we utilized single-Gaussian model fits that ignore the narrow peak. The resulting map shows that the base component is somewhat shifted to shorter wavelengths in spaxels on Callisto’s trailing side compared to its leading side, but the overall distribution is fairly mottled (Figure 7). In general, regional variations in 13CO2 band depths and centers are more ambiguous than the same measurements of 12CO2 or the 4.57 _μ_m band (see below), likely because 13CO2 bands are much weaker, making spatial trends hard to discern.
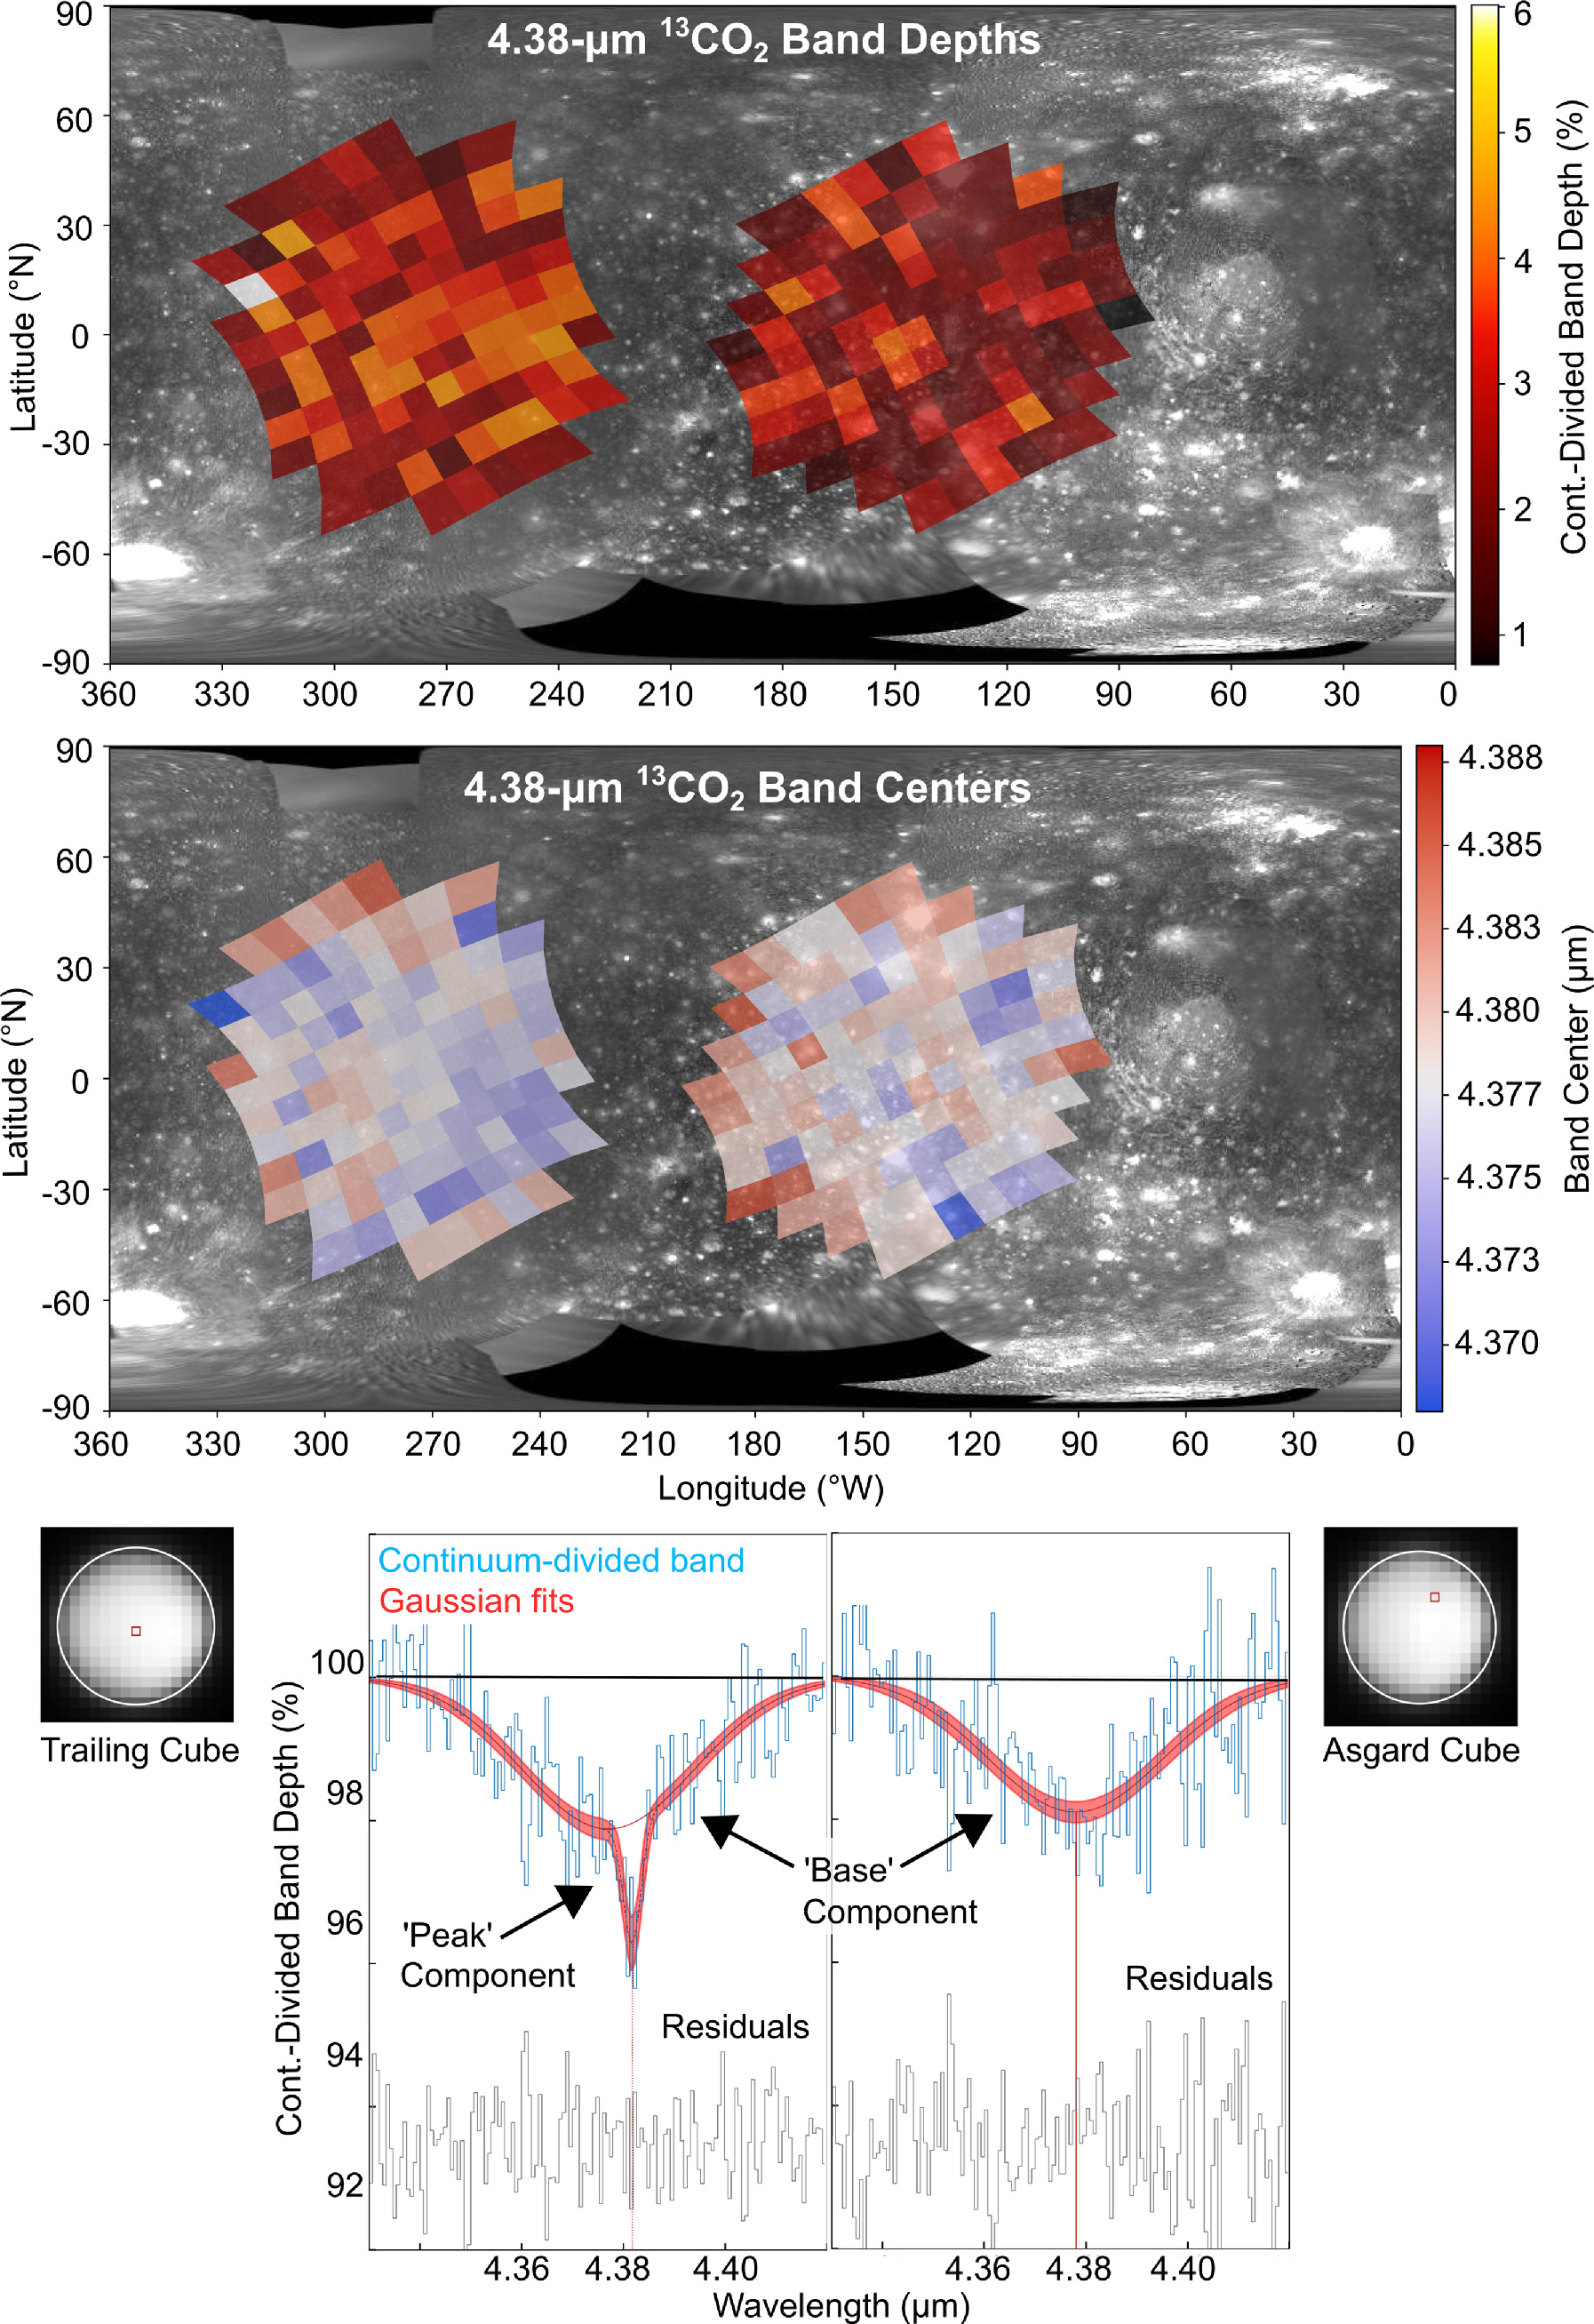
Figure 7. 4.38 _μ_m 13CO2 band depth map, including both the “base” and “peak” components of this feature (top) and 4.38 _μ_m band center map for the base component only (middle; the peak component does not exhibit wavelength shifts, and so is excluded). Example continuum-divided 4.38 _μ_m bands and model fits (bottom) are shown for spaxels near the center of Callisto's trailing side (left) and in the Asgard impact basin (right). These maps highlight the modestly stronger 13CO2 feature on Callisto's trailing side, in part resulting from the narrow peak component overprinting the wide and shallow base component. This narrow peak feature is fit by a second Gaussian model (shown in bottom, left plot).
Download figure:
Standard imageHigh-resolution image
4.57 μm feature. The continuum-divided band depth map for the 4.57 _μ_m band (Figure 8, error maps shown in Figure A3) shows that this feature is weaker on Callisto’s trailing hemisphere (2%–6%) compared to its leading side (2%–10%). The smaller band depths are most obvious near the center of Callisto’s trailing hemisphere (2%–4%). The 4.57 _μ_m band depths show prominent regional variations on Callisto’s leading hemisphere, with the largest band depths in terrains outside of Asgard, especially at mid southern latitudes (8%–10%). Within Asgard, and at low and mid northern latitudes toward Callisto’s anti-Jovian side, 4.57 _μ_m band depths are lower (2%–6%). The band centers for the 4.57 _μ_m band range between 4.54 and 4.58 _μ_m on both hemispheres (Figure 8), but the average band center appears to be shifted to shorter wavelengths (4.555 ± 0.010 _μ_m) on Callisto’s trailing side compared to its leading side (4.565 ± 0.010 _μ_m), although these wavelength ranges overlap. Thus, the spaxels that exhibit larger 4.57 _μ_m band depths tend to have band centers at slightly longer wavelengths.
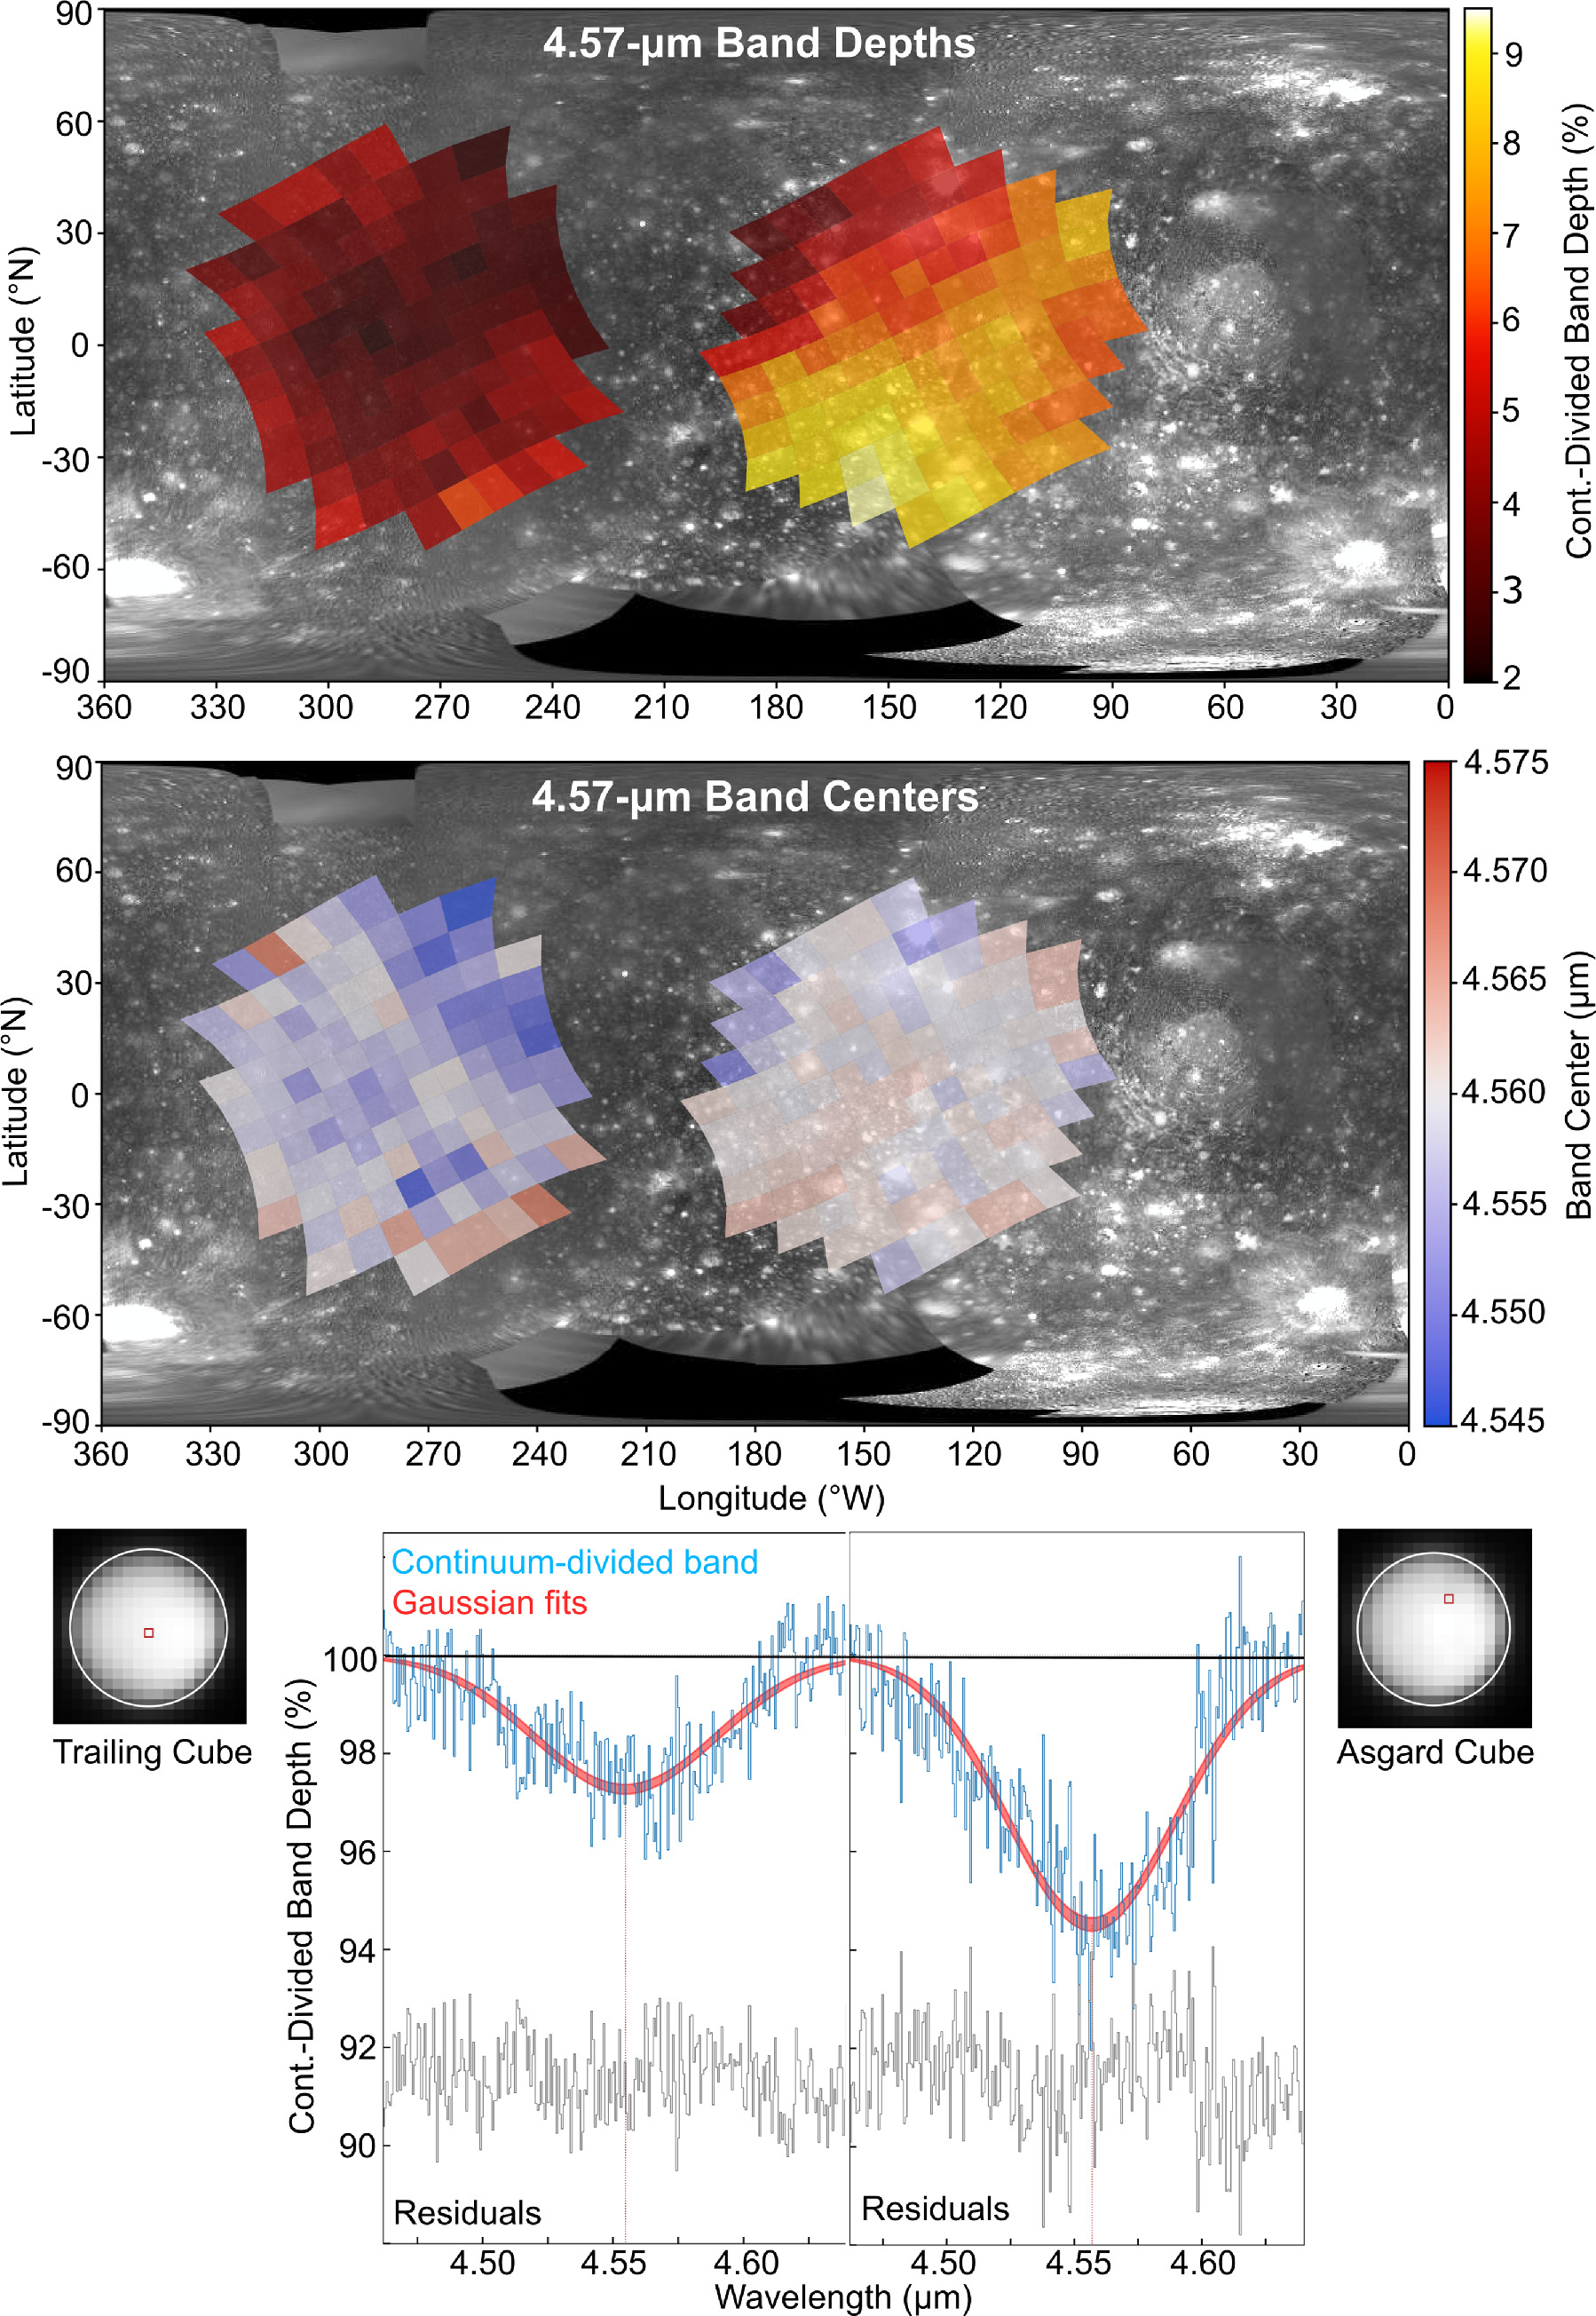
Figure 8. 4.57 _μ_m band depth (top) and band center (middle) maps. Example continuum-divided 4.57 _μ_m bands and model fits (bottom) are shown for spaxels near the center of Callisto's trailing side (left) and in the Asgard impact basin (right). These maps highlight the notably stronger 4.57 _μ_m feature on Callisto's leading side, and the shift of its band center to shorter wavelengths on Callisto's trailing side.
Download figure:
Standard imageHigh-resolution image
4.1. Origin and Nature of Solid-state CO2
We measured the spectral signatures of 12CO2 and 13CO2 across Callisto’s surface. The strong hemispherical dichotomy in the strength of the 12CO2 band, and its shifted central wavelength between Callisto’s trailing (∼4.250 _μ_m) and leading (∼4.252 _μ_m) hemispheres compared to Asgard and Valhalla (∼4.258 _μ_m), suggests that the origin of CO2 could involve more than one source, and/or CO2 is modified by different processes in different locations. The bullseye shaped distribution of 12CO2 on Callisto’s trailing side is consistent with bombardment by fast rotating plasma in the Jovian magnetosphere that primarily interacts with the trailing sides of the Galilean moons. In this scenario, carbonaceous material mixed with H2O is irradiated, forming CO2 molecules and other carbon oxides. The radiolytically generated CO2 molecules are bound or trapped in the host regolith materials (Hand & Carlson 2012), allowing CO2 to build up over time. This trapping process could help explain how this volatile is able to persist at Callisto’s peak surface temperatures (∼170 K, Figure 5). Additionally, the subtle bands centered near 3.72, 4.30, 4.67, and 4.92 _μ_m might result from various oxides of carbon (Section 4.5). The presence of these features on Callisto’s trailing hemisphere, and their relative weakness or absence from Callisto’s leading side (Table 1), also supports radiolytic production and efficient trapping of carbon oxides in dark material and/or H2O ice on Callisto’s trailing side.
The more regionally variable distribution of 12CO2 on Callisto’s leading hemisphere implicates additional, nonradiolytic processes. Based on the analysis of NIMS data, it has been suggested that CO2 might be sourced from Callisto’s crust and exposed in fresher craters associated with Asgard and Valhalla (Hibbitts et al. 2002). Although the NIRSpec data have insufficient spatial resolution to discern the spectral properties of individual craters, the data do show that CO2 band depths are greater in spaxels covering and proximal to Asgard and Valhalla compared to the surrounding terrains (Figure 6). Crustal deposits could include crystalline CO2 ice, which should rapidly sublimate at Callisto’s peak surface temperatures, as suggested by landscape evolution models (White et al. 2016). Perhaps, small amounts of residual CO2 ice are present in Asgard and Valhalla, shifting the complexed CO2 feature to longer wavelengths (∼4.258 _μ_m), but at insufficient levels to express a second feature at 4.27 _μ_m, unlike on Europa (Trumbo & Brown 2023; Villanueva et al. 2023a). Another possibility is that the CO2 is trapped in H2O ice, which has been suggested to explain the wavelength shifts exhibited by 12CO2 in the spaxels associated with Ganymede’s north polar region (Bockelée-Morvan et al. 2024), albeit the spectral signature of H2O ice is much weaker on Callisto than on Ganymede.
Alternatively, perhaps, the CO2 on Callisto’s leading hemisphere is primarily generated by radiolysis on its trailing side, which then gets sputtered or sublimates during peak dayside temperatures, migrating in Callisto’s tenuous atmosphere to the nightside leading hemisphere, where it subsequently condenses on bright crater rims and rings in Asgard and Valhalla. Such a cold trapping process might form deposits that include crystalline CO2 ice, or alternatively, CO2 could get trapped by cocondensing H2O, thereby explaining the wavelength shift in the 12CO2 feature exhibited by Asgard and Valhalla.
The 13CO2 band is stronger near the center of Callisto’s trailing side, coincident with the strongest 12CO2 band depth measurements, suggesting that 13CO2 is also generated by radiolysis. Whether the origin of the narrow peak and broad base components of the 13CO2 band are linked is uncertain. One possibility is that the narrow peak centered near 4.38 _μ_m (Figure A4) represents _pure_13CO2, whereas the broad base component represents 13CO2 mixed with H2O or other species, possibly explaining the band center shifting (∼4.37–4.38 _μ_m) exhibited by the base component on Callisto’s trailing side. Furthermore, both 12CO2 and 13CO2 features exhibit shifts to shorter wavelengths on Callisto’s trailing hemisphere (Figures 6 and 7, respectively), consistent with complexation on its trailing side and at least some free deposition on its leading side (i.e., formation of deposits where CO2 molecules are primarily surrounded by other CO2 molecules). The 4.57 _μ_m band exhibits a similar wavelength shift on Callisto’s leading versus trailing hemisphere, hinting at similar differences in deposition for the species contributing to this feature (Figure 8). Future laboratory studies that investigate irradiation of H2O mixed with carbonaceous components under conditions relevant to Callisto are likely required to gain better understanding of the observed wavelength shifts. Of note, the base component of Callisto’s 4.38 _μ_m band may be spuriously enhanced by a calibration artifact, as has been suggested for Ganymede 4.38 _μ_m band (Bockelée-Morvan et al. 2024). We discuss this possibility in Section 4.3 and Appendix A.3 (Figures A4 and A5). Improvements to the NIRSpec data calibration pipeline could help resolve this ambiguity.
4.2. A Localized and Patchy CO2 Atmosphere
The CO2 column densities on Callisto’s leading and trailing sides show notable asymmetries in the distribution of CO2 gas that are offset from the subsolar region (Figure 5). The higher CO2 gas abundances in spaxels slightly west of Valhalla could result from sublimation of modestly larger abundances in solid-state CO2, as implicated by the stronger CO2 bands in this location compared to the surrounding terrains (Figure 6). Thermophysical modeling of thermal observations made with the Atacama Large Millimeter/submillimeter Array (ALMA) at 0.87 mm/343 GHz suggests there is an anomalously warm region west and south of Valhalla (Camarca et al. 2023). This warmer region might increase the mobility of solid-state CO2 in Callisto's near-surface, perhaps increasing the rate at which it diffuses out of the regolith, thereby increasing CO2 gas column densities over this location. Sputtering of CO2 molecules into the exosphere (e.g., Raut & Baragiola 2013) could contribute to CO2 gas abundances over Valhalla, perhaps enhanced by draping of the Jovian magnetic field lines, increasing the high energy particle bombardment in some locations (Liuzzo et al. 2019). Geologic processes, such as outgassing of CO2 from Callisto’s crust and increased sublimation of CO2 from more recent exposure of crustal deposits of CO2 ice could also contribute to the enhancement in CO2 gas above the Valhalla region.
We report the first detection of CO2 gas over the trailing hemisphere, confirming that CO2 is globally present in Callisto’s atmosphere. The peak CO2 column densities over the trailing side are notably offset (∼45°S) from the low latitude zone where the estimated surface temperatures and reflected emissions are highest (Figure 5). This location is also offset from the location of the strongest solid-state CO2 absorption bands (Figure 6). Thus, peak CO2 gas abundances do not coincide with the region where sublimation, sputtering, and radiolysis should be most pronounced on Callisto’s trailing side, suggesting that geologic terrains help sustain the CO2 atmosphere above this location. A large “light plains” unit (lp; Bender et al. 1997) centered near 290°W and spanning ∼15°S to 45°S (Figure 17.33 in Moore et al. 2004) is slightly north of the peak CO2 column densities, possibly contributing to them. These lp units represent impact structures with higher albedos and lower crater frequencies compared to the surrounding terrains (Bender et al. 1997). Whether a cluster of brighter impact structures would spur outgassing of CO2 from Callisto’s crust or enable more efficient sublimation or sputtering of solid-state CO2 in this location is uncertain, and the rough spatial association between this lp unit and peak CO2 gas column densities could be coincidental. Nevertheless, our results suggest that geologic sources of CO2 are important for sustaining Callisto’s atmospheric CO2.
The derived column densities over both hemispheres suggest that CO2 gas is less abundant than atmospheric O2, for which average column densities of 2–4 × 10¹⁹ m−2 were inferred from observations (Cunningham et al. 2015; Hartkorn et al. 2017; de Kleer et al. 2023), but exceeds the abundance of O (Cunningham et al. 2015) and H (Roth et al. 2017). The abundances of H2 and H2O, which are likely present in Callisto’s atmosphere (e.g., Carberry Mogan et al. 2023), could be similar to the CO2 densities derived here, suggesting a mixed atmosphere with different species dominating at different locations.
4.3. 13CO2/12CO2 Isotopic Ratios
Ratios between stable isotopes of different elements, such as 12C and 13C, can provide important information about the formation conditions of different icy bodies, the materials they accreted, and the processes that may have subsequently altered these materials. Prior studies have utilized isotopic ratios of remotely sensed spectral features on planetary bodies to gain insight into isotopic ratios of their constitutive elements (e.g., Clark et al. 2019; Glein et al. 2024; Grundy et al. 2024). For example, 13C/12C ratios derived from equivalent width measurements of solid-state 13CO2 and 12CO2 on Saturn’s native moon Iapetus are consistent with “terrestrial” values, exhibited by the inner planets, main belt asteroids, and Saturn’s rings (Clark et al. 2019). In contrast, the same measurement technique applied to Saturn’s captured moon Phoebe yields a 13C/12C ratio enhanced by a factor of ∼5 relative to terrestrial values (Clark et al. 2019). This enhancement might arise because Phoebe, which likely formed in the primordial Kuiper Belt and was captured by Saturn (e.g., Johnson & Lunine 2005), accreted material from a region of the protoplanetary disk where 12C-bearing gas was shielded from UV photon processing, allowing preferential accretion of 13C-rich solids formed from photolysis of 13C-bearing gas (Neveu et al. 2020).
To provide additional context on Callisto’s CO2 features and to investigate the possible sources of carbon on its surface, we calculated hemispherical 13CO2/12CO2 band area and depth ratios (measurements listed in Table 3), using the 4.25 and 4.38 _μ_m features identified in the integrated spectra (Figure 4). The resulting ratios are notably larger on Callisto’s leading side due to the large hemispherical difference in 12CO2 but only modest difference in 13CO2 (Table 3, Figure 4). Using the same band measurement program, we calculated 13CO2/12CO2 band area and depth ratios for the Saturnian moons Iapetus and Phoebe, utilizing the same data as prior analyses, collected by Cassini’s Visual and Infrared Mapping Spectrometer (VIMS; Clark et al. 2019). We also resampled the NIRSpec spectra of Callisto to simulate the native resolution of the VIMS data at 4.3 _μ_m (R ∼ 130) (Figure 9).
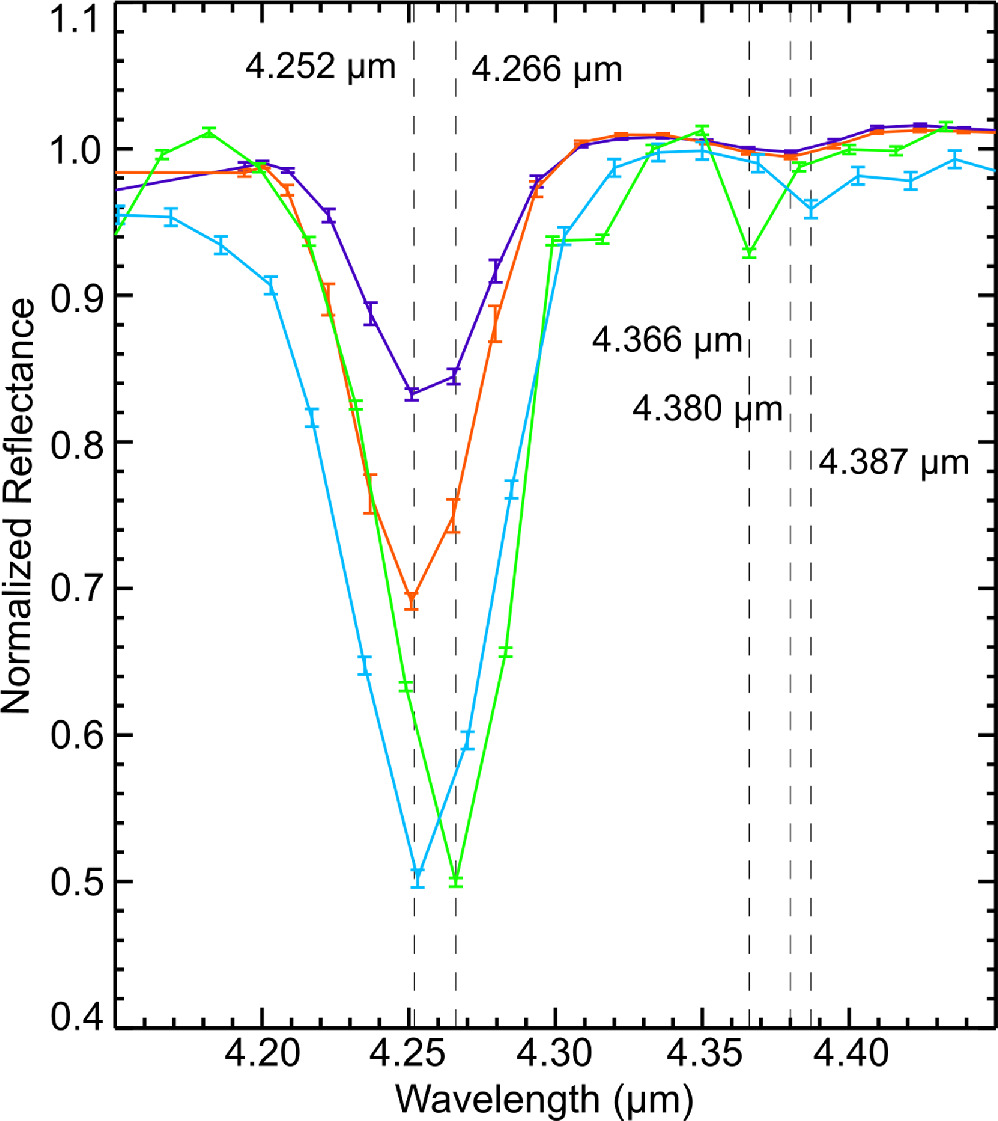
Figure 9. Comparison between 12CO2 and 13CO2 features in VIMS spectra of Iapetus (blue) and Phoebe (green; Clark et al. 2019) and NIRSpec integrated spectra of Callisto's leading (purple) and trailing (orange) hemisphere, which have been binned to simulate the spectral resolution of VIMS data. All spectra are normalized to 1 at 4.35 μ_m. Approximate band centers are indicated (dashed lines). Error bars represent the 1_σ uncertainties for each spectrum.
Download figure:
Standard imageHigh-resolution image
Table 3. CO2 Band Measurement Ratios
| Observation | 12CO2 Central Wave. | 12CO2 Band Depth | 12CO2 Band Area | 13CO2 Central Wave | 13CO2 Band Depth | 13CO2 Band Area | 13CO2/12CO2 Band Depth Ratio | 13CO2/12CO2 Band Area Ratio |
|---|---|---|---|---|---|---|---|---|
| (_μ_m) | (%) | (10−4 _μ_m) | (_μ_m) | (%) | (10−4 _μ_m) | |||
| NIRSpec Data | ||||||||
| Callisto, Leading | 4.254 | 18.90 ± 0.16 | 83.54 ± 0.35 | 4.382 | 2.31 ± 0.27 | 7.54 ± 0.34 | 0.122 ± 0.014 | 0.090 ± 0.004 |
| 0.54 ± 0.11 a | 2.85 ± 0.38 a | 0.029 ± 0.006 a | 0.034 ± 0.005 a | |||||
| Callisto, Trailing | 4.250 | 33.23 ± 0.46 | 148.92 ± 0.21 | 4.382 | 2.86 ± 0.20 | 8.76 ± 0.27 | 0.086 ± 0.006 | 0.059 ± 0.002 |
| 0.81 ± 0.11 a | 3.70 ± 0.37 a | 0.024 ± 0.003 a | 0.025 ± 0.003 a | |||||
| VIMS Data | ||||||||
| Phoebe | 4.266 | 42.55 ± 7.79 | 270.07 ± 2.57 | 4.366 | 7.91 ± 0.55 | 15.83 ± 1.47 | 0.186 ± 0.036 | 0.059 ± 0.005 |
| Iapetus | 4.254 | 43.78 ± 4.74 | 289.53 ± 2.59 | 4.387 | 2.71 ± 0.47 | 4.60 ± 1.06 | 0.062 ± 0.013 | 0.016 ± 0.004 |
| Callisto, Leading b | 4.252 | 14.56 ± 0.74 | 68.15 ± 1.97 | 4.380 | 1.23 ± 0.21 | 5.34 ± 0.36 | 0.084 ± 0.015 | 0.078 ± 0.006 |
| 0.37 ± 0.18 a | 1.41 ± 0.30 a | 0.025 ± 0.012 a | 0.021 ± 0.004 a | |||||
| Callisto, Trailing b | 4.252 | 25.83 ± 3.23 | 128.38 ± 3.63 | 4.380 | 1.46 ± 0.19 | 6.31 ± 0.38 | 0.056 ± 0.010 | 0.049 ± 0.003 |
| 0.67 ± 0.16 a | 2.55 ± 0.30 a | 0.026 ± 0.007 a | 0.020 ± 0.002 a |
Notes.
aIo spectrum subtracted from integrated Callisto spectra (Figure A6). bIntegrated Callisto spectra resampled to simulate VIMS resolving power at 4.3 _μ_m (Figure 9).
Download table as: ASCIITypeset image
The resulting 13CO2/12CO2 band area ratios for Callisto’s leading and trailing hemispheres are comparable to Phoebe (<2_σ_ difference) and significantly larger than Iapetus (>4_σ_ difference; Figure 10). In contrast, both sides of Callisto have similar band depth ratios to Iapetus (<1_σ_ difference), whereas Phoebe’s band depth ratio is notably higher than that of Iapetus or Callisto (>2_σ_ difference; Figure 10). Thus, Callisto’s 13CO2/12CO2 band area ratios suggest that its surface may be enriched in 13C similar to that of Phoebe, but its band depth ratios are more consistent with the terrestrial-like values of 13C exhibited by Iapetus (the 13CO2/12CO2 band depth ratios have larger uncertainties than the band area ratios, which likely contributes to the ambiguity).
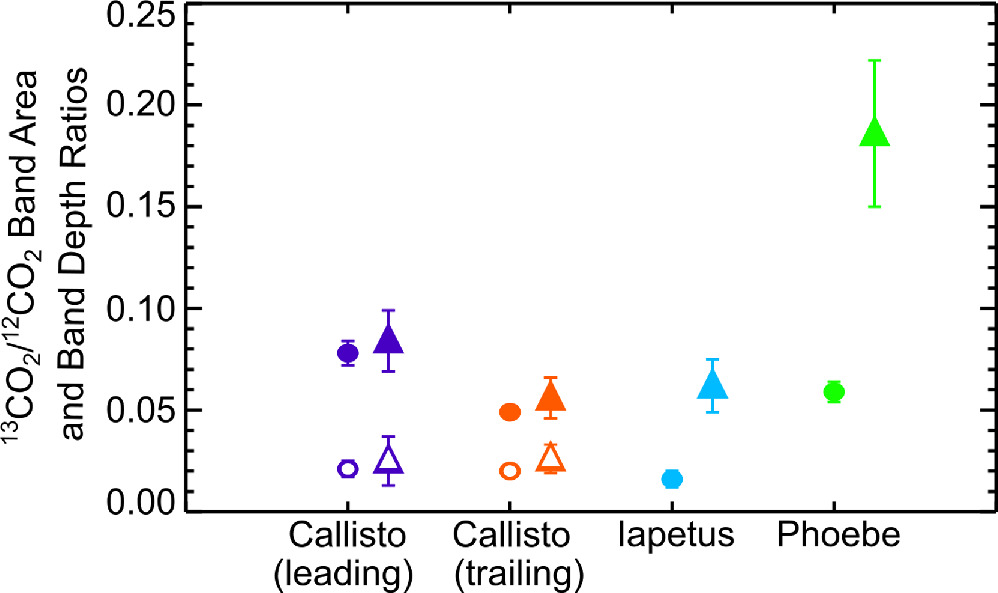
Figure 10. 13CO2/12CO2 band area (filled circles) and depth (filled triangles) ratios and 1_σ_ errors for the binned NIRSpec spectra of Callisto and VIMS spectra of Phoebe and Iapetus (spectra shown in Figure 9; ratios reported in Table 3). The hollow circles and triangles respectively show the band area and depth ratios for Callisto measured using Io-subtracted data.
Download figure:
Standard imageHigh-resolution image
One possibility to explain this discrepancy is that other species contribute to the wide but shallow base component of Callisto’s 13CO2 band, increasing its band area ratios but not its band depth ratios. Alternatively, it has been suggested that a broad and subtle 4.38 _μ_m feature detected on Ganymede (Bockelée-Morvan et al. 2024) and Io (de Pater et al. 2023) could be a calibration artifact and may not result from 13CO2. The detection of this feature on Io is of particular interest because these NIRSpec IFU observations were collected during Jupiter eclipse, when Io’s spectral properties should be dominated by thermal emission, with no reflected light contributing to absorption bands near 4.38 _μ_m or at other wavelengths. Although we think Callisto’s 4.38 _μ_m band is real, based on its prior detection in NIMS data, perhaps a subtle artifact is also contributing to the base component of its 4.38 _μ_m band and distorting the band area ratios presented here.
To investigate this possibility, we subtracted a continuum-divided, integrated G395H spectrum of Io from the continuum-divided, integrated spectra of Callisto (hereon referred to as Io-subtracted data), in the 4.38 μ_m wavelength region (Figure A6). We then resampled the Io-subtracted spectrum to VIMS-equivalent spectral resolutions. The resulting band area and depth ratios are notably smaller, and the asymmetry between Callisto’s leading and trailing hemispheres is negligible in these Io-subtracted data (<1_σ difference; Table 3, Figure 10). Furthermore, the 13CO2/12CO2 ratios for the Io-subtracted data are consistent with Europa’s 13CO2/12CO2 band intensity ratio (0.021 ± 0.001), measured using NIRSpec IFU data (Villanueva et al. 2023a). We present both Io-subtracted and non-Io-subtracted results in all subsequent analyses of Callisto’s carbon isotope ratios.
The band area measurements presented here essentially measure the same quantity as the equivalent width, which was used in prior work showing enhanced isotopic ratios on Phoebe (Clark et al. 2019). Inverting the band area ratios reported in Table 3 (i.e., 12CO2/13CO2) provides an estimate of Callisto’s 12C/13C ratio, which is a potentially useful indicator of the formation conditions in the Jovian subnebula and/or for the C-rich material delivered to Callisto’s surface in dust grains. Propagating the uncertainties, these 12C/13C ratios are 13 ± 1 and 20 ± 1 for Callisto’s leading and trailing hemispheres, respectively, using the non-Io-subtracted spectra binned to VIMS resolution (Figure 9). In contrast, the 12C/13C ratios measured using the Io-subtracted data are 48 ± 10 and 50 ± 6 for Callisto’s leading and trailing hemispheres, respectively.
Using the same technique, we calculated 12C/13C ratios of 17 ± 2 for Phoebe and 63 ± 15 for Iapetus. For context, all other solar system bodies and materials for which 12C/13C ratios have been measured in gases or solids—albeit using different techniques to those reported here—have 12C/13C ratios close to the canonical terrestrial value of 90 ± 10. These include the Sun (Lyons et al. 2018), Venus (Hoffman et al. 1980), Earth (Hauri et al. 2002), the Moon (Kerridge et al. 1975), Mars (e.g., Webster et al. 2013), Vesta (Grady et al. 1997), chondrites (e.g., Alexander et al. 2007), interplanetary dust particles (Floss et al. 2006), more than 30 comets (e.g., Manfroid et al. 2009), Jupiter (Niemann et al. 1996), and Saturn (Fletcher 2009). The 12C/13C ratios for Iapetus (63 ± 15) and Europa (83 ± 19; Villanueva et al. 2023a) are within this terrestrial value range, within uncertainty. A slightly larger spread is seen among comets (12C/13C = 60 to 120, e.g., Wyckoff et al. 2000), with an extreme value of 40 ± 14 for H2CO gas in comet 67P (Altwegg et al. 2020). Consequently, the 12C/13C ratios measured using the Io-subtracted data are lower than the canonical terrestrial value (∼2_σ_ difference), but fairly close to the lower range exhibited by most comets (<2_σ_ difference) and close to Iapetus’ 12C/13C ratio (<1_σ_ difference). The 12C/13C ratios for the non-Io-subtracted Callisto data are much lower than terrestrial values (>3_σ_ difference), as well as the ratios exhibited by most outer solar system objects, except Phoebe.
In a scenario where 13C is enriched on Callisto, determining whether this enrichment results from its formation conditions or its subsequent chemical evolution is challenging. Unlike Phoebe, whose high 13C content has been ascribed to its formation history as a captured moon (Clark et al. 2019), Callisto’s circular, low-inclination, prograde orbit indicates a likely formation in Jupiter’s circumplanetary disk. In this case, Callisto’s accreted carbon would be expected to have the 12C/13C ratio measured for Jupiter’s atmosphere, 93 ± 5 (Niemann et al. 1996), similar to 13C on Europa (Villanueva et al. 2023a).
Formation conditions in the Jovian subnebula alone cannot explain Callisto’s hemispheric dichotomy in its non-Io-subtracted 13CO2/12CO2 ratios. One possibility is that some of Callisto’s dark material results from an in-fall of CN-bearing debris from Jupiter’s irregular satellites that are likely captured objects, possibly originating in the primordial Kuiper Belt similar to Phoebe (e.g., Jewitt & Haghighipour 2007; Nicholson et al. 2008; Nesvorný 2018). When captured into the developing Jovian system, these satellites may have sampled out-of-midplane, 13C-rich regions of the protoplanetary disk. In such regions, the disk CO (its main carbon source) would have been dense enough for 12CO to shield itself from photolytic UV radiation from the early Sun, thereby staying in the gas phase, whereas more tenuous 13CO was photolyzed to products that eventually resulted in 13C-rich material (Woods & Willacy 2009) that condensed into solids. Self-shielding of CO has similarly been invoked to explain unusual 1:1 17O/16O and 18O/16O correlations in meteorite mineral phases (Lyons & Young 2005), the Sun’s light C isotope composition relative to the Earth (Lyons et al. 2018), and Phoebe’s large enrichment in 13C (Neveu et al. 2020). In each case, it has been assumed that the isotopically heavy material condensed into solids (ices or dust) that accreted onto, or coated, local planetesimals.
Subsequent collisions between members of the original irregular satellite population could have generated substantial amounts of debris in the form of dust grains, much of which migrated inward on decaying orbits due to Poynting–Robertson drag (Burns et al. 1979). Dust originating on retrograde irregular satellites should preferentially collide with the leading and anti-Jovian sides of the outermost regular satellite, Callisto (Bottke et al. 2010, 2013; Chen et al. 2024). Callisto’s slightly darker and redder leading hemisphere (Morrison et al. 1974) has been attributed to the accumulation of red dust from the retrograde irregular satellites (Bottke et al. 2010). 13C delivered to Callisto in dust grains should be well mixed with H2O during collisional events, representing ideal production sites for radiolytic generation of 13CO2.
The discrepancy between our 13CO2/12CO2 band depth and area ratios in the non-Io-subtracted data, however, highlights the need for caution when interpreting these results as Phoebe exhibits enhancement of both its band area and depth ratios, unlike Callisto (Figure 10). Additionally, the 13CO2/12CO2 band ratios measured using Io-subtracted data indicate that isotopic carbon abundances on Callisto are similar to Iapetus and other bodies that exhibit terrestrial-like values, suggesting that Callisto’s surface is not enriched in 13C, unlike Phoebe. A quantitative investigation of possible enhancement of 13C via delivery of irregular satellite dust is beyond the scope of this study and left for future work. In situ sampling by instruments on the Europa Clipper and JUICE spacecraft of ejected dust grains and 13CO2 molecules in Callisto’s atmosphere will improve our understanding of the origin of 13C on the Galilean satellites and refine the isotopic ratios presented here.
4.4. Deciphering the 4.57 _μ_m Feature
Callisto’s 4.57 _μ_m band has remained an enigma since its initial discovery by NIMS. Its broad shape and band strength point to the presence of contributing constituent(s) in fairly high abundances on Callisto’s surface. Our results confirm that the 4.57 _μ_m feature is stronger on Callisto’s leading hemisphere, consistent with ground-based data (Cartwright et al. 2020). Our analysis also shows that the band center is shifted to shorter wavelengths on Callisto’s trailing hemisphere compared to its leading side, suggesting that the chemical nature of the 4.57 _μ_m feature is different on each hemisphere. At the regional scale, the 4.57 _μ_m band is weakest near the center of Callisto’s trailing side and somewhat weaker in Asgard and Valhalla compared to their surrounding terrains. Therefore, the 4.57 _μ_m band and 12CO2 appear to be spatially antiassociated, with more 12CO2 present where the 4.57 _μ_m band is weaker (Figure 11).
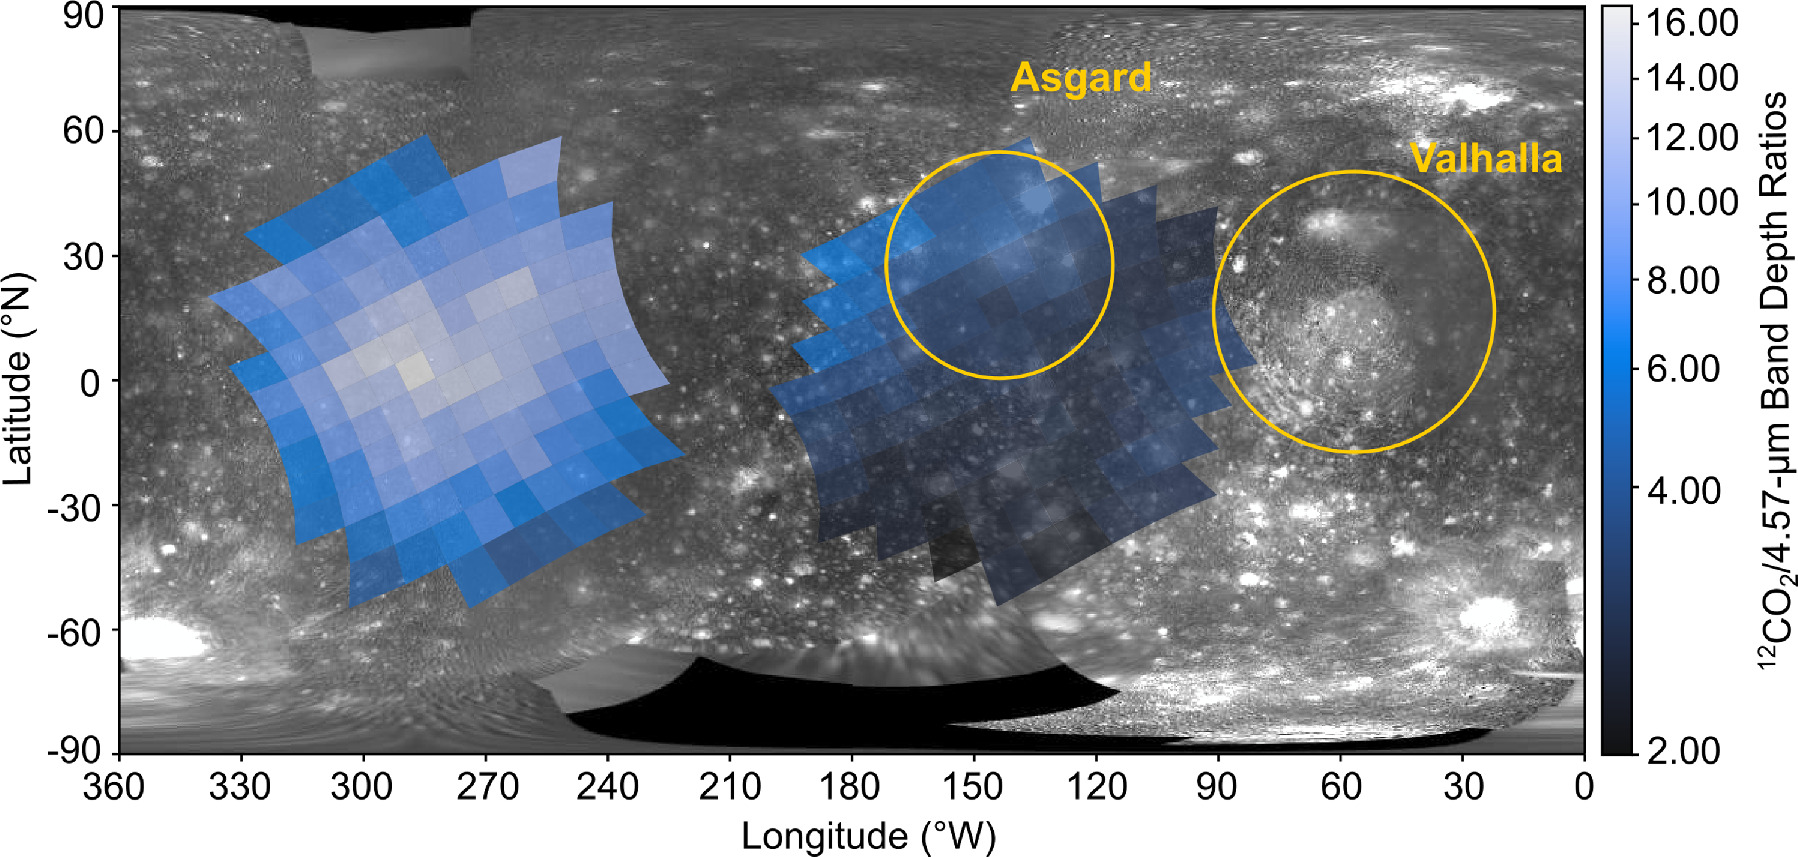
Figure 11. 12CO2/4.57 _μ_m band depth ratios highlighting the apparent spatial antiassociation between these two spectral features. White and light blue colors indicate regions where 12CO2 is strongest, i.e., trailing hemisphere, and dark blue colors indicate regions where the 4.57 _μ_m band is stronger, i.e., leading hemisphere, away from Asgard and Valhalla (extents approximated with gold circles).
Download figure:
Standard imageHigh-resolution image
This antiassociation may arise from a few different scenarios. It is possible that radiolytic CO2 is generated out of the C-rich components that contribute to the 4.57 _μ_m band. In this scenario, the 4.57 _μ_m band is likely dominated by more radiolytically resistant components, such as CN-bearing organic residues. These CN-bearing species could have been delivered in irregular satellite dust grains (perhaps along with 13C), or delivered from other primordial objects impacting Callisto, such as micrometeorites, asteroids, and comets. Alternatively, CN-bearing organics could be native to Callisto’s crust and exposed by impact events.
A 4.57 _μ_m feature, exhibited in refractory organic residues formed via the irradiation of primordial ices such as N2 mixed with CH4, has been measured in the laboratory and is stable at room temperature (Accolla et al. 2018). This feature does not require H2O or other O-bearing parent molecules to form it, possibly hinting at a reducing formation environment. Additionally, the 4.57 _μ_m feature is shifted to shorter wavelengths compared to a well-documented 4.62 _μ_m band in the interstellar medium attributed to the OCN− radical (e.g., Pendleton et al. 1999; Hudson et al. 2001; McClure et al. 2023), and these two features may be chemically distinct. Laboratory experiments continue to inform our assignment of the shorter wavelength 4.57 _μ_m feature relative to the OCN- absorption feature and the CN fundamental stretch (Gerakines et al. 2004; Accolla et al. 2018; Gerakines et al. 2022). The presence of such organic residues on Callisto, if they formed in an H2O-poor environment, supports delivery in dust grains from irregular satellites that may also be H2O-poor. Upcoming JWST observations of Jovian irregular satellites (Sharkey et al. 2023a) will shed light on the possible compositional ties between these objects and Callisto’s surface chemistry (Sharkey et al. 2023b), in particular for clarifying the origin of the 4.57 _μ_m feature.
Alternatively, the 4.57 _μ_m band could result from radiolytically generated, highly oxidized carbon molecules that form from energetic charged particles that could preferentially bombard Callisto’s leading side (Liuzzo et al. 2019). In this scenario, the 4.57 _μ_m band might result from C3O2 mixed with other carbon chain oxides (e.g., C5O2, 13C12C2O2, C7O2) that exhibit overlapping features, combining into a broad, somewhat asymmetric absorption band spanning 4.27 to 4.63 _μ_m (e.g., Trottier & Brooks 2004; Strazzulla et al. 2007). However, irradiation of C3O2 mixed with CO2, CO, or H2O shifts the center of this broad feature to between 4.46 and 4.48 _μ_m (Gerakines & Moore 2001), notably offset from Callisto’s 4.57 _μ_m feature. C3O2 is typically generated via the irradiation of CO ices at cryogenic temperatures (∼16 K; e.g., Bennett et al. 2008) that are much lower than those exhibited by Callisto’s surface. Although a weak CO band might exist near 4.67 _μ_m on its trailing hemisphere (see Section 4.5), this feature most likely results from ongoing radiolytic processing and is not a tracer of primordial CO ice. Furthermore, radiolytic production of C3O2 from CO would occur in conjunction with efficient production of CO2, suggesting that the 4.25 and 4.57 _μ_m spectral features should be spatially associated on Callisto, whereas they are apparently antiassociated (Figure 11). Consequently, if higher-order carbon chain oxides are the primary contributors to the 4.57 _μ_m band, then another chemical process is operating to weaken the signature of CO2 where the 4.57 _μ_m band is strongest.
Perhaps, the 4.57 _μ_m band instead results from radiolytically generated CS2. It has been suggested that sulfur-bearing dust grains could be delivered from Jupiter’s irregular satellites, preferentially accumulating on Callisto’s leading side, mixing with C-rich material, where they are subsequently irradiated to form CS2 (Cartwright et al. 2020). If S is delivered in dust and irradiated into CS2, then SO2 should also be present, forming from irradiation of delivered S mixed with native H2O (e.g., Moore et al. 2007). Although prior analysis of NIMS data suggested a 4.05 _μ_m band resulting from SO2 is present on Callisto, as well as on Europa and Ganymede (e.g., McCord et al. 1997, 1998a), subsequent analyses of ground-based data sets have found scant evidence for SO2 on the icy Galilean moons (e.g., Brown & Hand 2013; Cartwright et al. 2020). It has been suggested that Callisto’s 4.02 _μ_m band might result from hydrogen disulfide (H2S2), disulfanide (HS2), or S allotropes (S2, S3, etc.), as opposed to SO2 frost that exhibits a strong feature near 4.07 _μ_m (Cartwright et al. 2020; summarized in Table 2). It is possible that SO2 gets further processed into SO4 (Carlson et al. 2002), limiting the abundance of SO2 on the icy Galilean moons’ surfaces. Furthermore, irradiation experiments of simple O-, C-, and S-bearing molecules over a range of low temperatures (10–150 K) found that CS2 and C3O2 can form together, with CS2 exhibiting a band near 6.56 _μ_m, whereas C3O2, and not CS2, dominates near 4.57 _μ_m (Ferrante et al. 2008).
It therefore seems more likely that Callisto’s 4.57 _μ_m band is composed of native or impactor-delivered CN-bearing species and not C3O2 or CS2. This finding has important implications for Callisto’s chemical evolution as it supports the presence of nitrogen-bearing species, which have yet to be confirmed on Europa or Callisto and were only recently confirmed by Juno’s Jupiter Infrared Auroral Mapper (JIRAM) on Ganymede in the form of NH4 (Tosi et al. 2024). The CN triple bond is a possible tracer of prebiotic chemistry and complex organics that may have been delivered to early Earth in impactors (e.g., Matthews & Minard 2006). The presence of nitriles and isonitriles on Callisto therefore could be a key tracer of habitability in the broader Jupiter system, in particular if these compounds originally accreted into Europa as it formed, or were delivered in dust and transported through Europa’s icy shell into its subsurface ocean via active chaos terrains or other geologic conduits (e.g., Hand et al. 2009; Hesse et al. 2022). Similar to Callisto, Phoebe exhibits a spatial antiassociation between its 4.26 _μ_m 12CO2 feature and 4.55 _μ_m feature, which is attributed to CN-bearing organics (Coradini et al. 2008). Future studies that compare the ∼4.6 _μ_m features on Callisto and Phoebe could reveal key insights into the nature of CN-bearing species in the outer solar system.
If the C contributing to Callisto’s 4.57 _μ_m band is radiolytically cannibalized to form CO2, the associated fate of nitrogen is not apparent. Perhaps, nitrogen is eventually locked up in the form of NH4, putatively detected in some ground-based observations (Calvin & Clark 1993). Supporting evidence for NH4 on Callisto in NIRSpec data or other spectral data sets is ambiguous (Table 2). As examined previously (Gerakines et al. 2022), laboratory experiments that work to elucidate the relationship between radiolytic formation and destruction of CN-bearing compounds, CO2, and OCN−, particularly under conditions relevant to Callisto, are needed to understand the origin and fate of the 4.57 um band and determine whether it shares chemical connections to CN-bearing organics detected elsewhere.
4.5. Candidate Constituents for Other Features
Carbon oxides? We considered a variety of C-bearing species to explain the presence of subtle features centered near 3.28, 3.43, 3.51, 3.72, 4.67, and 4.92 _μ_m, based on their central wavelength positions (Table 1) and visual assessment of their band shapes. A suite of laboratory experiments conducted over the past few decades have routinely demonstrated that irradiation of H2O ice mixed with carbonaceous material generates CO and CO2 molecules and lower abundances of other carbon oxides, including H2CO3, C3O2, carbon trioxide (CO3), dicarbon oxide (C2O), and other, higher-order carbon chain oxides (e.g., Brucato et al. 1997; Gerakines & Moore 2001; Mennella et al. 2004; Loeffler et al. 2005; Strazzulla et al. 2007; Ferrante et al. 2008; Bennett et al. 2010). These experiments demonstrated that many different irradiation sources (protons, electrons, heavy ions, UV photons), spanning sub-KeV to MeV energies, spur radiolytic production of carbon oxides. The H2O and C-rich surface of Callisto, orbiting within Jupiter’s magnetosphere, may therefore serve as an ideal test bed for radiolytic generation of CO2 and other carbon oxides.
The subtle band centered near 4.67 _μ_m is consistent with the wavelength position of the C–O stretch of carbon monoxide. CO should be continually generated as a transitory product in a radiolytic production cycle of CO2 (e.g., Raut et al. 2012). The presence of CO is therefore expected on C-rich icy bodies like Callisto that are bombarded by energetic particles. However, CO ice is hyper volatile at Callisto’s estimated peak surface temperatures (∼170 K, Figure 5; e.g., Fray & Schmitt 2009 and references therein). If CO is confirmed, it must be trapped in defects or pore spaces in H2O ice or hosted by some other component in Callisto’s regolith, as was suggested to explain the possible presence of CO on Phoebe (Coradini et al. 2008). A similar regolith-trapping process could retain O2 on Callisto and the other icy Galilean moons (e.g., Spencer et al. 1995; Spencer & Calvin 2002; Carberry Mogan et al. 2023). If CO is temporarily retained on Callisto’s surface, then it might also be present in its atmosphere, albeit prior observations did not detect CO gas (Strobel et al. 2002). Future in situ sampling of Callisto’s neutral atmosphere by MASPEX on Europa Clipper and NIM on JUICE will allow for a more sensitive search for low levels of atmospheric CO.
The broad shape of the 4.92 _μ_m feature is consistent with the C–O symmetric stretching mode (v 1 ) in OCS measured in the laboratory and detected in the interstellar medium (e.g., Palumbo et al. 1997; Ferrante et al. 2008), including recent characterization by NIRSpec in dense molecular clouds (McClure et al. 2023). OCS also displays an absorption band near 3.4 _μ_m that might explain Callisto’s 3.43 _μ_m band, as suggested by a prior ground-based study (Cartwright et al. 2020). The 4.92 _μ_m feature may also result from CO3, which forms from irradiated CO and CO2. CO3 can form alongside OCS in substrates composed of carbon oxides and sulfur-bearing species, with both species contributing to 4.9 _μ_m features that are difficult to untangle (see Figure 5 in Ferrante et al. 2008). Alternatively, crystalline 12CO2 ice can exhibit a 4.9 _μ_m band (e.g., Hansen 1997), but it is uncertain whether this feature would be expressed by the complexed CO2 that dominates Callisto’s surface.
Na-bearing species? Several spectral features on Callisto hint at the possible presence of Na-bearing minerals. The broad elbow shaped feature centered near 3.72 _μ_m corresponds to a modest change in the slope of Callisto’s continuum slope between ∼3.7 and 3.8 _μ_m. Oxalates (C2O4-bearing species) like natroxalate (Na2C2O4; Applin et al. 2016) and sulfates (SO4-bearing salts) such as thenardite (Na2SO4; De Angelis et al. 2021) can exhibit broad features in the 3.6–3.8 _μ_m wavelength range. Similar to Ceres’ strong 4 _μ_m band (e.g., De Sanctis et al. 2016; Carrozzo et al. 2018; Raponi et al. 2019), Callisto’s prominent 4.02 _μ_m band has been attributed to Na-bearing carbonates (Johnson et al. 2004). Additionally, Callisto’s subtle 3.43 and 3.51 _μ_m features could be weak tracers of Na2CO3 or other carbonates. Na-bearing species have been implicated on the surface of Europa in the form of Na carbonates (e.g., McCord et al. 1998b) and irradiated NaCl (e.g., Trumbo et al. 2019, 2022) that are predicted to have originated in its internal ocean (e.g., Hand & Carlson 2015) and from Na delivered to Europa via volcanic outgassing on Io (e.g., Carlson et al. 2009). By extension, perhaps Na-bearing components are native to Callisto, accreting into its interior as it formed in the Jovian subnebula. In this scenario, Na-rich material in the crust might form salts, if in contact with, and subsequently extracted from, pockets of liquid water in Callisto’s early history. Alternatively, perhaps Na salts could form in response to aqueous alteration driven by impact-induced melting (Yasui et al. 2021), assuming Na is available in Callisto’s crust or delivered in impactors. Once formed, Na salts could be subsequently exposed by impact gardening.
Organics. The subtle absorption bands near 3.28, 3.43, and 3.51 μ_m might result from short-chain CH-bearing organics (i.e., hydrocarbons), as suggested in prior work (McCord et al. 1997, 1998a). The radiolysis of surface hydrocarbons has been implicated as a possible source of the H2 detected in Callisto’s atmosphere (Carberry Mogan et al. 2022). These weak features show comparable band strengths on Callisto’s leading and trailing side (<1_σ difference), suggesting the constituents that contribute to them may be well mixed in Callisto’s dark regolith, perhaps serving as source material for radiolytic CO2. Such CH-bearing components of functional groups may also be incorporated into CN-bearing constituents in long-chain refractory organic residues (complex organic molecules similar to laboratory tholins) that have been implicated for the 4.57 _μ_m band (McCord et al. 1998a). Additionally, a feature detected near 3.65 _μ_m in JIRAM data of Ganymede has been attributed to aldehydes (Tosi et al. 2024), and perhaps these species are contributing to Callisto’s weak 3.72 _μ_m feature (albeit there is a large wavelength difference).
Future work. Subsequent studies that more rigorously compare observed spectral features to laboratory spectra of a wide range of C- and S-bearing constituents are needed to better understand Callisto’s surface chemistry. These six features are fairly weak, and confirmation of their presence with JWST and other telescopes is needed. Furthermore, high spatial resolution mapping of Callisto’s spectral properties during upcoming close flybys by NASA’s Europa Clipper and ESA’s JUICE spacecraft will be key to understanding its surface chemistry. Such spectral maps could be used to identify possible spatial associations between different spectral features. For example, a spatial association between the broad 4.57 _μ_m band and subtle features centered near 3.28, 3.43, and 3.51 _μ_m would suggest these features result from refractory organic residues that exhibit C–H and C–N stretching modes. Alternatively, spatial associations between the 3.43 and 3.51 _μ_m bands, along with the 3.72, 4.02, and 4.92 _μ_m bands, would suggest they result from carbonates/CO3. If only the 3.43 and 4.92 _μ_m bands are associated, they could result from OCS.
4.6. A CO2 Cycle on Callisto
The results reported here confirm that Callisto is a world dominated by carbon and H2O, with minor amounts of S-bearing species likely present as well. Landscape evolution models suggest the degraded nature of craters on Callisto, formation of icy pinnacles, and the numerous examples of mass wasting features result from the sublimation of H2O ice and crustal CO2 ice exposed at the surface or retained in its near-surface (White et al. 2016). In this scenario, solid-state CO2 should be gradually transferred from Callisto’s surface and subsurface to its atmosphere. Most of this atmospheric CO2 should eventually condense and get trapped in Callisto’s regolith, with only a small fraction sufficiently accelerated by interactions with magnetospheric ions to experience Jeans escape. The presence of CO2 gas across Callisto’s disk supports this surface–atmosphere transfer process, which may be enhanced in some regions, such as Valhalla and a large plains unit on its trailing side (Figure 5, Section 4.2). A similar process might be occurring for atmospheric O2, which is potentially enriched by transfer of O2 molecules weakly bound in defects and on grain surfaces in Callisto’s porous regolith (Carberry Mogan et al. 2023).
Some fraction of atmospheric CO2 should migrate and condense on colder landforms, in particular on Callisto’s nightside, hypothetically contributing to the growth of icy pinnacles (or at least temporarily cold trapping on them). Unlike Europa or Ganymede, there is little evidence for widespread endogenic activity on Callisto, and its surface is likely only geologically refreshed by impacts. Consequently, Callisto has built up a thick lag deposit of dark material, which might be isotopically heavy, as well as rich in amorphous C and other possible radiolytic end products, formed by continual charged particle bombardment of organics. New impact events can puncture this dark blanket, mixing crustal H2O ice and other components with ancient, irradiated regolith material, perhaps providing new radiolytic production sites for CO2 molecules. This process could help replenish Callisto’s inventory of solid-state CO2. Such a process could also expose Na-bearing salts retained in the crust that might react with Sn+ ions to form sulfates and other S-bearing species, as suggested for the proposed exogenic formation of Mg-sulfates on Europa (Brown & Hand 2013).
A key test of CO2 surface–atmosphere cycling is whether crystalline CO2 ice is present and spatially associated with impact features and other landforms that show exposed crustal materials. Although we do not directly detect pure CO2 ice, the shifted central wavelength of the complexed CO2 band in spaxels associated with Asgard and Valhalla could result from the presence of minor amounts of crystalline CO2. Alternatively, another component mixed with CO2, such as amorphous H2O ice (Bockelée-Morvan et al. 2024) or perhaps the CN-bearing organics that may contribute to the 4.57 _μ_m band, might explain the wavelength shift of Callisto’s 12CO2 band. These contaminants could also contribute to the broad base component of Callisto’s 13CO2 band. Laboratory experiments conducted under conditions relevant to Callisto are needed to substantiate these possibilities. Furthermore, close passes made by spacecraft with near-infrared spectrometers could look for the spectral signature of crystalline CO2 ice, in particular in fresh craters where exposed crustal deposits might still be present. Albeit, even if a clear association between CO2 ice and fresh craters is eventually established in spacecraft data sets, additional tests will be needed to discern between native CO2 ice and condensed CO2 ice that is formed elsewhere and subsequently cold trapped on fresh craters that tend to be brighter and colder.
4.7. Comparing Callisto to Other Icy Bodies
CO 2 on Callisto, Ganymede, and Europa. The icy Galilean moons all exhibit spectral features consistent with the v 3 mode of 12CO2, which were originally detected by Galileo/NIMS (Carlson et al. 1996) and confirmed by JWST/NIRSpec observations in 2022 (Figure 12). When comparing the integrated NIRSpec spectra of these moons, Callisto displays the strongest 12CO2 band, with band depths ranging between 15% and 40% of the continuum, Ganymede’s 12CO2 feature exhibits band depths between 9% and 19% of the continuum (Bockelée-Morvan et al. 2024), and Europa’s 12CO2 feature has band depths between 5% and 10% (Villanueva et al. 2023a). Callisto’s trailing hemisphere and Europa both display 4.25 _μ_m CO2 bands that are remarkably similar in central position (Figure 12), whereas Ganymede’s 12CO2 band is shifted closer to 4.26 _μ_m. Europa also displays a 4.27 _μ_m band consistent with crystalline CO2 ice, which is absent from Callisto, but Ganymede’s 12CO2 band center does shift to ∼4.27 _μ_m at high north polar latitudes, possibly because CO2 molecules are trapped in amorphous H2O ice (Bockelée-Morvan et al. 2024). Similarly, the shifted position of Ganymede’s and Callisto’s 12CO2 band at low latitudes on their leading sides might result from CO2 trapped in H2O ice (Bockelée-Morvan et al. 2024), or alternatively, perhaps minor amounts of crystalline CO2 ice are mixed in with the stronger complexed CO2 band, thereby convolving the two features.
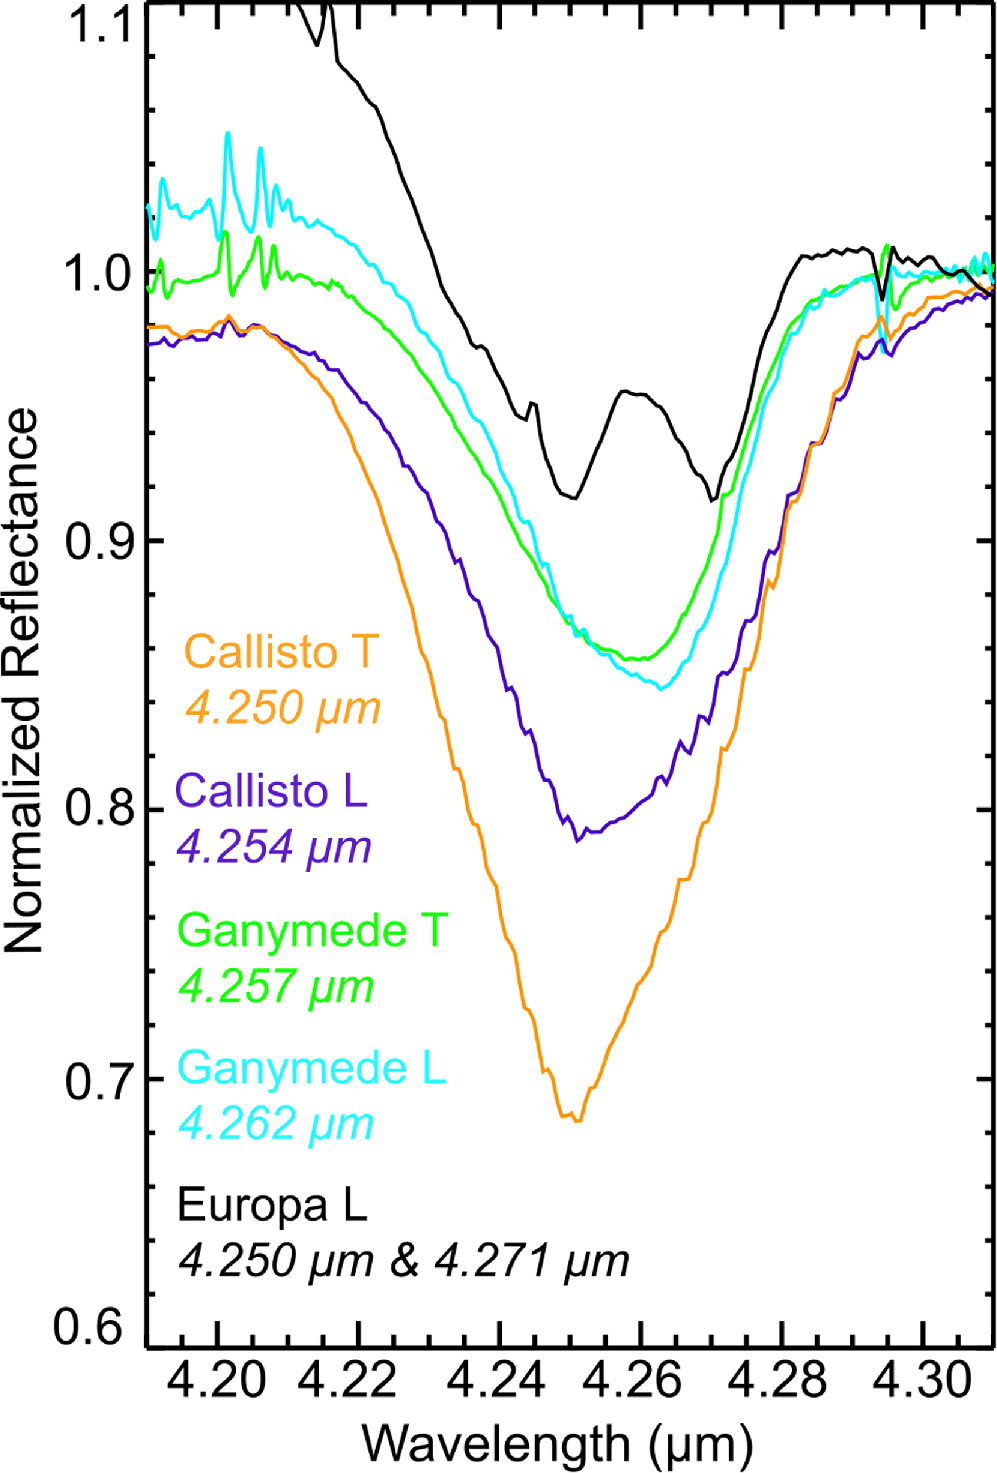
Figure 12. Integrated NIRSpec spectra of Callisto's leading (purple) and trailing (orange), Ganymede's leading (blue) and trailing (green), and Europa's leading (black) hemisphere highlighting the 12CO2 band, normalized to 1 at 4.305 _μ_m. Central wavelengths for each 12CO2 band are listed on the plot using the same color scheme. Error bars have been suppressed for clarity.
Download figure:
Standard imageHigh-resolution image
Although NIRSpec confirmed the presence of CO2 gas rovibrational lines at Callisto, measured earlier by NIMS (Carlson 1999), these emission features were not detected by NIRSpec at Europa (Villanueva et al. 2023a). The reason for the apparent disparity in the presence of CO2 gas is uncertain, but the higher peak surface temperatures and larger surface inventories of CO2 on Callisto could help maintain an ongoing CO2 sublimation–condensation cycle that is more difficult to sustain at Europa and perhaps Ganymede, limiting the amount of CO2 gas in their atmospheres. Albeit peak CO2 gas abundances do not appear to be associated with the subsolar region on Callisto (Figure 5), highlighting the complexities in the processes that form and sustain its CO2 atmosphere. Additionally, differences in the geochemical evolution of volatile components in the near-surface layers of these moons, due to differences in geologic activity and associated surface ages, may play a role as well.
Are Callisto and Ceres spectral analogs? Although the main belt asteroid Ceres is smaller than Callisto, experiences higher peak temperatures (∼235 K at the subsolar point; Tosi et al. 2015), and does not orbit within the massive Jovian magnetosphere, they appear to share some interesting compositional similarities. Ceres has a surface rich in carbonates, such as Na2CO3 (e.g., De Sanctis et al. 2016; Carrozzo et al. 2018; Raponi et al. 2019), and hydrated minerals like NH4-bearing phyllosilicates (e.g., Ammannito & Ehlmann 2022), which might be present on Callisto. Both worlds have ancient, heavily cratered surfaces with deposits of more volatile components in impact features, including H2O ice on Ceres (Combe et al. 2016; Platz et al. 2016; Combe et al. 2019) and solid-state CO2 on Callisto. Additionally, dark material on Ceres likely includes organics (De Sanctis et al. 2017; Prettyman et al. 2017; Marchi et al. 2019). One possible reason why Ceres and Callisto exhibit similar spectral properties is that Ceres may have formed in the outer solar system and was subsequently scattered into the main belt (e.g., Raymond & Izidoro 2017; de Sousa et al. 2022; Raymond & Nesvorný 2022). In this scenario, Ceres and Callisto might have accreted similar inventories of starting components, with Callisto eventually retaining more H2O due to its colder environment. Further consideration of how these two worlds have chemically evolved would improve our understanding of the spectrum of ocean worlds, with less active Callisto and Ceres perhaps representing a geologic bookend to hyperactive Enceladus and Europa. Future close flybys of Callisto by the JUICE and Europa Clipper spacecraft will enable better spectral and geologic comparison to Ceres and other bodies at far higher spatial resolutions than can be achieved by JWST.
We analyzed integrated spectra and band maps of Callisto, made using JWST/NIRSpec IFU spectral cubes (G395H). These high S/N data confirmed that Callisto’s surface has a large inventory of solid-state 12CO2, indicated by a prominent 4.25 _μ_m absorption band that was previously attributed to complexed CO2, where this component is molecularly bound to more refractory species, allowing it to persist at Callisto’s peak surface temperatures (∼170 K). This broad CO2 band, spanning 4.2–4.3 _μ_m, is overprinted by CO2 gas rovibrational emission lines in the NIRSpec data, confirming the previously estimated abundance of CO2 in Callisto’s atmosphere. Our CO2 gas density estimates are a factor of 2 to 10 lower than the estimated density of the (likely) main atmospheric constituent O2. The signature of solid-state CO2 is significantly stronger on Callisto’s trailing hemisphere, peaking at low latitudes near its apex, and steadily decreasing from this central location. On Callisto’s leading hemisphere, the signature of CO2 is weaker, peaking in locations associated with the Asgard and Valhalla impact basins, suggesting it is influenced by regional geologic terrains. The central wavelength of the CO2 band is also distinct on each hemisphere, centered close to 4.25 _μ_m on Callisto’s trailing side but shifted to 4.258 _μ_m in the spaxels covering Asgard and Valhalla.
The bullseye pattern distribution on its trailing side is consistent with radiolytic production of CO2 molecules, out of native carbonaceous species mixed with H2O, via interactions with Jupiter’s corotating plasma that preferentially flows onto the trailing hemispheres of the Galilean moons. The overall weaker 12CO2 features and more mottled distribution on its leading side are more consistent with exposure of crustal CO2 in impact features and/or cold trapping of CO2 sourced from elsewhere. An ongoing sublimation–condensation cycle could be operating on Callisto, where CO2 diffuses out of its dark regolith, gets transported in its tenuous atmosphere, and condenses on bright and relatively cold crater rims, ejecta blankets, and icy pinnacles (at least temporarily). Of note, the peak CO2 gas abundances do not coincide with the subsolar region on either hemisphere, highlighting that sputtering and radiolytic processes and interactions with large geologic terrains likely help sustain Callisto’s CO2 atmosphere.
These NIRSpec data confirmed the presence of a 4.38 _μ_m band that likely results from 13CO2. We measured Callisto’s 13CO2/12CO2 band area and depth ratios and compared them to the Saturnian moons: Phoebe, which is enriched in 13C, and Iapetus, which exhibits terrestrial-like values of 13C (Clark et al. 2019). We found that Callisto’s 13CO2/12CO2 band area ratios are similar to those of Phoebe, suggesting that Callisto’s surface may be enriched in 13C. In contrast, Callisto’s 13CO2/12CO2 band depth ratios are consistent with those of Iapetus, suggesting a terrestrial-like abundance of 13C on Callisto. The possible broadening of this feature by a calibration artifact may spuriously enhance its band area, suggesting that the band depth ratios could be more reliable. The disparity between these band ratios requires additional work to better constrain Callisto’s surface inventory of 13C.
We confirmed the presence of a broad 4.57 _μ_m absorption band that is significantly stronger on Callisto’s leading hemisphere and appears to be antiassociated with the distribution of solid-state 12CO2. This feature could result from CN-bearing organics that are native to Callisto and/or delivered in dust grains from the irregular satellites, which may serve as source material that is consumed by the radiolytic production cycle forming complexed CO2. We identified five other absorption features detected previously, centered near 3.28, 3.43, 3.51, 3.72, and 4.02 _μ_m, which could result from C-bearing species, such as organics and carbonates. We also detected two other absorption features for the first time on Callisto, centered near 4.67 and 4.92 _μ_m, possibly resulting from CO and OCS, respectively. These JWST/NIRSpec observations reinforce the existing body of work that indicates Callisto’s surface exhibits complex geological and chemical processing of C-rich material, evidenced by the ubiquitous presence of CO2 that is likely cycling between its surface and atmosphere. Follow-up observations by JWST/NIRSpec and other telescope facilities and instruments are needed to corroborate these subtle features.
This research is based on observations made with the NASA/ESA James Webb Space Telescope obtained from the Space Telescope Science Institute, which is operated by the Association of Universities for Research in Astronomy, Inc., under NASA contract NAS 5–26555. These observations are associated with program 2060 (JWST-GO-02060.001-A). G.L.V. and S.F. acknowledge support from NASA’s Goddard Astrobiology Program, Goddard’s Fundamental Laboratory Research (FLaRe), and the Sellers Exoplanet Environments Collaboration (SEEC). M.C. acknowledges support from the National Science Foundation through a Graduate Research Fellowship, grant No. DGE-1745301. K.d.K. and M.C. acknowledge support from the National Science Foundation through grant No. 2308280. M.N. was supported by NASA under award No. 80GSFC21M0002 (CRESST-II cooperative agreement between NASA GSFC and Univ. Maryland). G.S. is grateful to the Italian participation in the JUICE mission that is founded by the Italian Space Agency (ASI), in particular under the ASI-INAF agreement No. 2023-6-HH.0. Part of this work was carried out at the Jet Propulsion Laboratory, California Institute of Technology, under a contract with the National Aeronautics and Space Administration (80NM0018D0004). Government sponsorship is acknowledged.
A.1. Band Depth and Center Error Maps
Here, we report the error maps for band depth and center distribution plots for the 4.25 _μ_m 12CO2 band (Figure A1), 4.38 _μ_m 13CO2 band (Figure A2), and 4.57 _μ_m band (Figure A3) shown in Figures 6, 7, and 8, respectively.
A.2. Band Depth Map for the 4.38 _μ_m Feature
Here, we report the band depth map for the peak component of the 4.38 _μ_m 13CO2 band (Figure A4), complementing the base + peak components of the 4.38 _μ_m 13CO2 band shown in Figure 7.
A.3. Description of Possibly Spurious and Missing Features
In this appendix, we investigate whether Callisto’s 4.38 _μ_m band could be an artifact. We also describe several weak features that may result from artifacts or incompletely removed stellar lines. Finally, we detail absorption features that were detected in other data sets but are not observed in the integrated NIRSpec data of Callisto.
Is Callisto_’_s 4.38 μm band an artifact? It has been suggested that a broad feature centered near 4.38 _μ_m in NIRSpec G395H reflectance spectra of Ganymede could be a calibration artifact (Bockelée-Morvan et al. 2024). A similar 4.38 _μ_m feature has been detected in NIRSpec data of Io, collected during Jupiter eclipse when Io’s spectral properties should be dominated by thermal emission (de Pater et al. 2023). Saturn’s A ring also exhibits a subtle 4.37 _μ_m feature in NIRSpec PRISM mode data, which may be a pipeline calibration issue that contributes a wide and subtle “dip” in the high S/N data reduced using a solar reference spectrum (Hedman et al. 2023). In contrast, the targets observed by NIRSpec that are flux calibrated using stars observed by NIRSpec (i.e., solar system object spectrum divided by G-type star spectrum) often do not exhibit the same subtle dip as it is divided out.
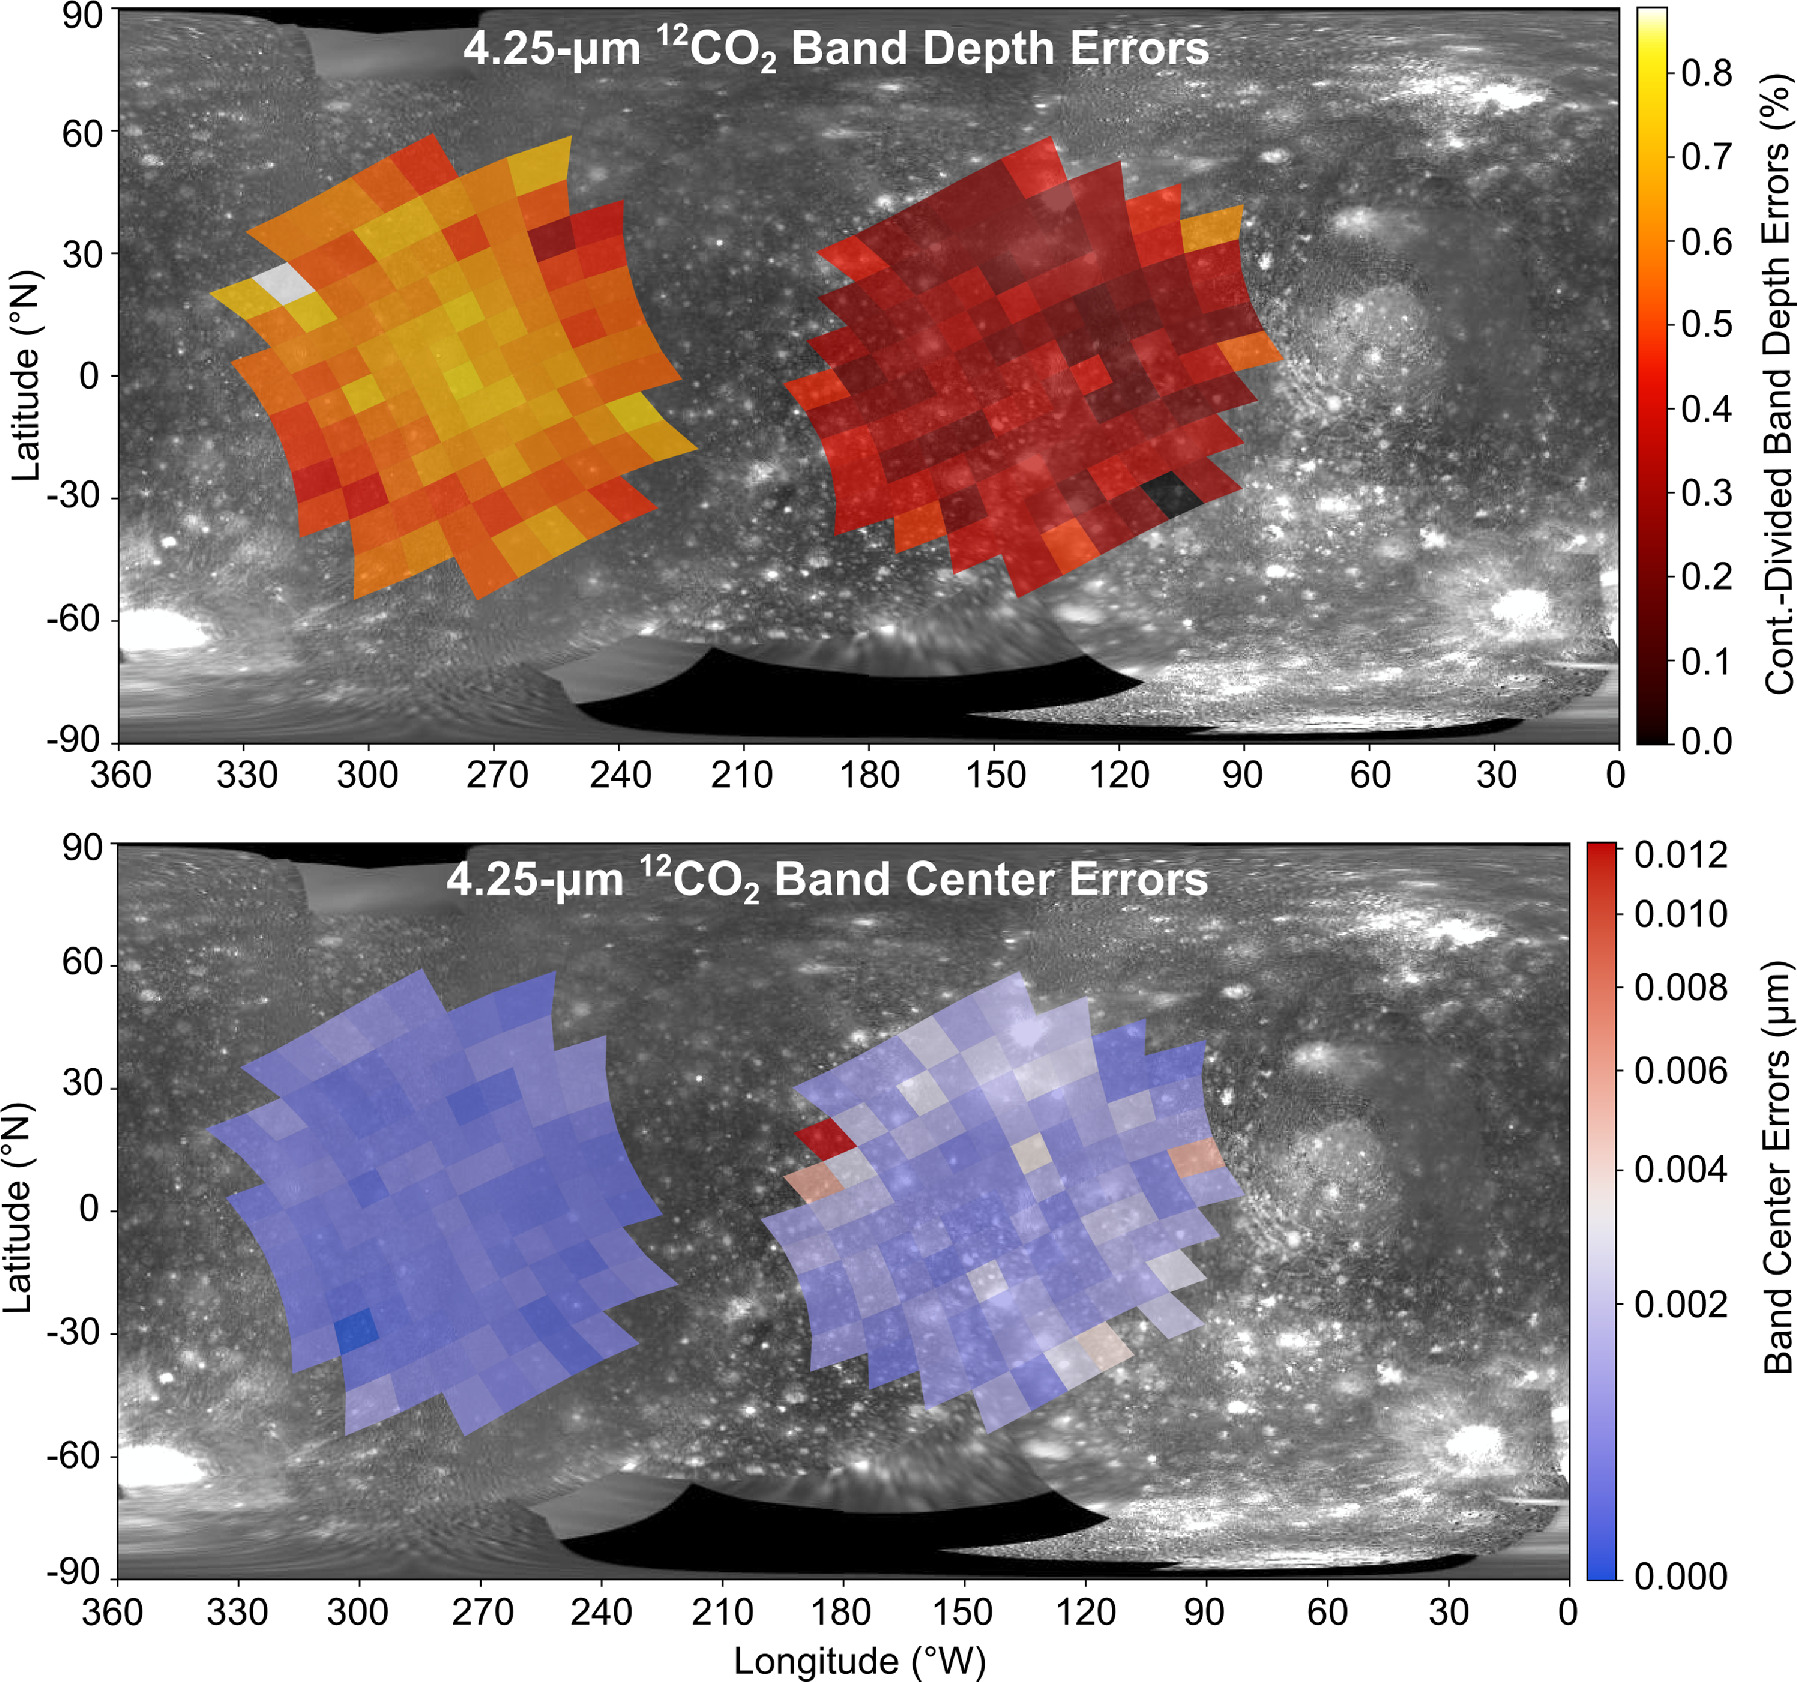
Figure A1. 4.25 _μ_m 12CO2 band depth (top) and band center (middle) error maps for data shown in Figure 6.
Download figure:
Standard imageHigh-resolution image
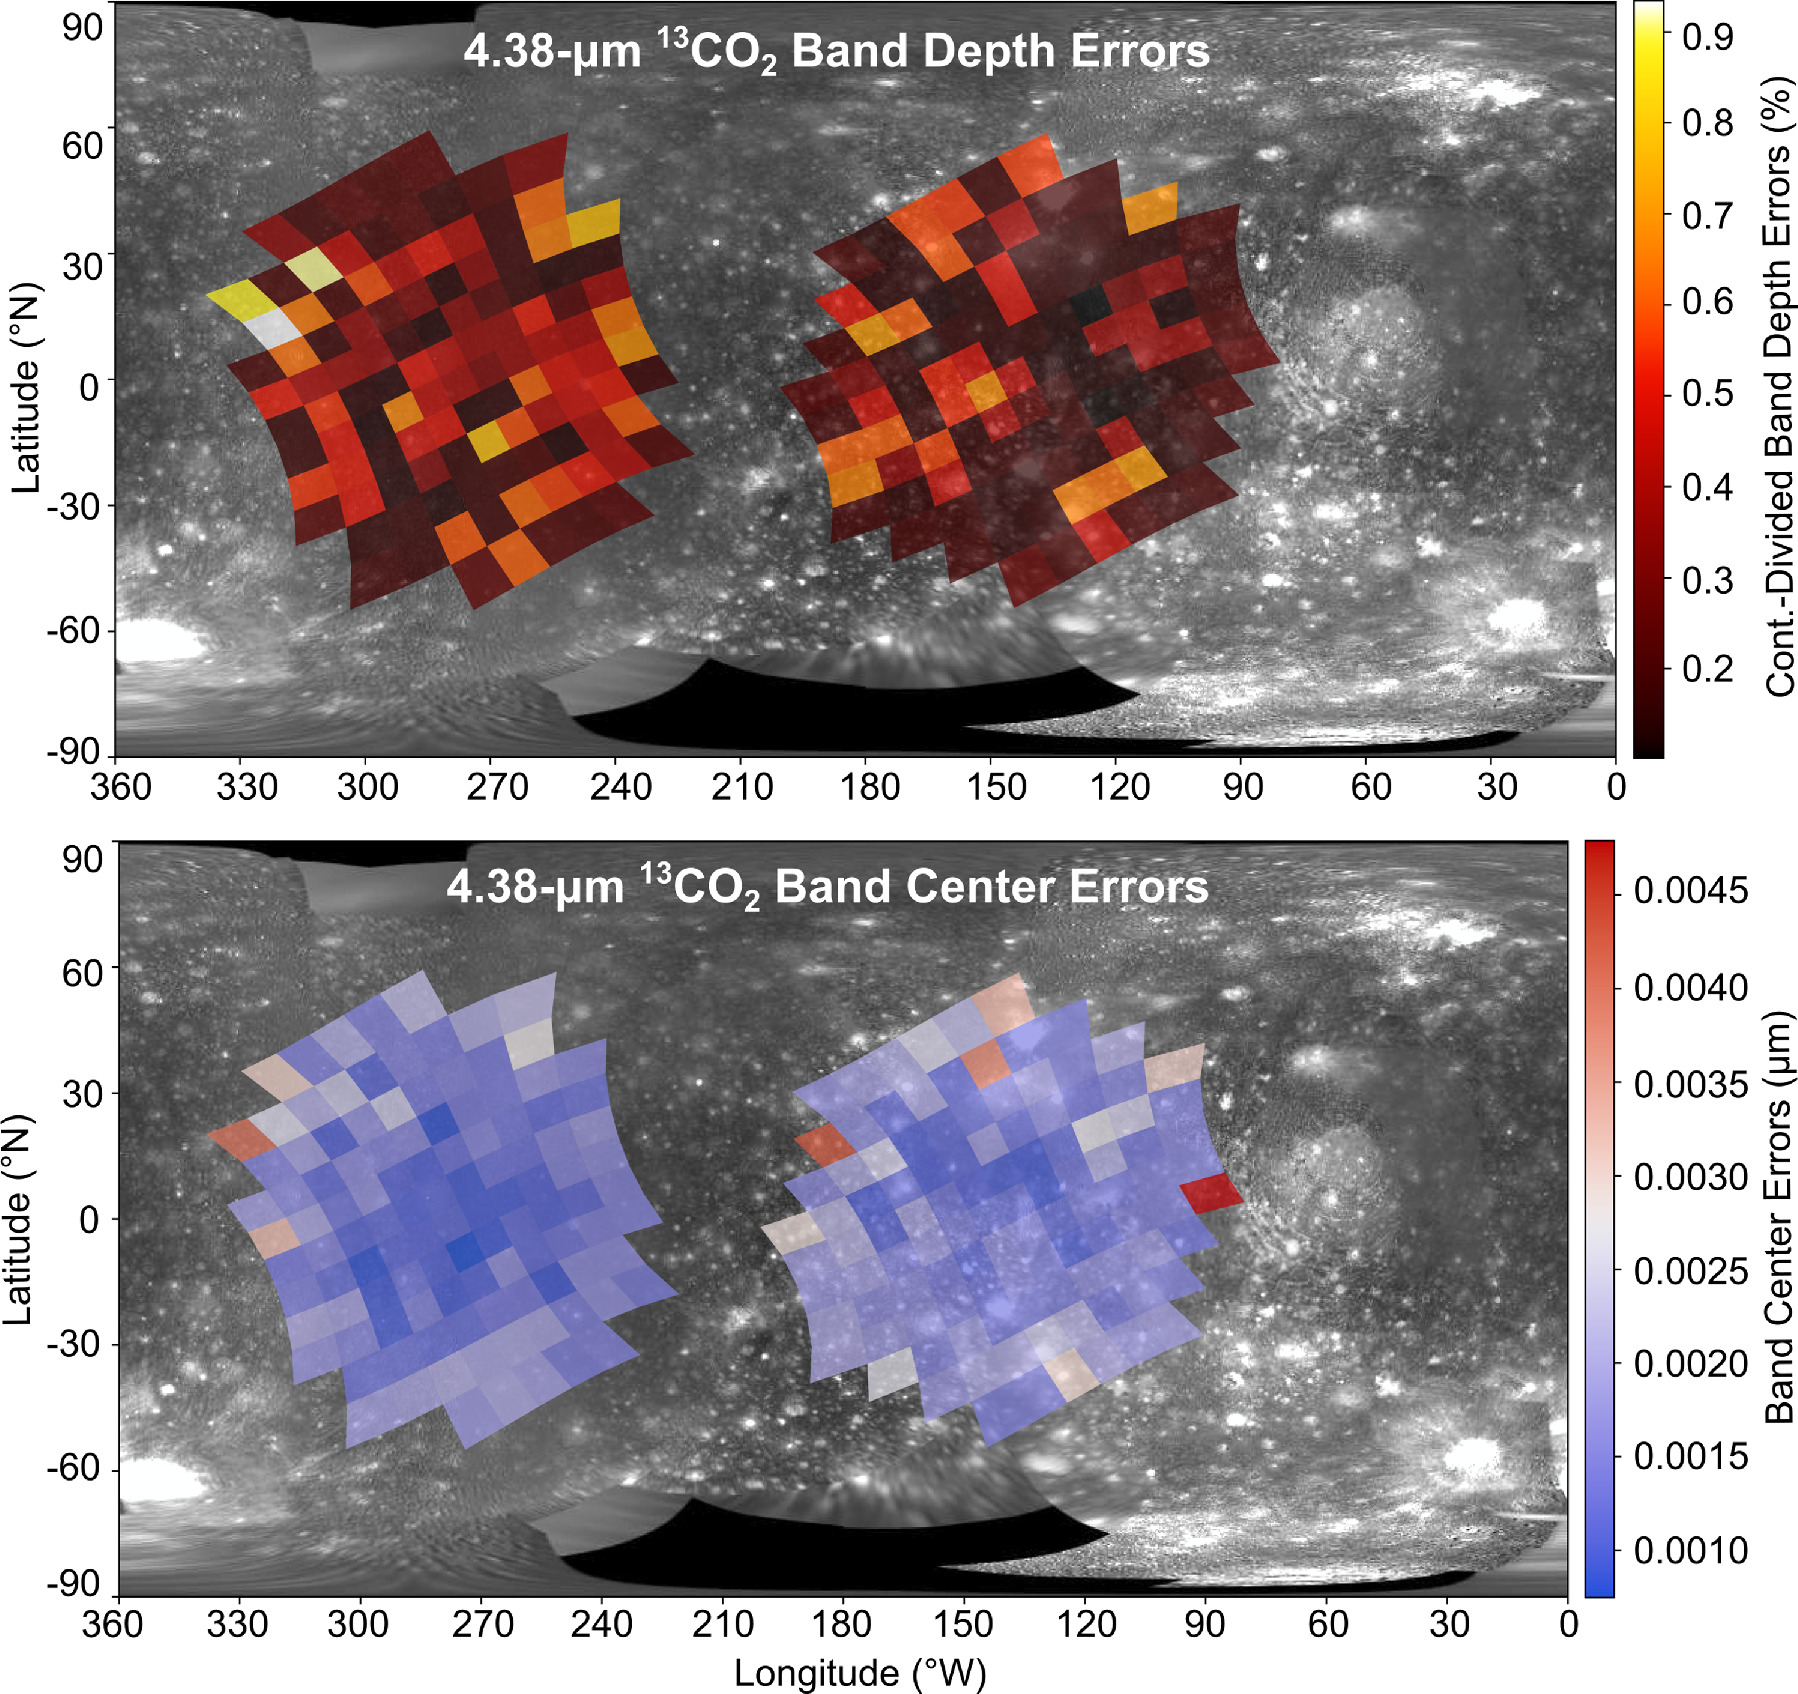
Figure A2. 4.38 _μ_m 13CO2 band depth (top) and band center (bottom) error maps for data shown in Figure 7.
Download figure:
Standard imageHigh-resolution image
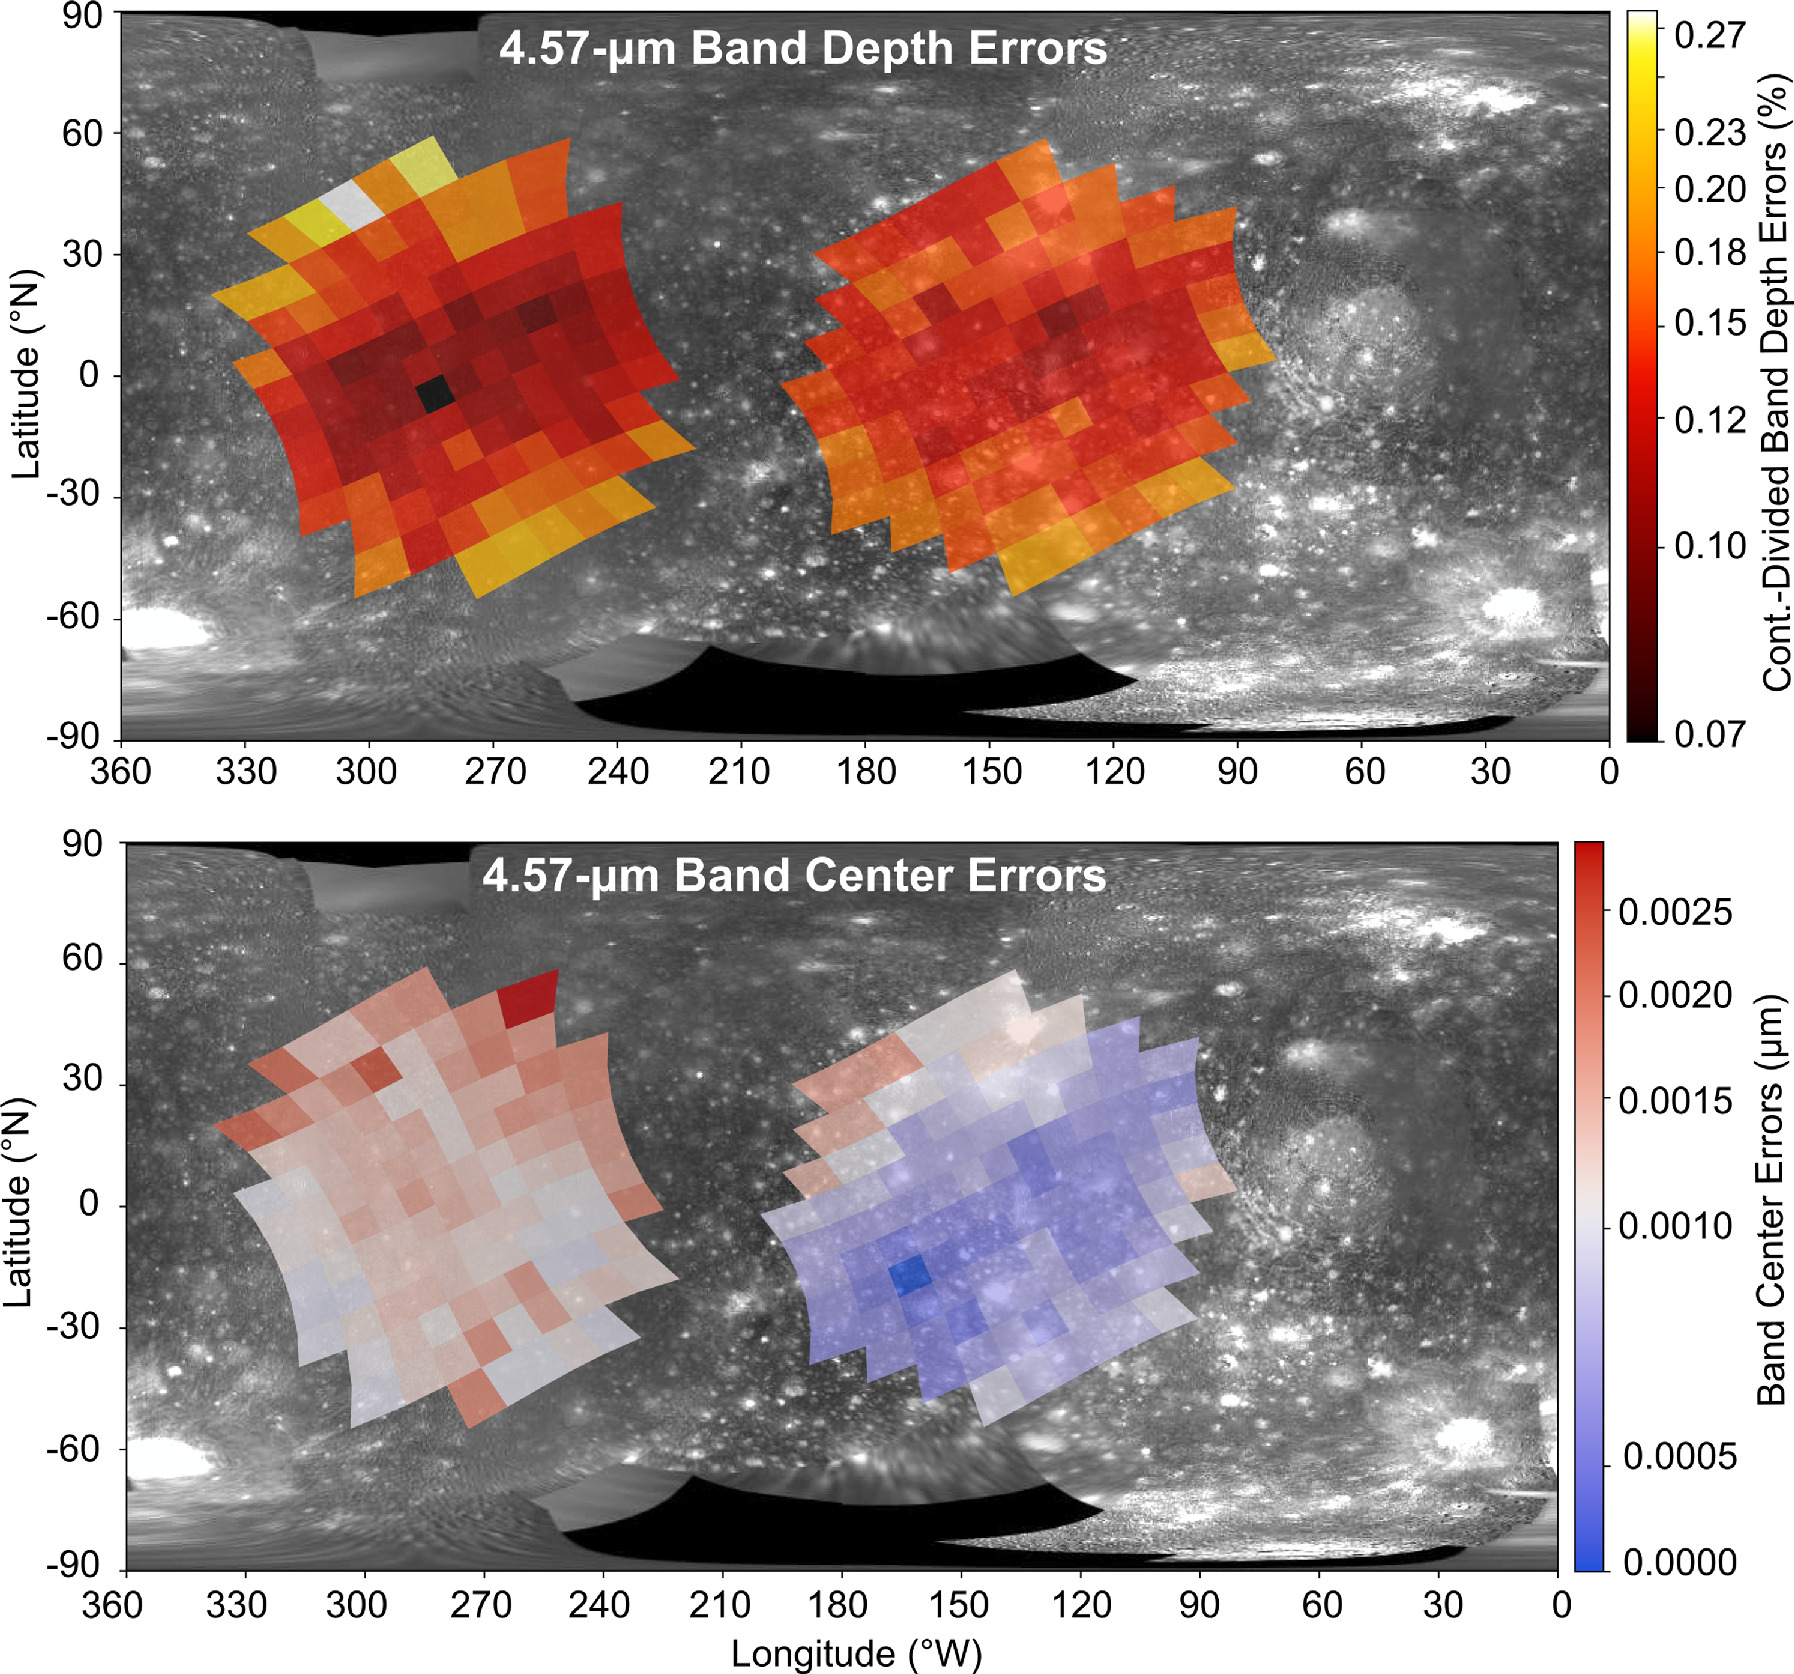
Figure A3. 4.57 _μ_m band depth (top) and band center (bottom) error maps for data shown in Figure 8.
Download figure:
Standard imageHigh-resolution image
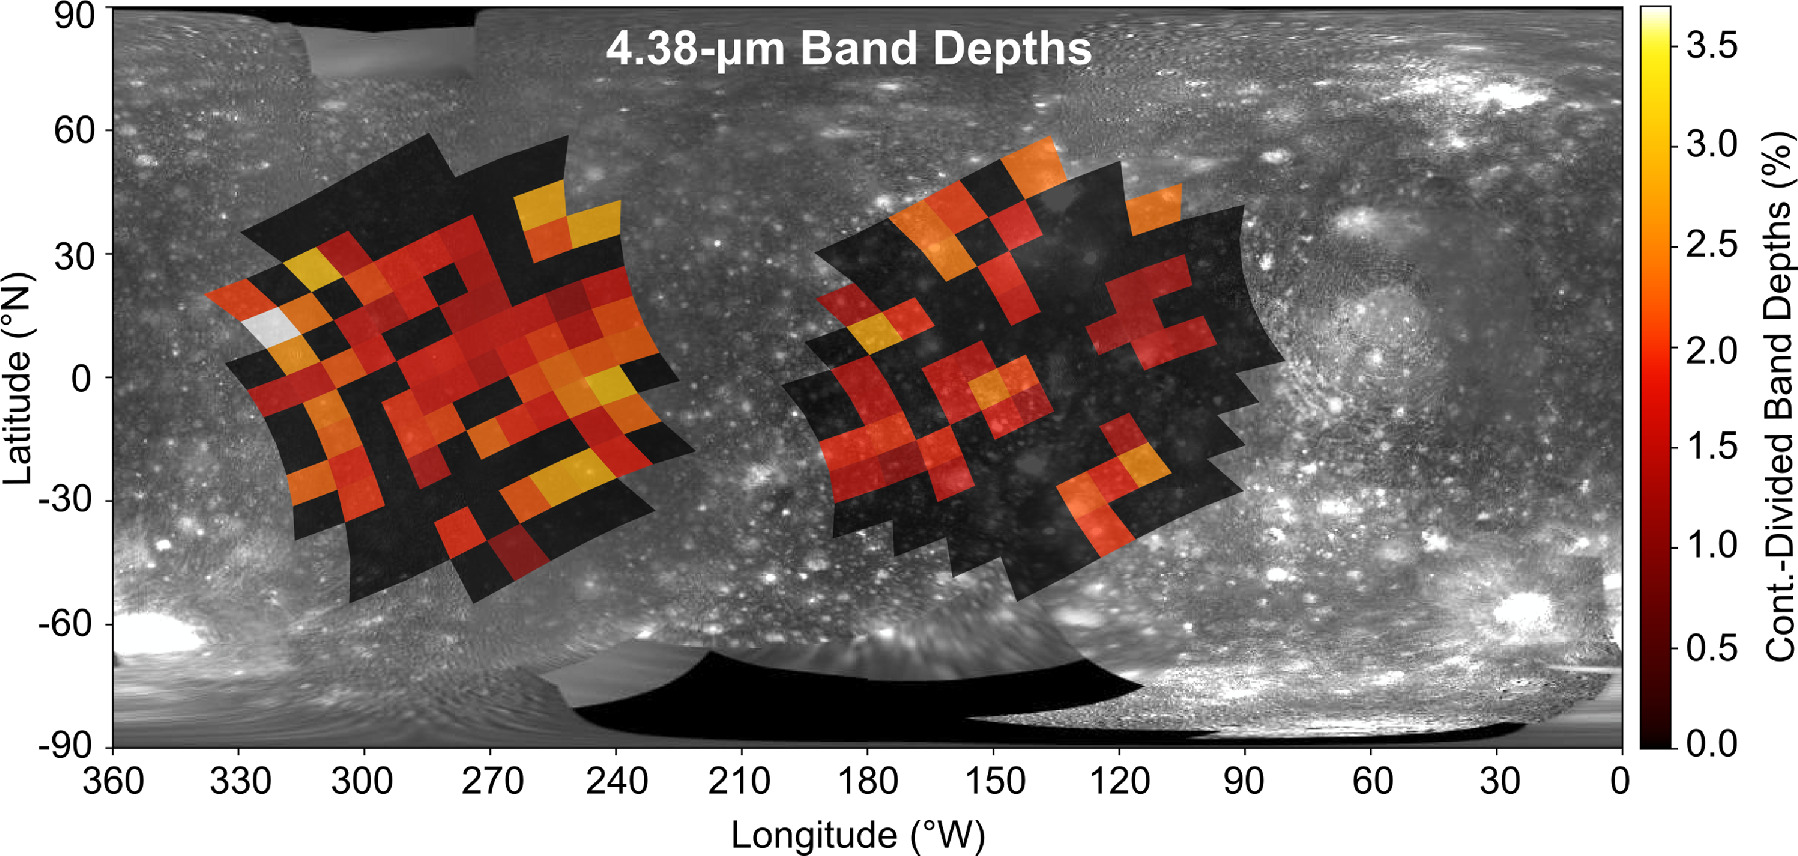
Figure A4. Band depth map for the “peak” component of the 4.38 _μ_m 13CO2 band, highlighting the minor concentration of this component at low latitudes on Callisto's trailing hemisphere. The band center of this feature shows minimal variation, and it is very close to 4.38 _μ_m in all spaxels where it was detected. Some spaxels do not show a peak component (black).
Download figure:
Standard imageHigh-resolution image
To investigate this possibility, we divided the Callisto G395H data by G395H spectra of P330E, a well-characterized spectrophotometric calibration star (G0, Vmag 13.028 ± 0.004, e.g., Bohlin & Landholdt 2015). The resulting disk-integrated spectrum exhibits a weak feature near 4.35 _μ_m that could result from 13CO2 (Figure A5). The P330E-divided data are noisier, and two other absorption features not seen in the solar-model-divided version of the Callisto spectrum appear near 4.43 and 4.85 _μ_m, making the validity of the 4.35 _μ_m feature more difficult to assess.
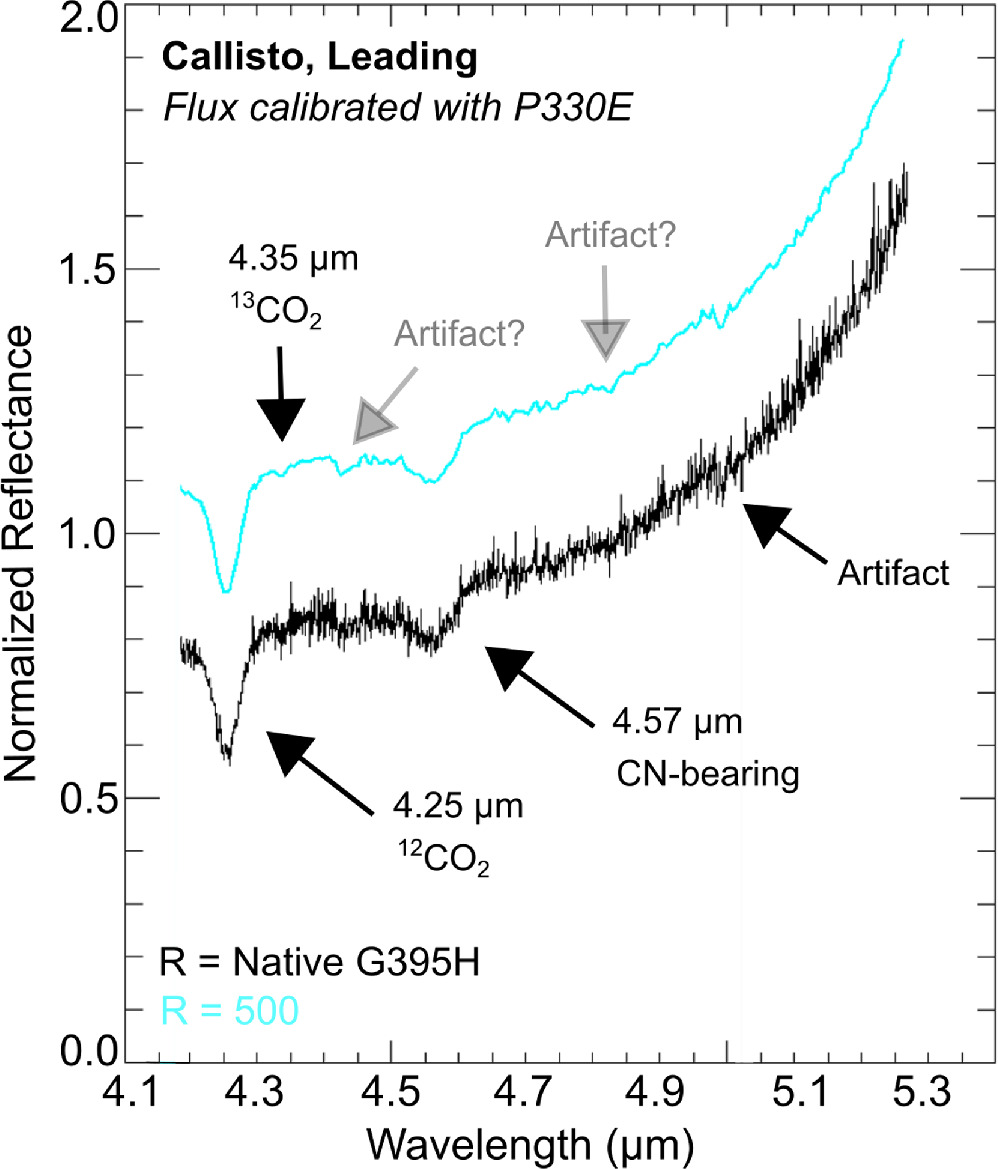
Figure A5. Native resolution integrated G395H (nrs2) spectrum of Callisto (R ∼ 3000 at 4.3 _μ_m, black) and a smoothed version of the same spectrum (R = 500, cyan), both of which were flux calibrated using P330E, with no thermal correction applied. Error bars have been suppressed for clarity. Features that are identified in both the P330E and solar-model-calibrated versions are bolded (see Figure 4 for solar-model-calibrated disk-integrated spectra). Features that are not detected in the solar-model-calibrated spectra are highlighted by question marks. The signal-to-noise is lower in this version likely because P330E (Vmag ∼ 13) is considerably fainter than Callisto (Vmag ∼ 6), making assessment of subtle features more challenging than in the higher-quality versions shown in, e.g., Figure 4.
Download figure:
Standard imageHigh-resolution image
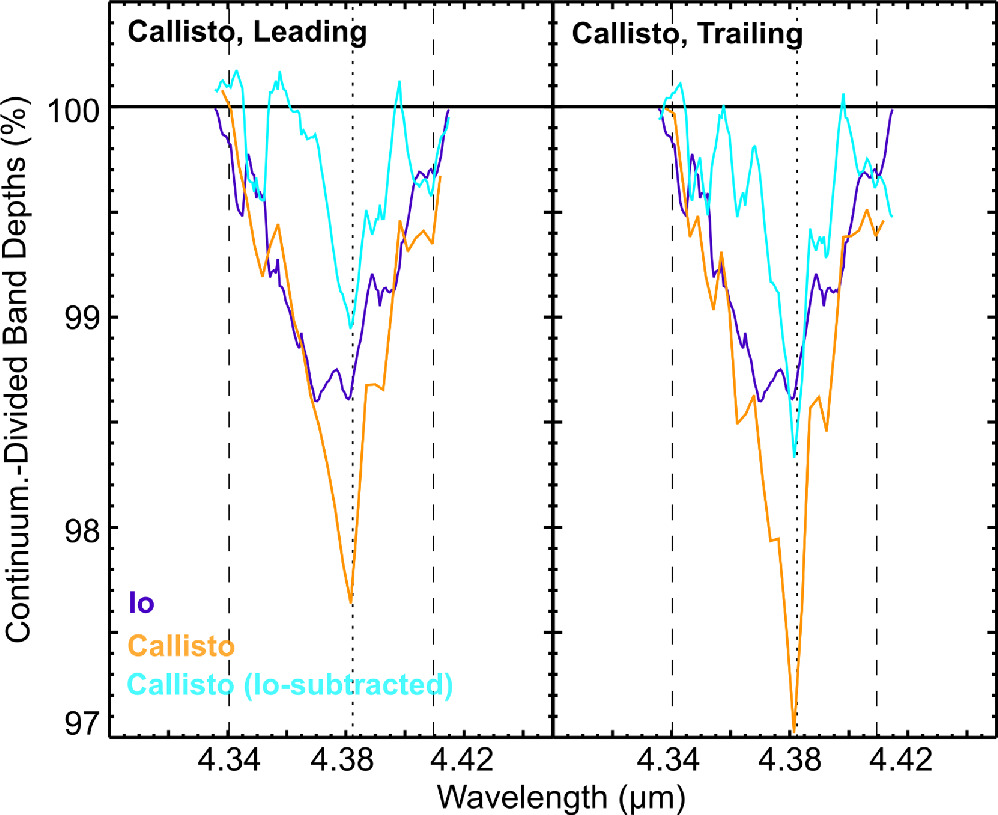
Figure A6. Continuum-divided, integrated G395H spectra of Io (purple) and non-Io-subtracted (orange) and Io-subtracted (cyan) integrated G395H spectra of Callisto. Each continuum-divided spectrum has been binned to an R of 500, and error bars have been suppressed for clarity.
Download figure:
Standard imageHigh-resolution image
NIRSpec G395H data of Europa, which were reduced using a similar solar model to the Callisto data shown in, e.g., Figure 4, also exhibit a 4.38 _μ_m band attributed to 13CO2 (Villanueva et al. 2023a). Europa’s 4.38 _μ_m feature is considerably weaker than the broad feature detected on Ganymede and Callisto (non-Io-subtracted data), but it is comparable to the band strength of the 4.38 _μ_m feature in Callisto’s Io-subtracted data (Figure A6). Furthermore, G395H data of Enceladus, reduced using a similar solar model to the Galilean moons, do not exhibit 12CO2 or 13CO2 features (Villanueva et al. 2023b), indicating that the 4.38 _μ_m band likely requires the additional presence of a 4.25 _μ_m 12CO2 feature, consistent with absorption by 13CO2. Of note, the S/N of the Enceladus data is lower than the Galilean moons, and a weak (≲ 2% band depth) calibration artifact could be present and obscured.
We think the most likely explanation is that Callisto’s 4.38 _μ_m band results from 13CO2 molecules on its surface, as suggested to explain a 4.36 _μ_m band identified in NIMS data (McCord et al. 1998a). It is possible that a calibration artifact is also contributing to Callisto’s 4.38 _μ_m band, artificially enhancing the base component of this feature, thereby increasing its band area (described in Section 4.3). The Io-subtracted spectra still exhibit weak 4.38 μ_m absorption bands (Figure A6), consistent with the presence of subtle 13CO2 features. The resulting 12C/13C ratios (∼50) are within 2_σ of the values calculated for Iapetus, the lower range of most comets, and other icy objects that exhibit terrestrial-like ratios.
Other possibly spurious features. The NIRSpec data also show a narrow absorption feature centered near 4.30 _μ_m that is stronger on Callisto’s trailing side compared to its leading side (Table 1, Figure 4). This narrow band coincides with the wavelength position of the 16O12C18O isotope of CO2 measured in the laboratory that can form in response to an irradiation of H2 18O mixed with carbonaceous material (e.g., Mennella et al. 2004). However, there is a fairly strong solar line that is a very close match in wavelength position and band profile, and perhaps, the weak 4.30 _μ_m feature we have identified is a residual solar feature.
The integrated spectra exhibit several absorption features, between 5 and 5.3 _μ_m, that have not been previously identified, including a prominent feature near 5 _μ_m. Given that the spectral structure beyond 5 _μ_m exhibits a mostly unchanging morphology across Callisto’s disk, its proximity to the long wavelength edge of the G395H detector, and its nondetection in older data sets, we suspect that these features are spurious. The same conclusion was reached for a very similar 5 _μ_m feature that was detected in NIRSpec data of Ganymede, but not in data collected with JWST’s Mid InfraRed Instrument (MIRI, 5–28 _μ_m; Bockelée-Morvan et al. 2024).
Nevertheless, we cannot completely rule out the possibility that some of the structure beyond 5 _μ_m is real, and we briefly describe this possibility here. The prior nondetection of these features is unsurprising given that the sensitivity of NIMS is very low at wavelengths >5 _μ_m, and ground-based data sets are often swamped by atmospheric contamination. If these features are real, the identification of possible species that might be contributing to them is difficult given that laboratory spectra spanning 5–5.3 μ_m typically do not exhibit many diagnostic features for C-, O-, and/or S-bearing species. One possibility is C2O that can exhibit an absorption feature near 5 μ_m in cryogenic irradiation experiments with C-, O-, and S-bearing ices (e.g., Ferrante et al. 2008). Additionally, higher-order hydrocarbons (C_x H_x ) like paraffin can exhibit features in this wavelength range (Clark et al. 2009), which could hypothetically be contributing to dark material on Callisto. We leave deeper investigation of the putative spectral structure between 5 and 5.3 _μ_m and the 4.30 _μ_m band for future work.
Detected in other data sets but absent from integrated NIRSpec data. An absorption feature centered near 3.05 _μ_m has been detected in some ground-based spectra of Callisto and attributed to NH4-bearing compounds (Calvin & Clark 1993). Additionally, some NIMS spectra show subtle features across the 2.8–3.1 _μ_m region, which were attributed to O-H stretching modes in hydrated minerals (summarized in Figure 17.3 in Moore et al. 2004) and perhaps also contribute to the 3.05 _μ_m feature detected in ground-based data. Although we do not detect a 3.05 _μ_m feature in the integrated NIRSpec spectra, some individual spaxels show structure in this wavelength range that hints at the presence of another, non-H2O ice absorber.
Data collected by Galileo’s Ultraviolet Spectrometer (UVS) suggest a minor amount of hydrogen peroxide (H2O2) may be present on Callisto (Hendrix et al. 1999), possibly manifesting as weak, broad features and reddish spectral slopes at wavelengths < 0.4 _μ_m (Johnson & Quickenden 1997). A prominent feature near 3.505 _μ_m is attributed to H2O2 on Europa (e.g., Carlson 1999; Villanueva et al. 2023a) and Ganymede (Trumbo et al. 2023), but this feature was not detected on Callisto in NIMS or ground-based data sets. Thus, we think the subtle 3.51 _μ_m band seen in NIRSpec data of Callisto is best matched by CH-bearing organics (see Section 4.5), as were previously suggested to explain a 3.5 _μ_m feature in NIMS data (McCord et al. 1998a).
NIMS detected a broad feature centered near 3.88 _μ_m, which was attributed to carbonic acid (H2CO3; e.g., Johnson et al. 2004), as well as hydrogen sulfide (H2S; McCord et al. 1997, 1998a). The integrated NIRSpec spectra do not show convincing evidence for a 3.88 _μ_m feature, albeit some individual spaxels show hints of a broad absorption band between 3.85 and 3.9 _μ_m. These results are similar to the ambiguous detection of this feature in ground-based data, where only a narrow and weak 3.88 _μ_m feature was noted, possibly more consistent with a residual telluric band or solar lines than a real feature (Cartwright et al. 2020). One possibility is that the 3.88 _μ_m band detected by NIMS results from constituents that are spatially constrained to localized deposits that do not contribute meaningfully at the spatial scale of JWST or ground-based data sets. Additionally, laboratory experiments demonstrate that continued irradiation of H2CO3, after its formation from H2O ice mixed with CO2, recycles H2CO3 back into its parent molecules, along with solid C (Strazzulla et al. 2023), which might limit the abundance of this molecule on Callisto and the other Galilean moons.
Another prominent band detected by NIMS is centered between 4.02 and 4.05 _μ_m (McCord et al. 1997), which was confirmed by ground-based observations (Calvin & Clark 1993; Cartwright et al. 2020). The 4.02 _μ_m feature has been attributed to a range of species, including SO2 (McCord et al. 1998a), carbonates (Johnson et al. 2004), hydrogen disulfide (H2S2) and/or disulfanide (HS2), and S allotropes (Cartwright et al. 2020). The 4.02 _μ_m band is absent from the integrated NIRSpec spectra because it overlaps the full range of the G395H’s unrecoverable wavelength gap (4–4.2 _μ_m). Nevertheless, the 4.02 _μ_m band is observed in some individual spaxels covering Callisto’s leading (18) and trailing (15) hemisphere, confirming that the feature is present. Comparison of these spaxels demonstrates that the 4.02 _μ_m band is stronger on Callisto’s leading hemisphere compared to its trailing hemisphere (Table 1, Figure 4), consistent with the hemispherical distribution measured with ground-based data (Cartwright et al. 2020). The analyses of individual NIRSpec spaxels that capture the 3.05 _μ_m feature and the 4.02 _μ_m band, and hint at the presence of the 3.88 _μ_m feature, are beyond the scope of this project and left for future work.