Gene length and codon usage bias in Drosophila melanogaster , Saccharomyces cerevisiae and Escherichia coli (original) (raw)
Journal Article
Department of Ecology and Evolutionary Biology, Yale University
,
165 Prospect Street, New Haven, CT 06520-8106, USA
* To whom correspondence should be addressed. Tel: +1 203 432 3886; Fax: +1 203 432 6066; Email: [email protected]
Search for other works by this author on:
Department of Ecology and Evolutionary Biology, Yale University
,
165 Prospect Street, New Haven, CT 06520-8106, USA
Search for other works by this author on:
 PDF
PDF Cite
Etsuko N. Moriyama, Jeffrey R. Powell, Gene length and codon usage bias in Drosophila melanogaster , Saccharomyces cerevisiae and Escherichia coli, Nucleic Acids Research, Volume 26, Issue 13, 1 July 1998, Pages 3188–3193, https://doi.org/10.1093/nar/26.13.3188
Close
Navbar Search Filter Mobile Enter search term Search
Abstract
The relationship between gene length and synonymous codon usage bias was investigated in Drosophila melanogaster , Escherichia coli and Saccharomyces cerevisiae . Simulation studies indicate that the correlations observed in the three organisms are unlikely to be due to sampling errors or any potential bias in the methods used to measure codon usage bias. The correlation was significantly positive in E.coli genes, whereas negative correlations were obtained for D.melanogaster and S.cerevisiae genes. When only ribosomal protein genes were used, whose expression levels are assumed to be similar, E.coli and S.cerevisiae showed significantly positive correlations. For the two eukaryotes, the distribution of effective number of codons was different in short genes (300–500 bp) compared with longer genes; this was not observed in E.coli . Both positive and negative correlations can be explained by translational selection. Energetically costly longer genes have higher codon usage bias to maximize translational efficiency. Selection may also be acting to reduce the size of highly expressed proteins, and the effect is particularly pronounced in eukaryotes. The different relationships between codon usage bias and gene length observed in prokaryotes and eukaryotes may be the consequence of these different types of selection.
Introduction
In unicellular organisms (e.g. Escherichia coli and Saccharomyces cerevisiae ), synonymous codon usage is biased toward a group of ‘major’ codons. This bias is particularly pronounced in highly expressed genes. It has been found that the codon choice in these organisms is constrained by tRNA availability; ‘major’ or ‘preferred’ codons correspond to the most abundant tRNA species (for a review see 1 ). Also, an inverse relationship has been found between synonymous substitution rates and codon usage bias in bacterial genes ( 2 , 3 ). These observations are consistent with stronger selection on highly expressed genes to maximize translational efficiency by use of ‘major’ codons ( 4 , but for conflicting results see 5 ). In lowly expressed genes, on the other hand, variation in mutation bias, probably due to differential DNA repair, seems to play a role in determining codon usage ( 6 ).
A negative correlation between codon usage bias and synonymous substitution rates has also been found in Drosophila nuclear genes ( 7–9 ). Similar to the case in unicellular organisms, relative tRNA abundance seems to have a relationship with synonymous codon preference in Drosophila genes ( 10 , 11 ). Furthermore, selection acting on Drosophila synonymous codons has been confirmed by population genetics studies ( 12–14 ).
Recently, two studies described relationships between codon usage bias and gene length related to translational selection. Eyre-Walker ( 15 ) found a positive correlation in E.coli genes expressed at approximately similar levels. He argued that due to a greater cost of producing longer genes, selection in favor of codons which increase translational accuracy should be greater for those genes. On the other hand, Akashi ( 16 ) described that when gene lengths were different between homologs in Drosophila melanogaster and Drosophila simulans , the homologs in the former species were longer and less biased than those of the latter species, although the sample size was only six genes and the difference was very small. Relatively reduced selection intensity in D.melanogaster seems to be responsible for such a difference, probably related to a smaller effective population size relative to D.simulans . Energetically costly insertion mutations may have accumulated more in D.melanogaster .
In Moriyama and Powell ( 10 ), we examined codon usage bias of D.melanogaster genes. From a sample of >1000 genes, we observed that the average length of the ∼10% most highly biased genes was 888 bp, while the ∼10% lowest biased genes averaged 2392 bp. This is consistent with observations made by Akashi ( 16 ). In this paper, we investigate in more detail the relationship between codon usage bias and gene length in D.melanogaster , comparing it with E.coli and S.cerevisiae .
Materials and Methods
Sequence data
Sequence data for D.melanogaster were described in Moriyama and Powell ( 10 ). Complete coding sequences 300 bp in length or longer were available for 1001 D.melanogaster genes. The complete sequence of the E.coli genome (strain K-12) is available from GenBank (accession no. U00096), which includes 2463 genes of 300 bp or longer, excluding unidentified ORFs and overlapping sequences. The complete nuclear genome of S.cerevisiae (strain S288C), which is composed of 16 chromosomes, is available by anonymous ftp: genome-ftp.stanford.edu (directory /yeast/genome_seq ). The database includes 2169 identified genes of 300 bp or longer. We used only full-length coding sequences in our analyses.
Simulations
Because sampling errors are affected by sample size (gene length), simulation studies were conducted to examine the behavior of various codon bias measures. We followed the method developed by Wright ( 17 ). For a given ‘true’ effective number of codons (ENC), ‘true’ synonymous codon frequencies were estimated for each amino acid. We assumed that one codon is preferred for each amino acid and all other synonymous codons are unpreferred equally. The amino acid composition was held constant; we used the amino acid compositions obtained from D.melanogaster , E.coli and S.cerevisiae genes. For a given ‘true’ ENC, 100 sequences were generated for each of 19 size classes: 70, 100, 150, 180, 240, 300, 360, 410, 440, 500, 560, 620, 660, 800, 1000, 1300, 1600, 2600 and 3600 codons. In addition to ENC, other codon bias measures, scaled χ 2 (χ 2 / L ; 7 ) and codon adaptation index (CAI; 18 ), were estimated for each generated sequence. One difference in our simulation from Wright's ( 17 ) is that the ‘observed’ ENC was not allowed to be >61. As was done for the actual sequence data, ENC >61 were corrected to 61. While ENC ranges from 61 (no bias) to 20 (the highest bias), CAI and χ 2 / L range from 0 to 1.0 or larger.
All of the statistical analyses were performed using the StatView v.4.51 statistical package (Abacus Concepts Inc.).
Results
Simulation studies
The results of simulation studies are summarized in Table 1 . With a given ‘true’ ENC and with a given amino acid composition, 1900 sequences were generated in total. The ‘true’ ENC values, 50 and 41, were chosen based on the observed values from long genes (≥4 kb) in D.melanogaster and E.coli . One hundred sequences were generated for each of 19 given lengths (see Materials and Methods). These sequences were grouped arbitrarily into five length categories. Analysis of variance (ANOVA) was conducted among these groups. Correlation coefficients ( r and Spearman's r ) were calculated between codon usage bias and length of the 1900 sequences. It is clear that χ 2 / L is affected significantly by sequence length ( Table 1 ), as also noted by Wright ( 17 ). ENC and CAI are quite insensitive to length. Very similar results were obtained when the amino acid composition of S.cerevisiae genes was used to generate sequences. We also obtained similar results for sequences generated with other ENC values (25, 35, 45, 55 and 60; data not shown).

Table 1
Simulation study for sequence length and codon usage bias

Table 2
Simulation study for short sequences and codon usage bias
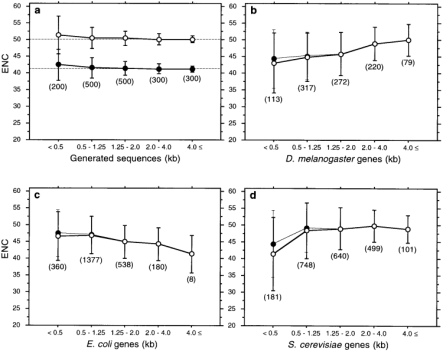
Figure 1
Relationships between codon usage bias (ENC) and gene length (kb) in generated sequences ( a ), D.melanogaster ( b ), E.coli ( c ) and S.cerevisiae ( d ). The means and standard deviations of ENC are plotted for five length categories. The number of genes included in each category is shown in parentheses. For simulation results (a), open circles are from sequences generated with a ‘true’ ENC = 50 and the amino acid composition of D.melanogaster and closed circles with a ‘true’ ENC = 41 and the amino acid composition of E.coli . Dashed lines indicate the ‘true’ ENC's. For the three organisms (b-d), closed circles and fine lines denote the means and standard deviations of ENC excluding ribosomal protein genes. The numbers of ribosomal protein genes excluded are 25 (b), 35 (c) and 63 (d). Correlation coefficients ( r ) for the three organisms are given in Table 3 . For the simulation studies (a), r = −0.08 ( P = 0.001) and −0.09 ( P < 0.001) for the ‘true’ ENC = 50 (open circles) and 41 (closed circles) respectively. For both cases, CAI does not have significant correlation (| _r_ | < 0.03, _P_ > 0.2).
We further examined the influence of short length on ENC and CAI. In Table 2 , each group consists of 100 sequences with a given length. CAI appears to be least affected by short sequence length. ENC fluctuates from giving an overestimate to an underestimate of codon usage bias when sequences are shorter than 500 bp, particularly shorter than 300 bp.
Gene length and codon usage bias in D.melanogaster , E.coli and S.cerevisiae
Based on the results of the simulations, we analyzed only genes of 300 bp or longer and used ENC and CAI as codon bias measures. Results for D.melanogaster , E.coli and S.cerevisiae genes are summarized in Figure 1 and Table 3 . Figure 2 shows the actual data plotted for the three species. Both ENC and CAI show highly significant heterogeneity and correlations with gene length. Such heterogeneity and correlations do not appear to be due to sampling errors or any potential bias in codon usage measures. Simulation studies show that only when sequences are short (between 300 and 500 bp in length) does ENC tend to underestimate codon bias slightly ( Fig. 1a and Table 2 ). CAI does not show such false heterogeneity and correlations even when sequences are very short. Significant heterogeneity and correlations for both ENC and CAI in the three organisms remains when genes <500 bp are excluded ( Table 3 ). Even when we further exclude genes longer than 4000 bp (sample sizes of such long genes tend to be small, particularly for E.coli ) as well as shorter than 500 bp, the results are virtually unchanged (data not shown). The results were also confirmed by a non-parametric Kruskal-Wallis test.
Each of the three organisms examined shows very distinct correlations between codon usage bias and gene length. In accordance with Akashi ( 16 ), codon usage bias in D.melanogaster genes correlates negatively with length (represented as a positive correlation with ENC). Highly biased genes in S.cerevisiae are also shorter than the weakly biased genes. On the other hand, E.coli genes show a positive correlation between codon usage bias and length (a negative correlation with ENC), which supports the findings of Eyre-Walker ( 15 ). Bacterial genes are generally shorter than eukaryotic genes. The average lengths of coding sequences in our data sets are 1068 bp (ranging up to 4617 bp) for E.coli , 1677 bp (up to 12 279 bp) for S.cerevisiae and 1830 bp (up to 15 444 bp) for D.melanogaster . However, this difference does not seem to contribute to the different correlations seen in these three organisms. As mentioned above, when we used only genes between 500 and 4000 bp in length the patterns of correlation remained similar.
Our data sets include 25 (for D.melanogaster ), 35 (for E.coli ) and 63 (for S.cerevisiae ) ribosomal protein genes. All of them are shorter than 900 bp except for one D.melanogaster gene (1224 bp) and one E.coli gene (1674 bp). Ribosomal protein genes are known to have very high levels of expression and high codon usage bias. The average ENC values of ribosomal protein genes in the three organisms are 35.0 ( D.melanogaster ), 35.3 ( E.coli ) and 28.8 ( S.cerevisiae ). When these ribosomal protein genes are excluded, the patterns of correlation do not change (closed circles in Fig. 1b–d ).
We also tried to exclude those which share high sequence similarity (95% or more at the amino acid level) with one or more other genes (presumed duplications), since these genes may have similar length and codon usage bias simply because of their shared evolutionary history. Less than 7% of our data showed such high sequence similarity: 67 D.melanogaster , 97 S.cerevisiae and 28 E.coli genes. Exclusion/inclusion of these sequences did not affect our results (data not shown).
Gene length and codon usage bias among ribosomal genes
Eyre-Walker ( 15 ) showed positive correlations between codon usage bias (CAI) and length of E.coli genes by taking advantage of the equimolar presence of ribosomal proteins and also of other multimeric proteins whose gene expression levels are likely similar. We confirmed his results for the 35 ribosomal protein genes in our E.coli data set using both CAI and ENC, although we did not exclude the start and end regions of the genes as he did (in such regions, conflicting selection pressure may be acting, as described later). Codon usage bias of the 63 ribosomal protein genes of S.cerevisiae also has a significant positive correlation with length ( r = −0.29, P < 0.02 for ENC; _r_ = 0.34, _P_ < 0.01 for CAI). The correlation in the 25 ribosomal protein genes of _D.melanogaster_ is also positive, though not significant ( _r_ = −0.13, _P_ > 0.5 for ENC; r = 0.18, P > 0.3 for CAI). This may be simply due to the relatively small sample size of this data set.

Table 3
Relationships between gene length and codon usage bias for three organisms
Discussion
The results from ribosomal protein genes are consistent with the translational accuracy model, which is expressed as S ≈ nE , where S is the strength of selection on synonymous codon usage, n is the number of codons and E is the expression level of the protein ( 15 ). Synonymous codon usage bias thus depends on the gene length as much as on the expression level. If we assume similar expression levels among these ribosomal protein genes, selective constraints to maximize translational efficiency are stronger in energetically costly longer genes, at least in yeast and E.coli . We should, however, note that some of the eukaryotic ribosomal protein genes have multiple copies and also expression levels may not be the same among them.
The translational accuracy model does not seem to be sufficient to describe the relationships observed in the entire data sets of Drosophila and yeast genes; genes with weaker codon usage bias (these genes are assumed to be weakly constrained) appear to be longer than those with stronger codon usage bias. Selection may also be acting on the size of proteins. Because large proteins are energetically expensive to make, such proteins are disadvantageous if shorter proteins can perform similar functions. Therefore, protein lengths are reduced by selective constraints, while longer proteins are allowed where selective constraints are sufficiently weak. Selective constraints on length seem to be acting differently at the translational and at the transcriptional levels. Drosophila melanogaster has longer coding sequences than D.simulans , whereas there is no difference in length of the introns ( 16 ). No consistent difference was found in the length of coding sequences and introns among D.melanogaster , Drosophila virilis and Drosophila pseudoobscura , with one exception, the length of very short introns between D.melanogaster and D.pseudoobscura ( 19 ).
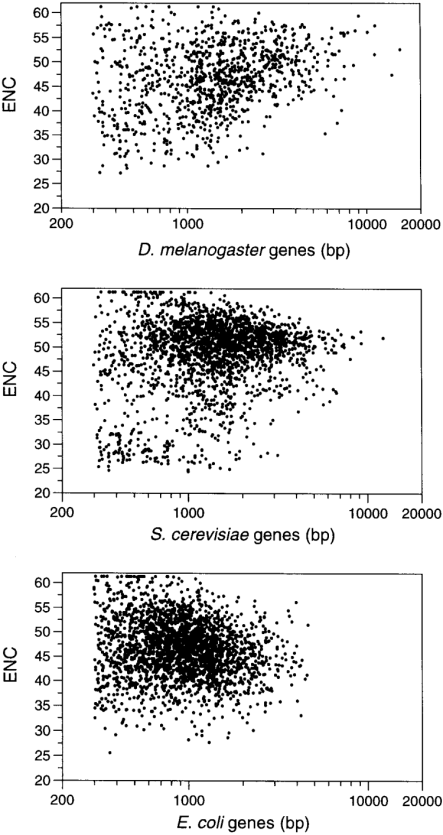
Figure 2
Plot of relationship of individual gene length (bp, log scale) and codon usage bias (ENC) for D.melanogaster , S.cerevisiae and E.coli .
A complication arises because under the translational accuracy model, as described above, the strength of selection is proportional to the product of expression level and gene length. If selection is, on the other hand, acting to reduce gene length, how is it possible to see such clear negative correlation in Drosophila and yeast genes between codon usage bias and gene length, but a positive correlation in E.coli genes? We may have to consider two different sources of selection during translation: accuracy and simple length-dependent energy consumption. In the accuracy model, longer genes need to have stronger constraints on codon usage. From the aspect of energy consumption, longer genes are disadvantageous, especially for highly expressed genes. Quantitative data on gene expression levels are not readily available for eukaryotic genes. However, Eyre-Walker ( 15 ) compiled data on protein concentration for 46 E.coli genes. Codon usage bias is highly significantly and positively correlated with the protein concentration, as expected ( P < 0.0001 for both ENC and CAI). On the other hand, gene length shows a significantly negative correlation with protein concentration (A.Eyre-Walker, personal communication). In E.coli , this correlation does not seem to be sufficient to offset the positive correlation generated by the constraint for translational accuracy.
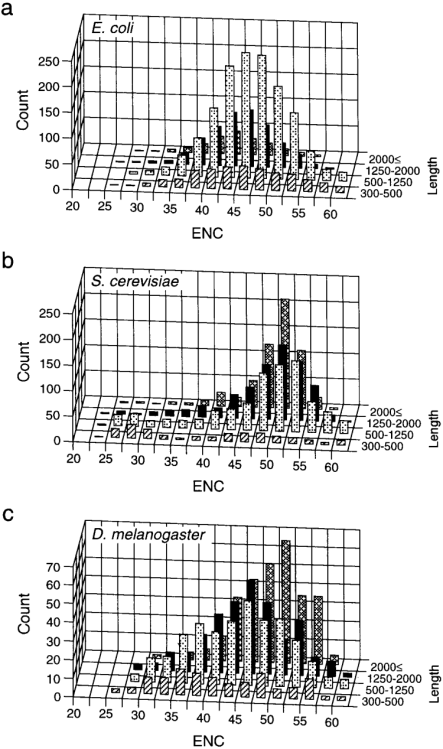
Figure 3
Distribution of ENC for each length category of E.coli ( a ), S.cerevisiae ( b ) and D.melanogaster ( c ) genes. Only complete genes 300 bp or longer were included.
It is also possible that highly biased genes simply have shorter lengths than weakly biased genes for other functional reasons common to these genes or just by chance. In Figure 3 , the distribution of ENC is compared among four length groups (genes with 2000 bp or longer were lumped in one group because of the small sample size for E.coli ). For D.melanogaster and S.cerevisiae , the distribution of ENC in short genes appears to be different from that in long genes. Genes between 300 and 500 bp in length have a bimodal (for S.cerevisiae ) or nearly flat distribution of ENC. The G test for goodness of fit (with William's correction) showed that ENC of these short genes is homogeneous; genes of each length group were grouped into three subgroups with an equal range of ENC and tested to see if the numbers of genes were significantly heterogeneous among the three subgroups ( _G_adj = 3.30 and 3.33 for ‘300–500 bp’ genes in D.melanogaster and S.cerevisiae respectively, P > 0.1 for both). However, a difference in codon bias distribution between short and long genes was not observed in E.coli genes.
Although the mechanisms determining synonymous codon usage appear to be similar in E.coli , S.cerevisiae and Drosophila (see Introduction), the pattern of codon usage bias within a gene could be different among them (or possibly between prokaryotic and eukaryotic genomes). In E.coli , codon usage bias is weaker at both the start and end of the genes and conflicting selection pressures, probably due to ribosome binding, have been suggested ( 20–22 ). This was attributed to the close proximity of adjacent genes in E.coli . However, only very weak or no intragenic differences in codon usage bias have been detected in yeast genes ( 22 ). A recent study for D.melanogaster genes by Kliman and Eyre-Walker ( 23 ) showed that G+C% at the third codon position is lower in the start region than the remaining part of the genes. This trend is more pronounced in genes with no introns. Further examination on large data sets may be required. Considering, however, that eukaryotic genes have large intergenic regions and are segmented by introns, it seems that conflicting selection pressure at the start and end regions is not as effective in all eukaryotic genes as in E.coli genes. On the other hand, Akashi ( 12 ) found that codon bias varies among synonymous sites when comparing conserved and non-conserved amino acid positions among Drosophila species. Since conserved amino acids showed higher codon bias than non-conserved amino acids, selection for translational accuracy was postulated as a cause of codon bias. Although Hartl et al . ( 24 ) found no such evidence in E.coli genes, the positive correlation found between codon usage bias and gene length in E.coli , particularly among the genes expressed approximately equally, appears to be due to selection to avoid missense errors during translation (described in 15 ). We also found positive correlations when we used only ribosomal protein genes in the yeast and in D.melanogaster , although the correlation was not significant in the latter species.
Therefore, selective constraints on codon usage bias appear to be stronger in energetically costly longer genes to ensure efficient translation by minimizing misincorporation and maximizing translational accuracy. Selection also constrains gene length to reduce the expense of translation. Gene length is likely to be maximally optimized in the compact genome of E.coli , while in larger eukaryotic genomes there appears to be room for such selection to act. What we observed in the three organisms is probably the consequence of these different types of selective constraints. Further detailed analyses on other genomes are evidently necessary. Depending on the intensity of the selection constraints, it may also be possible to see no correlation between gene length and codon usage bias in other eukaryotic genomes. It will be of great interest to see if the contrasted correlations between prokaryotes and eukaryotes can be seen in other organisms.
Acknowledgements
We thank P.M.Sharp for his comments on an early version of the manuscript and D.L.Hartl for helpful discussions. Adam Eyre-Walker and anonymous reviewers gave us many critical comments which improved the manuscript significantly. This work was supported by NSF grant DEB 9318836 to J.R.P.
References
1
. , , . ,
Transfer RNA in Protein Synthesis
,
1992
Boca Raton, FL
CRC Press
(pg.
87
-
111
)
2
, . ,
Mol. Biol. Evol.
,
1987
, vol.
4
(pg.
222
-
230
)
3
. ,
J. Mol. Evol.
,
1991
, vol.
33
(pg.
23
-
33
)
4
. ,
Genetics
,
1991
, vol.
129
(pg.
897
-
907
)
5
, . ,
Genetics
,
1995
, vol.
140
(pg.
1407
-
1412
)
6
, . ,
Nucleic Acids Res.
,
1995
, vol.
23
(pg.
1350
-
1353
)
7
, , , . ,
Mol. Biol. Evol.
,
1988
, vol.
5
(pg.
704
-
716
)
8
, . ,
J. Mol. Evol.
,
1989
, vol.
28
(pg.
398
-
402
)
9
, . ,
Proc. Natl. Acad. Sci. USA
,
1997
, vol.
94
(pg.
7784
-
7790
)
10
, . ,
J. Mol. Evol.
,
1997
, vol.
45
(pg.
514
-
523
)
11
, . . ,
An Atlas of Drosophila Genes: Sequences and Molecular Features
,
1993
New York, NY
Oxford University Press
(pg.
378
-
397
)
12
. ,
Genetics
,
1994
, vol.
136
(pg.
927
-
935
)
13
. ,
Genetics
,
1995
, vol.
139
(pg.
1067
-
1076
)
14
, . ,
Mol. Biol. Evol.
,
1993
, vol.
10
(pg.
1239
-
1258
)
15
. ,
Mol. Biol. Evol.
,
1996
, vol.
13
(pg.
864
-
672
)
16
. ,
Genetics
,
1996
, vol.
144
(pg.
1297
-
1307
)
17
. ,
Gene
,
1990
, vol.
87
(pg.
23
-
29
)
18
, . ,
Nucleic Acids Res.
,
1987
, vol.
15
(pg.
1281
-
1295
)
19
, , . ,
Mol. Biol. Evol.
,
1998
, vol.
15
(pg.
770
-
773
)
20
, . ,
Nucleic Acids Res.
,
1993
, vol.
21
(pg.
4599
-
4603
)
21
. ,
J. Mol. Evol.
,
1996
, vol.
42
(pg.
73
-
78
)
22
. ,
J. Theor. Biol.
,
1988
, vol.
133
(pg.
67
-
71
)
23
, . ,
J. Mol. Evol.
,
1998
, vol.
46
(pg.
534
-
541
)
24
, , . ,
Genetics
,
1994
, vol.
138
(pg.
227
-
234
)
© 1998 Oxford University Press
I agree to the terms and conditions. You must accept the terms and conditions.
Submit a comment
Name
Affiliations
Comment title
Comment
You have entered an invalid code
Thank you for submitting a comment on this article. Your comment will be reviewed and published at the journal's discretion. Please check for further notifications by email.