1950 United States census (original) (raw)
From Wikipedia, the free encyclopedia
17th US national census
| Seventeenth censusof the United States | |
|---|---|
| ← 1940 April 1, 1950 1960 → | |
 U.S. Census Bureau seal U.S. Census Bureau seal |
|
 1950 U.S. census logo 1950 U.S. census logo |
|
| General information | |
| Country | United States |
| Results | |
| Total population | 151,325,798 ( 14.5%) 14.5%) |
| Most populous state | New York15,830,192 |
| Least populous state | Nevada160,083 |
The 1950 United States census, conducted by the Census Bureau, determined the resident population of the United States to be 151,325,798, an increase of 14.5 percent over the 131,669,275 persons enumerated during the 1940 census.[1]
This was the first census in which:
- More than one state recorded a population of over 10 million
- Every state and territory recorded a population of over 100,000
- All 100 largest cities recorded populations of over 100,000
On April 1, 2022, the National Archives and Records Administration released scanned census enumeration sheets to the general public, in accordance with the 72 year rule.[2]
The 1950 census collected the following information from all respondents:[3]
- address
- whether house is on a farm
- name
- relationship to head of household
- race
- sex
- age
- marital status
- birthplace
- if foreign born, whether naturalized
- employment status
- hours worked in week
- occupation, industry and class of worker
In addition, a sample of individuals were asked additional questions covering income, marital history, fertility, and other topics. Full documentation on the 1950 census, including census forms and a procedural history, is available from the Integrated Public Use Microdata Series.
A clerk creating punch cards containing data from the census.
Microdata from the 1950 census are freely available through the Integrated Public Use Microdata Series. Aggregate data for small areas, together with electronic boundary files, can be downloaded from the National Historical Geographic Information System. All identifiable information in the census became available in April 2022 upon the release of the images taken by the National Archives and Records Administration.[4]
On April 1, 2022, 72 years after the census was taken, the National Archives and Records Administration released scanned census enumeration sheets to the general public.[2] The census data was also made freely searchable by name on other websites.[5] Genealogy companies Ancestry and FamilySearch partnered to use AI and human volunteers to review an index of all names listed on the 1950 census forms.
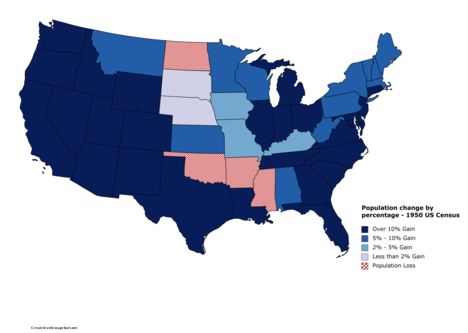
A map showing the population change of each US State by percentage.
| Rank | State | Population as of1950 census | Population as of1940 census | Change | Percentchange |
|---|---|---|---|---|---|
| 1 |  New York New York |
14,830,192 | 13,479,142 | 1,351,050  |
10.0%  |
| 2 |  California California |
10,586,223 | 6,907,387 | 3,678,836  |
53.3%  |
| 3 |  Pennsylvania Pennsylvania |
10,498,012 | 9,900,180 | 597,832  |
6.0%  |
| 4 |  Illinois Illinois |
8,712,176 | 7,897,241 | 814,935  |
10.3%  |
| 5 |  Ohio Ohio |
7,946,627 | 6,907,612 | 1,039,015  |
15.0%  |
| 6 |  Texas Texas |
7,711,194 | 6,414,824 | 1,296,370  |
20.2%  |
| 7 |  Michigan Michigan |
6,371,766 | 5,256,106 | 1,115,660  |
21.2%  |
| 8 |  New Jersey New Jersey |
4,835,329 | 4,160,165 | 675,164  |
16.2%  |
| 9 |  Massachusetts Massachusetts |
4,690,514 | 4,316,721 | 373,793  |
8.7%  |
| 10 |  North Carolina North Carolina |
4,061,929 | 3,571,623 | 490,306  |
13.7%  |
| 11 |  Missouri Missouri |
3,954,653 | 3,784,664 | 169,989  |
4.5%  |
| 12 |  Indiana Indiana |
3,934,224 | 3,427,796 | 506,428  |
14.8%  |
| 13 |  Georgia Georgia |
3,444,578 | 3,123,723 | 320,855  |
10.3%  |
| 14 |  Wisconsin Wisconsin |
3,434,575 | 3,137,587 | 296,988  |
9.5%  |
| 15 |  Virginia Virginia |
3,318,680 | 2,677,773 | 640,907  |
23.9%  |
| 16 |  Tennessee Tennessee |
3,291,718 | 2,915,841 | 375,877  |
12.9%  |
| 17 |  Alabama Alabama |
3,061,743 | 2,832,961 | 228,782  |
8.1%  |
| 18 |  Minnesota Minnesota |
2,982,483 | 2,792,300 | 190,183  |
6.8%  |
| 19 |  Kentucky Kentucky |
2,944,806 | 2,845,627 | 99,179  |
3.5%  |
| 20 |  Florida Florida |
2,771,305 | 1,897,414 | 873,891  |
46.1%  |
| 21 |  Louisiana Louisiana |
2,683,516 | 2,363,516 | 320,000  |
13.5%  |
| 22 |  Iowa Iowa |
2,621,073 | 2,538,268 | 82,805  |
3.3%  |
| 23 |  Washington Washington |
2,378,963 | 1,736,191 | 642,772  |
37.0%  |
| 24 |  Maryland Maryland |
2,343,001 | 1,821,244 | 521,757  |
28.6%  |
| 25 |  Oklahoma Oklahoma |
2,233,351 | 2,336,434 | −103,083  |
−4.4%  |
| 26 |  Mississippi Mississippi |
2,178,914 | 2,183,796 | −4,882  |
−0.2%  |
| 27 |  South Carolina South Carolina |
2,117,027 | 1,899,804 | 217,223  |
11.4%  |
| 28 |  Connecticut Connecticut |
2,007,280 | 1,709,242 | 298,038  |
17.4%  |
| 29 |  West Virginia West Virginia |
2,005,552 | 1,901,974 | 103,578  |
5.4%  |
| 30 |  Arkansas Arkansas |
1,909,511 | 1,949,387 | −39,876  |
−2.0%  |
| 31 |  Kansas Kansas |
1,905,299 | 1,801,028 | 104,271  |
5.8%  |
| 32 |  Oregon Oregon |
1,521,341 | 1,089,684 | 431,657  |
39.6%  |
| 33 |  Nebraska Nebraska |
1,325,510 | 1,315,834 | 9,676  |
0.7%  |
| 34 |  Colorado Colorado |
1,325,089 | 1,123,296 | 201,793  |
18.0%  |
| 35 |  Maine Maine |
913,774 | 847,226 | 66,548  |
7.9%  |
| — |  District of Columbia District of Columbia |
802,178 | 663,091 | 139,087  |
21.0%  |
| 36 |  Rhode Island Rhode Island |
791,896 | 713,346 | 78,550  |
11.0%  |
| 37 |  Arizona Arizona |
749,587 | 499,261 | 250,326  |
50.1%  |
| 38 |  Utah Utah |
688,862 | 550,310 | 138,552  |
25.2%  |
| 39 |  New Mexico New Mexico |
681,187 | 531,818 | 149,369  |
28.1%  |
| 40 |  South Dakota South Dakota |
652,740 | 642,961 | 9,779  |
1.5%  |
| 41 |  North Dakota North Dakota |
619,636 | 641,935 | −22,299  |
−3.5%  |
| 42 |  Montana Montana |
591,024 | 559,456 | 31,568  |
5.6%  |
| 43 |  Idaho Idaho |
588,637 | 524,873 | 63,764  |
12.1%  |
| 44 |  New Hampshire New Hampshire |
533,242 | 491,524 | 41,718  |
8.5%  |
| — |  Hawaii Hawaii |
499,794 | 422,770 | 77,024  |
18.2%  |
| 45 |  Vermont Vermont |
377,747 | 359,231 | 18,516  |
5.2%  |
| 46 |  Delaware Delaware |
318,085 | 266,505 | 51,580  |
19.4%  |
| 47 |  Wyoming Wyoming |
290,529 | 250,742 | 39,787  |
15.9%  |
| 48 |  Nevada Nevada |
160,083 | 110,247 | 49,836  |
45.2%  |
| — |  Alaska Alaska |
128,643 | 72,524 | 56,119  |
77.4%  |
| — |  United States United States |
151,325,798 | 132,164,569 | 19,161,229  |
14.5%  |
Locations of 50 most populous cities
[edit]
Location of 50 largest cities by population in the United States in 1950
- ^ "Population and Area (Historical Censuses)" (PDF). United States Census Bureau. Archived (PDF) from the original on June 24, 2008. Retrieved June 20, 2008.
- ^ a b "1950 Census on Track for 2022 Release, Despite Pandemic". National Archives and Records Administration. April 30, 2021. Retrieved January 13, 2022.
- ^ "Library Bibliography Bulletin 88, New York State Census Records, 1790–1925". New York State Library. October 1981. p. 45. Retrieved December 15, 2008.
- ^ "The "72-Year Rule" – History". United States Census Bureau. Retrieved October 26, 2015.
- ^ "Free 1950 Census Search". Historic Journals LLC. Retrieved March 31, 2022.
- ^ Population of the 100 Largest Cities and Other Urban Places in the United States: 1790 to 1990, United States Census Bureau, 1998
- ^ "Regions and Divisions". United States Census Bureau. Archived from the original on December 3, 2016. Retrieved September 9, 2016.
- Historic US Census data
- 1951 U.S Census Report Contains 1950 census results

