3.5 Productivity (original) (raw)
Because of the large number of products, the design of the scenarios on productivity relies on very simplistic assumptions: the starting point is always historical productivity growth from 2000- 2010 which is computed based on FAOSTAT production data (FAOSTAT, 2020).
The default assumption in the High productivity growth scenario is that the historical growth rate will be multiplied by -1 if it was negative, by 2 if it was below 1%, and by 0.7 if it was above 1%. For the Low productivity growth scenario, the historical growth rate is multiplied by -0.5 if the historical growth rate was negative, by 0.5 if it was lower than 1%, and by 0.1 if it was higher than 1%.
Two additional alternative scenarios are available: NoChange which fixes the crop productivity to the 2010 level, and BAUGrowth which uses the same crop productivity growth as observed during 2000-2010. We have added a condition so that productivity cannot drop below 50% of the reported yield in 2010. In the future, we plan to add maximum productivity values to avoid unrealistic productivity projections. This is a priority for improving the tool.
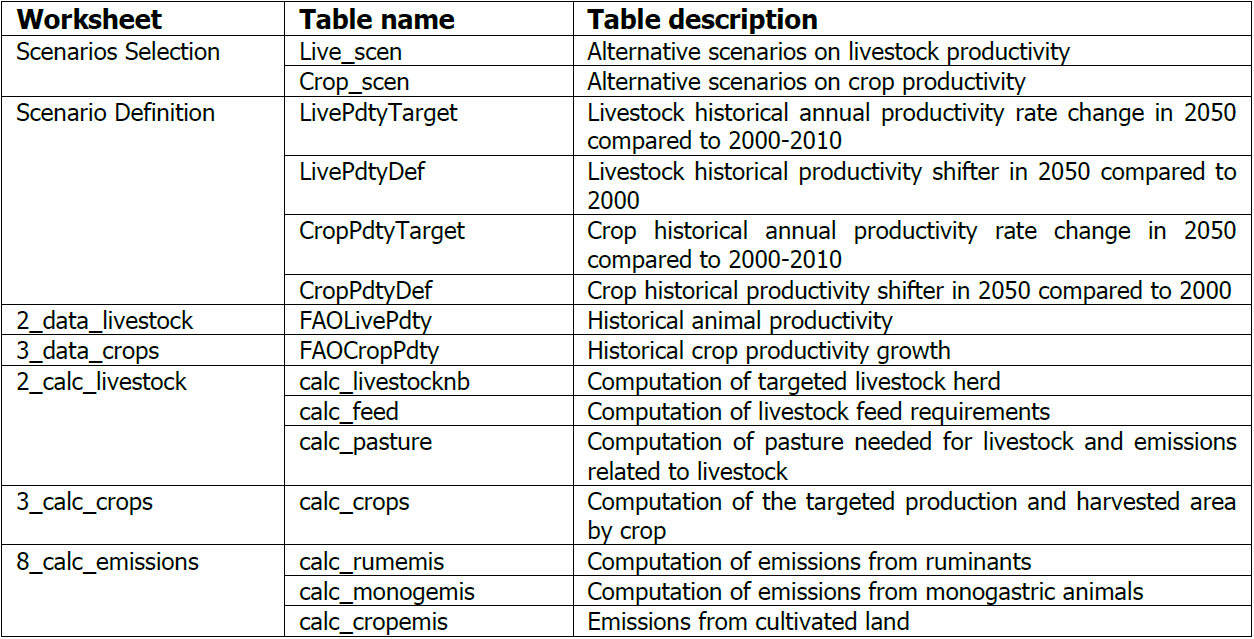
Table 8. List of tables related to the productivity scenarios