4.1T3 Training Materials: Exercise "Human Demand" (original) (raw)
Exercise: "FABLE Calculator model structure"
The indicator closely related to Food Security in the FABLE Calculator is daily food intake per capita, or kcal_target, and its relationship with the minimum healthy standard called minimum daily energy requirement, or MDER.
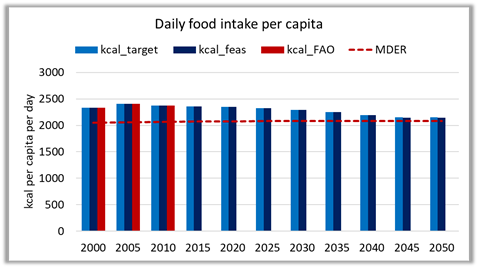
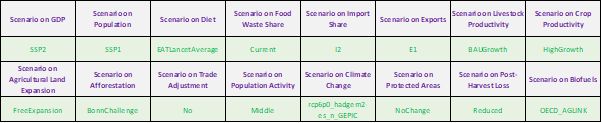
In the video for this section, we revised the parallel indicator kcal_feas, which is always calculated in a similar manner than kcal_target, but including possible limitations to the desired food consumption, for example, the extent of land availability. In this exercise, we will explore different scenario choices that could make our model infeasible, so we can understand better the difference between both indicators. The graph above achieves both targeted and feasible kilocalorie intake per capita above MDER levels, but contingent upon the following choice of scenarios:
What change of which scenarios would you think could make the model infeasible, which would create a gap between kcal_target and kcal_feas?
Let us explore!
- Population growth is related to food intake per capita: the more people there are in a country, the more food that is required to feed them. Currently, the chosen population scenario is SSP1, which as we can see in the Scenario Selection worksheet of the Open calculator, implies a population variation between 2000- 2050 of 1.23. The highest parameter in this column is 1.49, which belongs to the “UN High” scenario choice. Let us change our selection to this one.
- Tracing back the formula of kcal_target, we see that an element that influences its growth is calc_hum_demand[foodshift], which is contingent on a scenario choice defined in DietScenDef[Shifter]. Let us change the Diet scenario to a higher consumption of meat and fat, “Fat Diet”
- The scenario on Food loss is now selected as “Current” which implies the same share of wasted food, recorded for the region in 2010. Let us increase the share of food that is wasted, by choosing the scenario “Increased”
- Productivity scenarios are now in BAU Growth for livestock and High Growth for crops, let us select “No Growth” for both
- Lastly, let us limit the expansion of land, by changing our current scenario of “Free Expansion” to “No expansion”
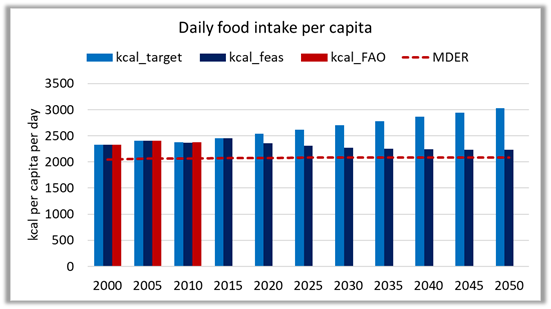
With these changes, what we are asking of the model is to try to feed a higher growing population with goods like meat and fat that are land intensive, with very low increase in productivity, and no possibility of productive land expansion. The hypothesis is that for these changes, the model will begin to signal us an infeasibility, through a mismatch in kcal_target vs kcal_feasible values, as you can now see:
Furthermore, there are other ways in which the calculator signals us possible errors and infeasibilities:
- Table 2.D: chk_herd
- Table 2.J: Chk_animproducts
- Table 3.D: ChkCrops
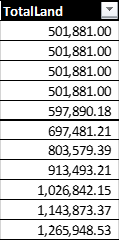
- Total land must always be constant, in Tables ResultsLand and calc_land_cor
- Target values must always be equal to feasible values
- Values calculated for 2000-2015 must always be close to historical values
- Negative numbers that are not valid
For example, calc_land_cor[TotalLand] has gone from being constant throughout all the years analyzed to the following values:
Explore each of the enlisted checks within the calculator, with the default choices of scenarios vs the ones we have chosen above, and document the differences. This will help you slowly understand how the model works, and the causality links that conform the results.