GitHub - Seungwoo321/vue-datamaps: It is a Vue port of the javascript-based DataMaps (original) (raw)
Vue Datamaps
It is a Vue port of the javascript-based DataMaps
Contributors
Live demo
Run demo
project clone
$ git clone https://github.com/Seungwoo321/vue-datamaps.git
install dependencies
$ npm install
run
$ npm run dev
Installation
install
$ npm install vue-datamaps
Base Usage
Required
- json data is no longer required.
Global
main.js
import Vue from 'vue' import VueDatamaps from 'vue-datamaps'
Vue.use(VueDatamaps)
vue template
Component Style
vue template
Example
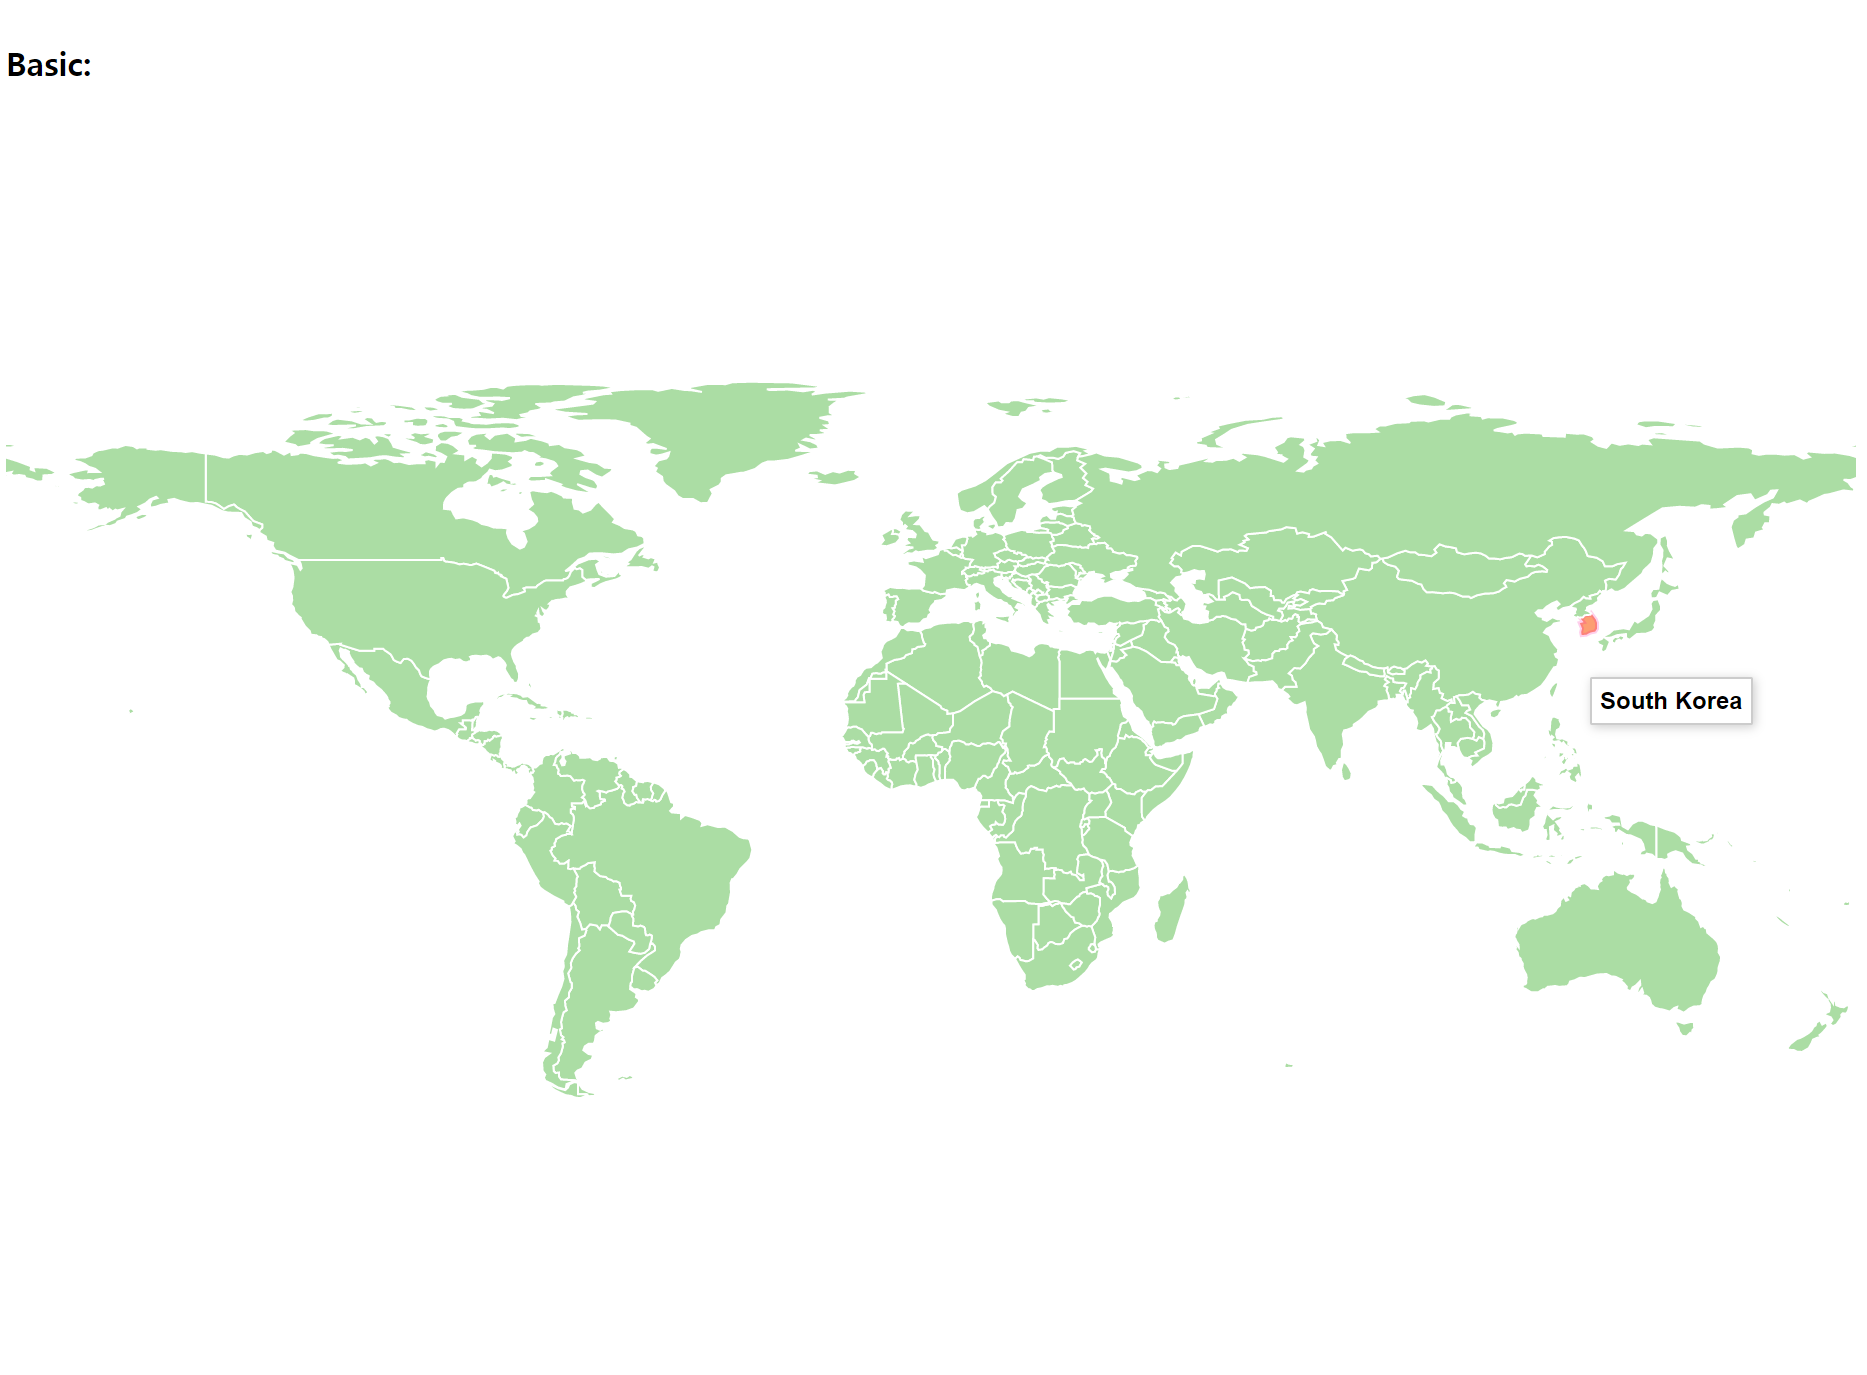
Basic:
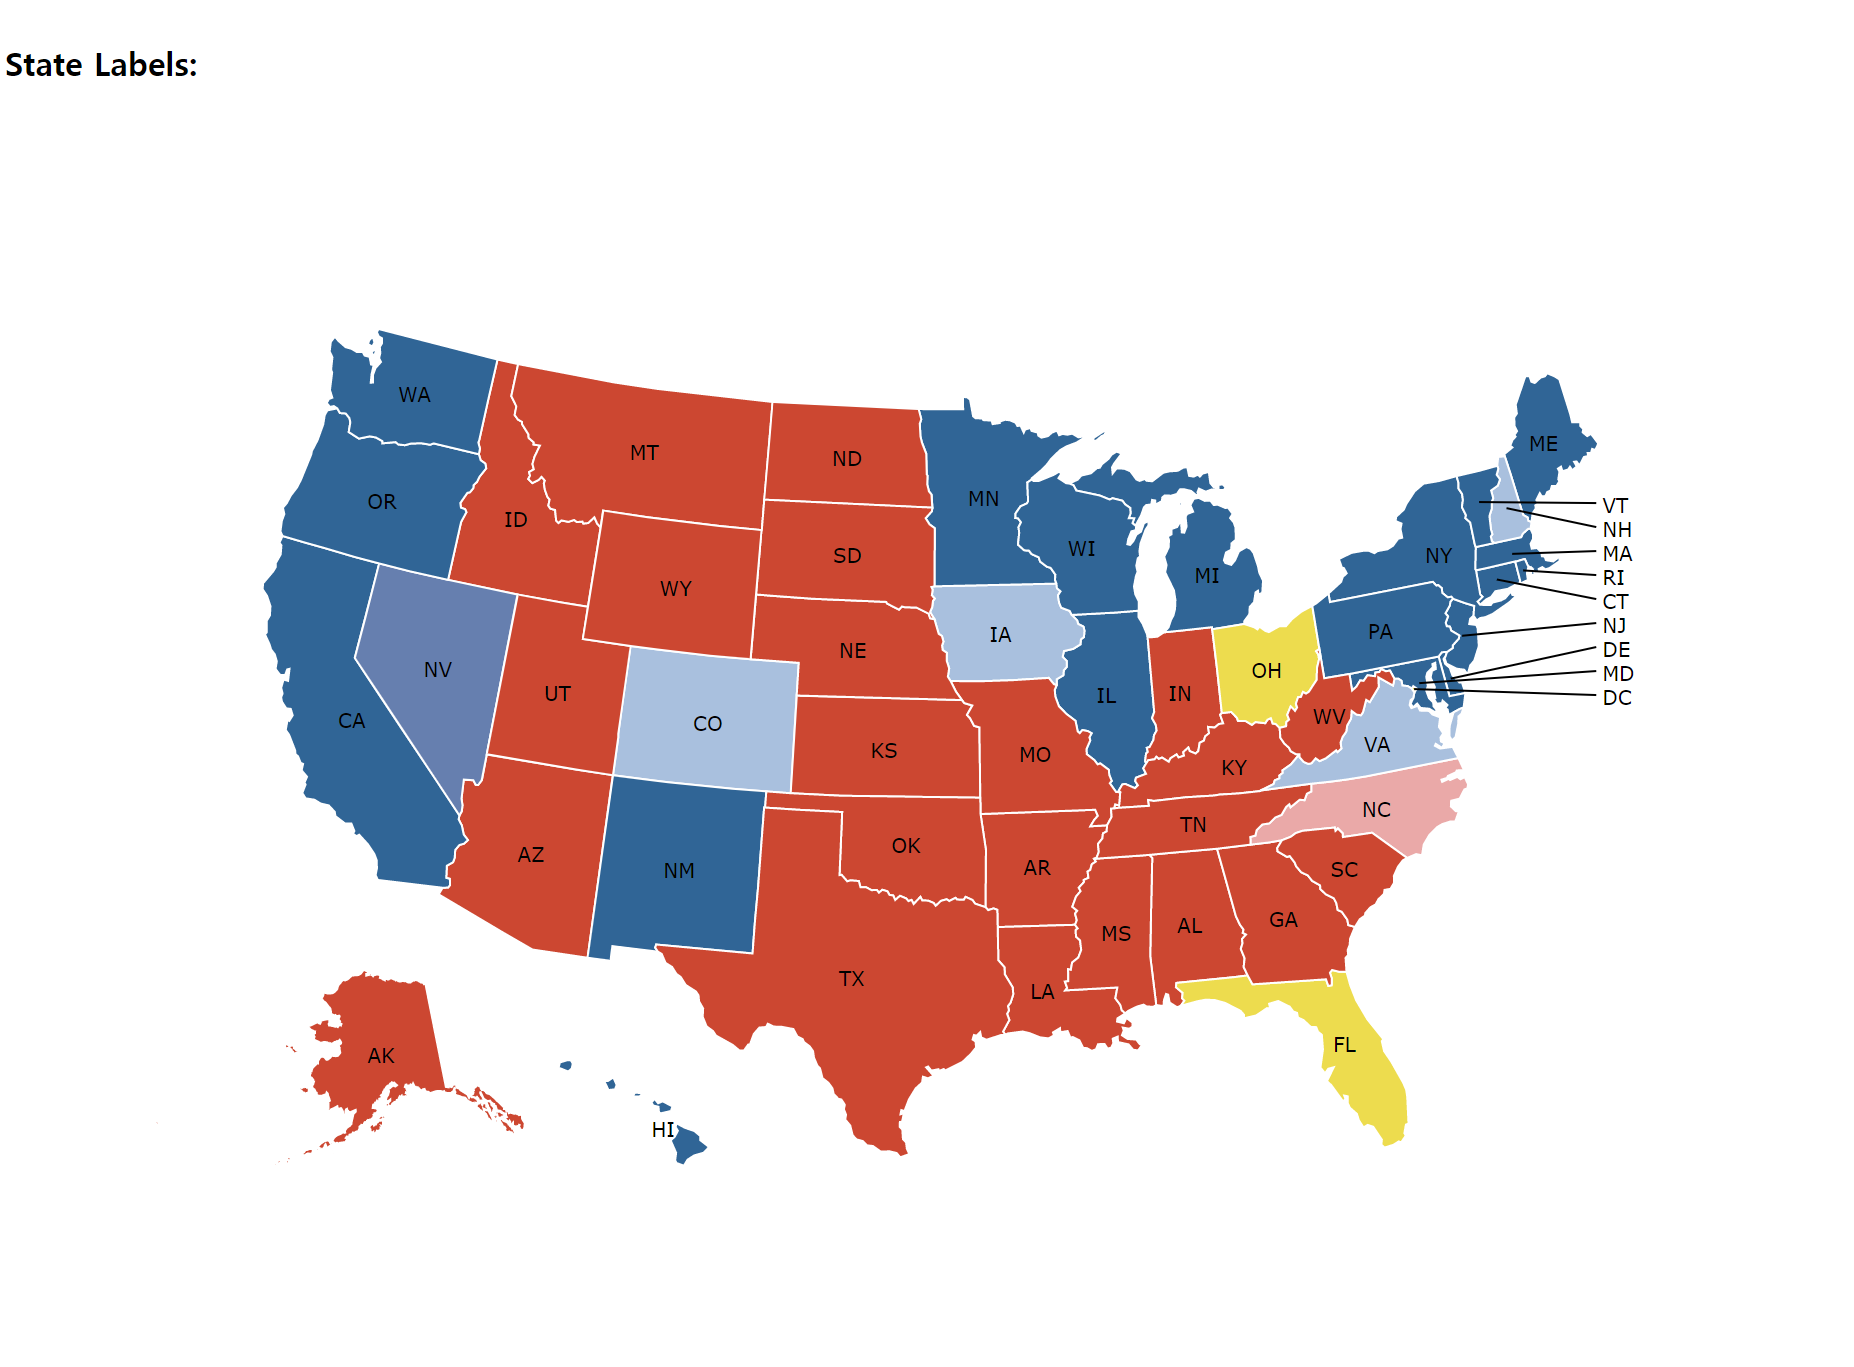
State Labels:
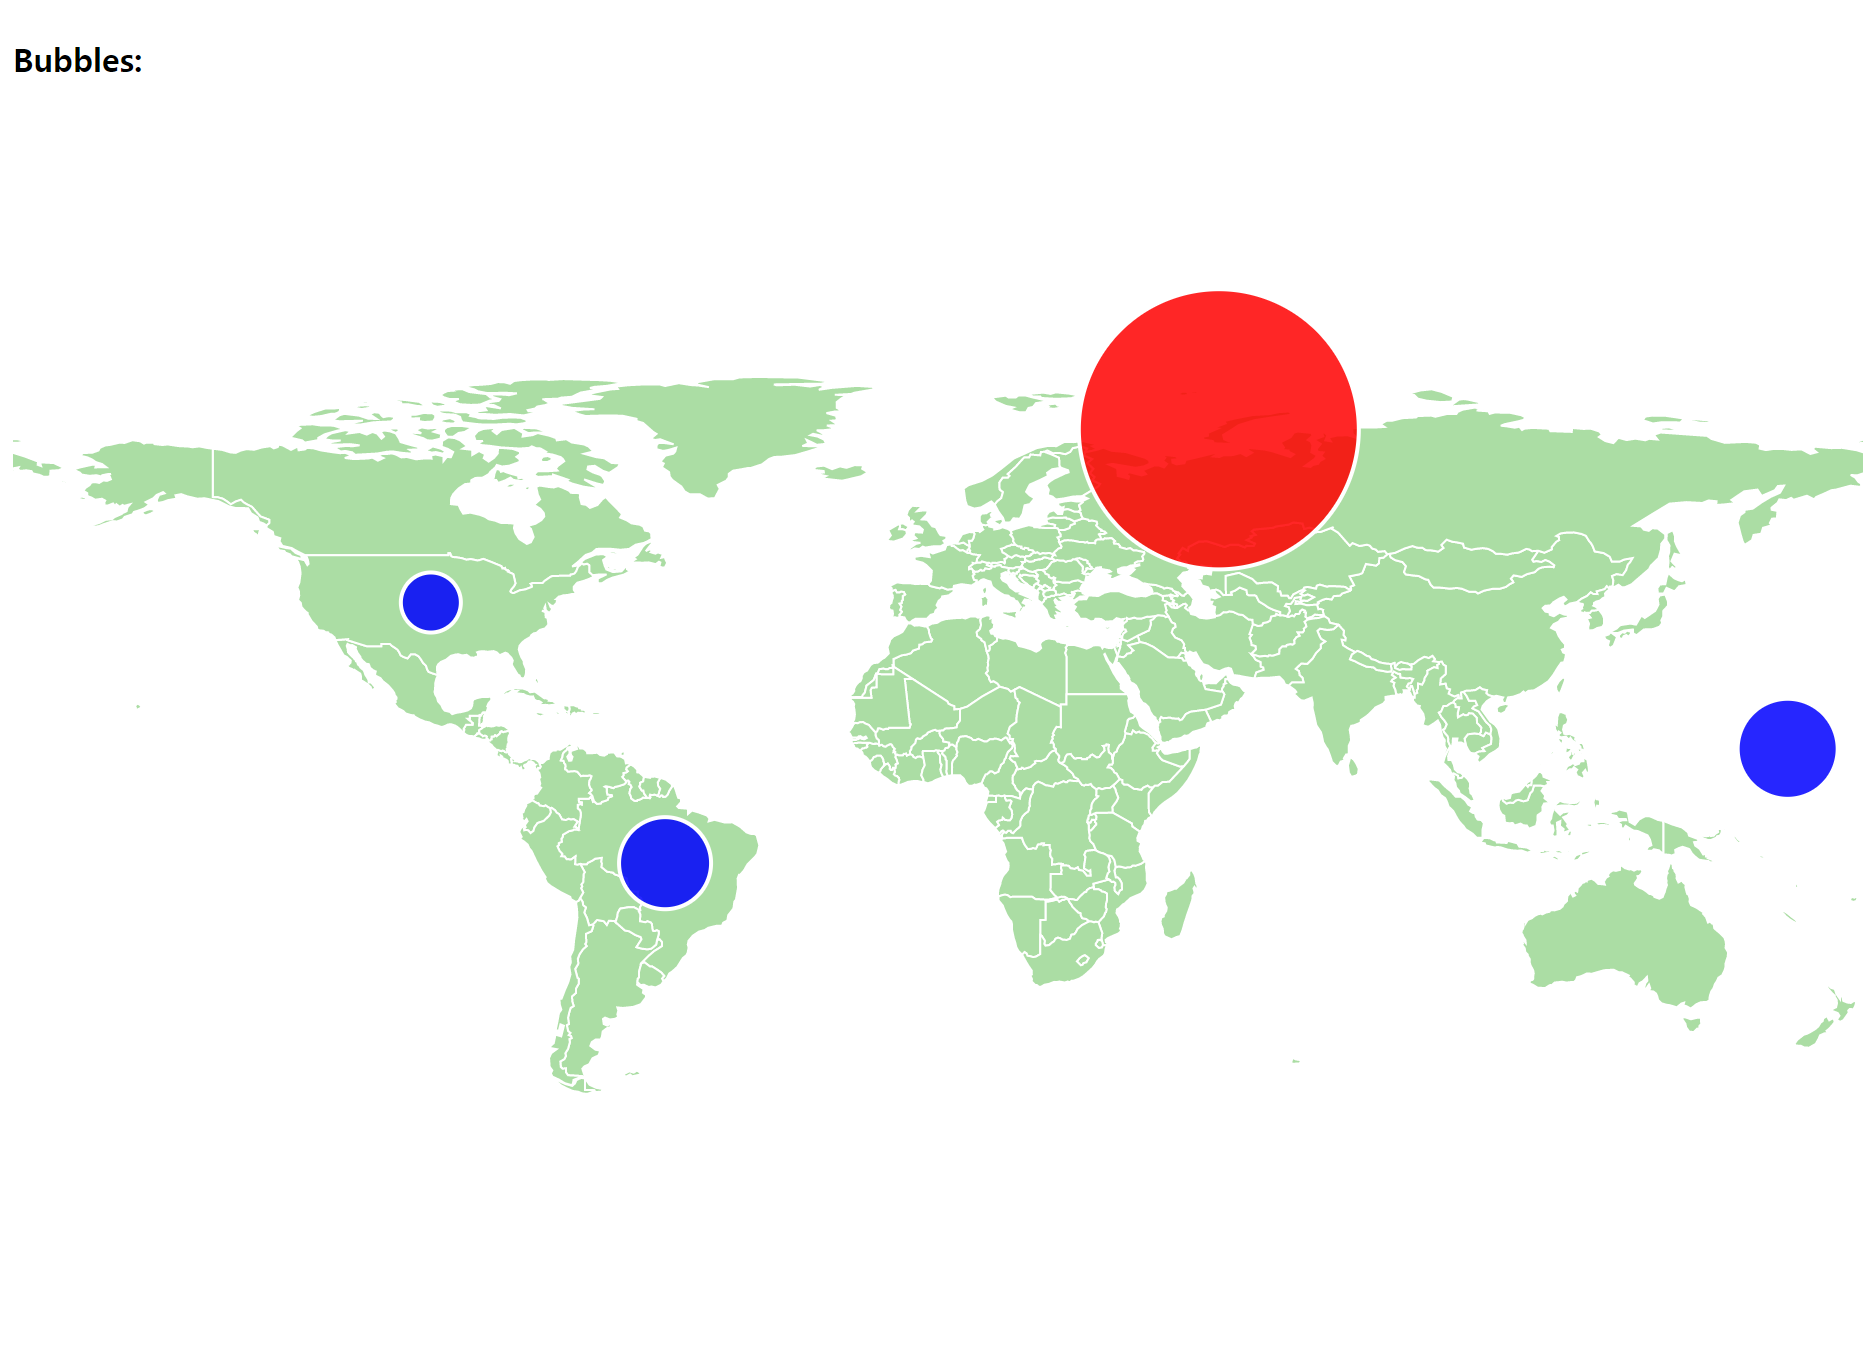
Bubbles:
Exploded on {{ popupData.date }} by the {{ popupData.country }}
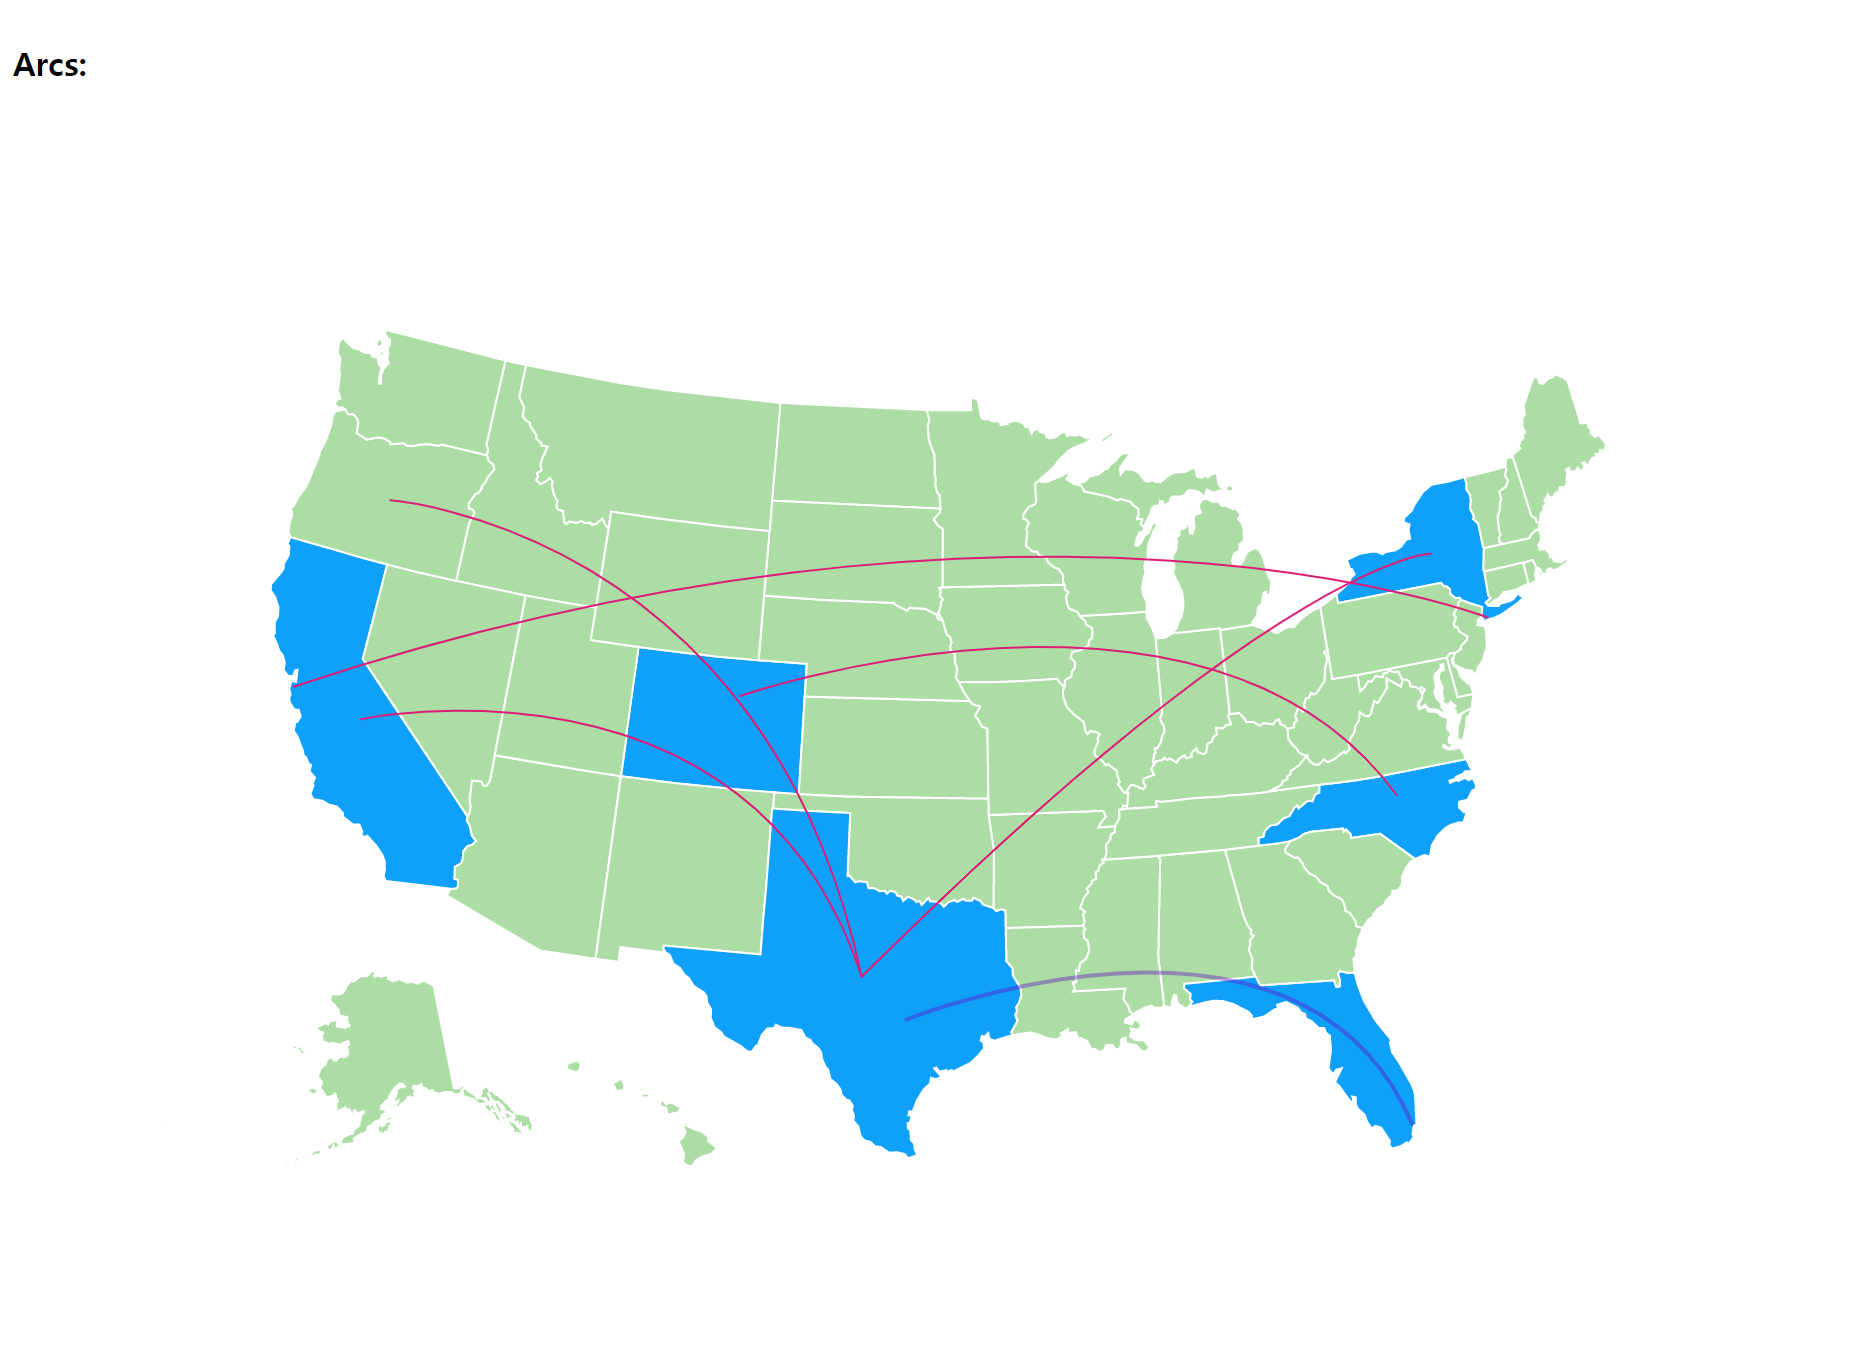
Arcs:
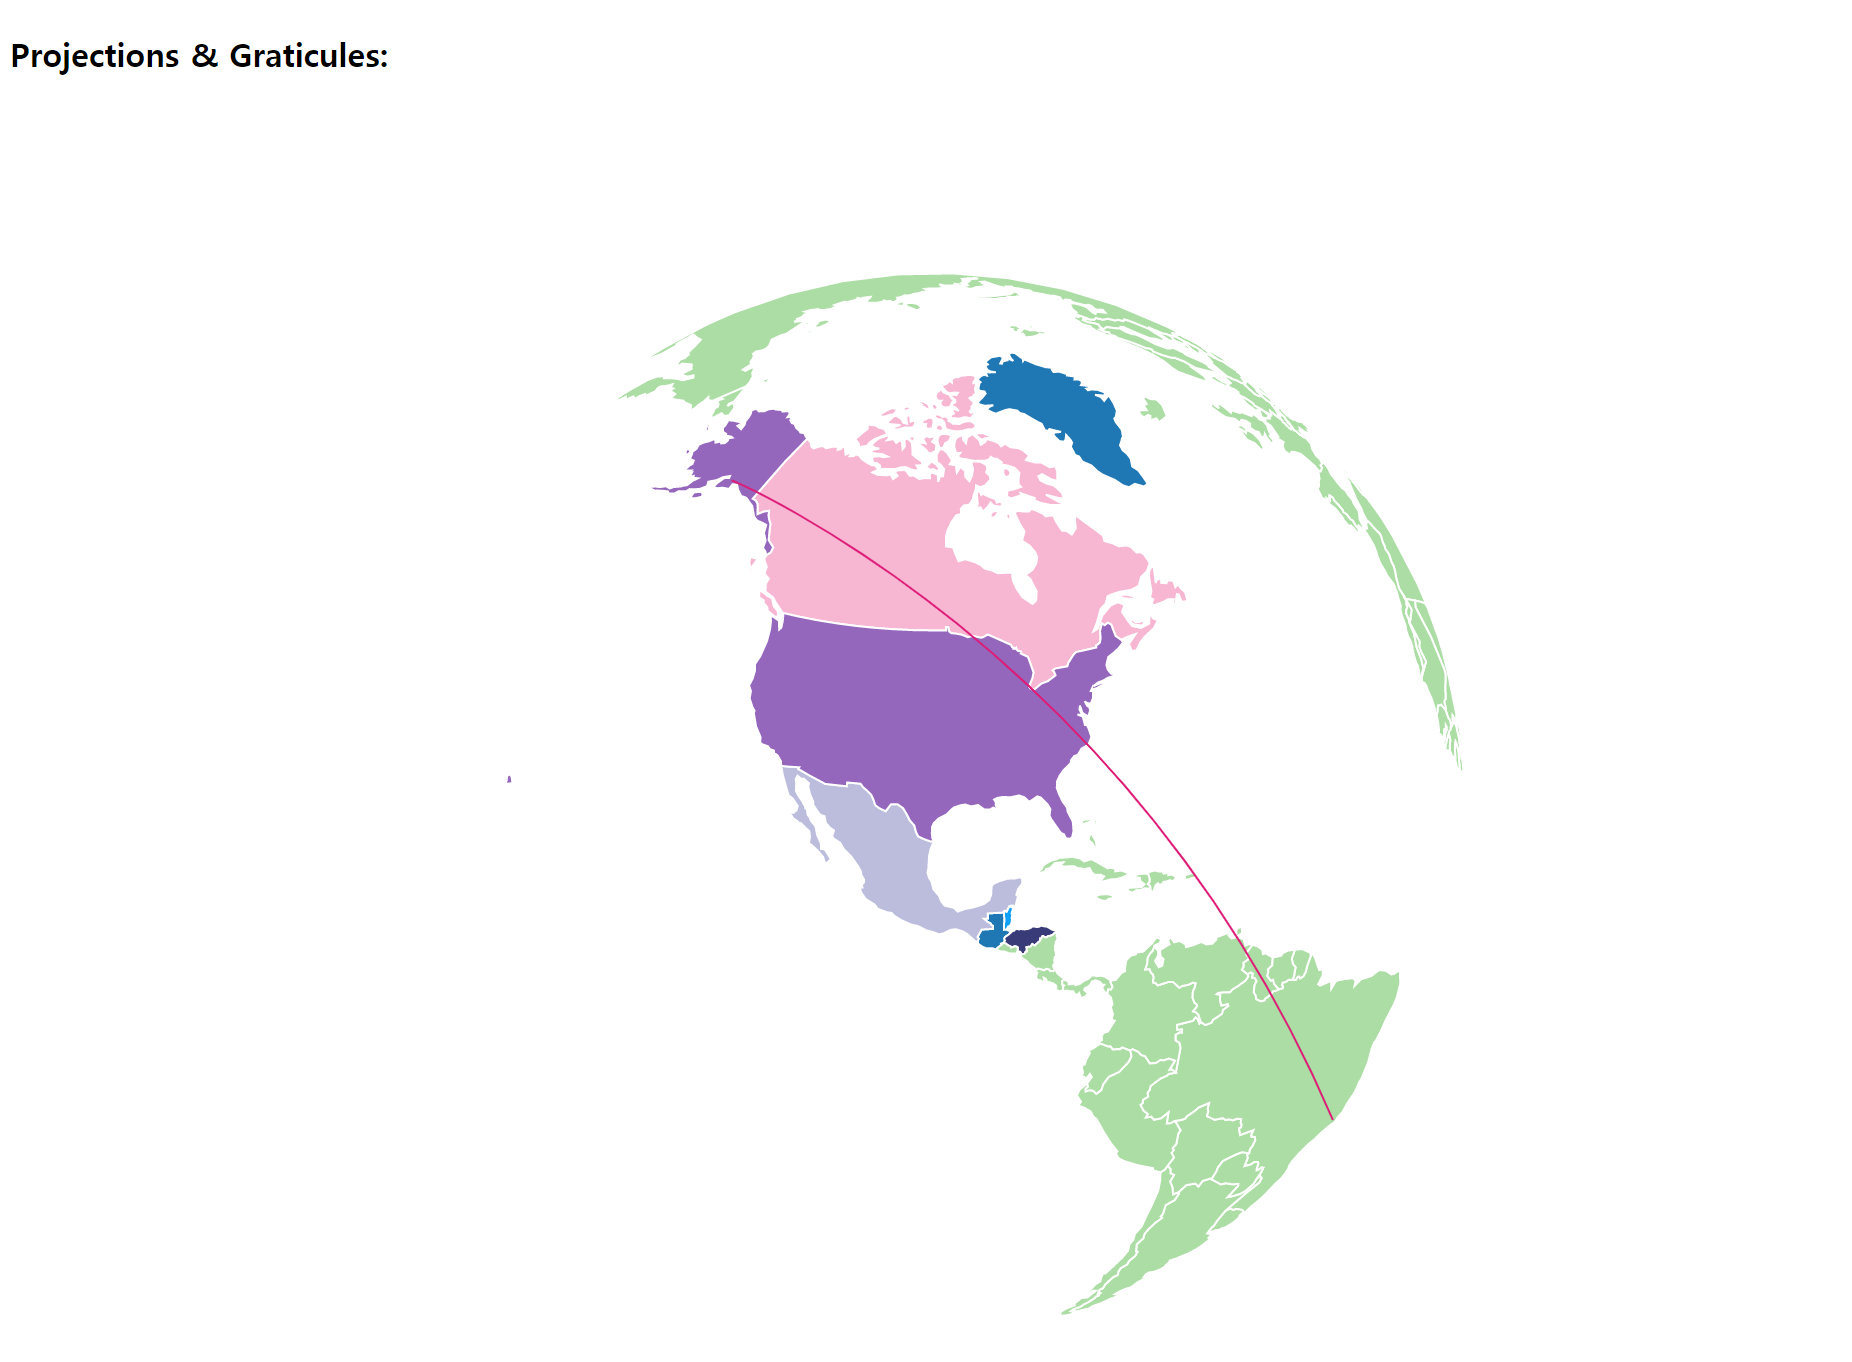
Projections & Graticules:
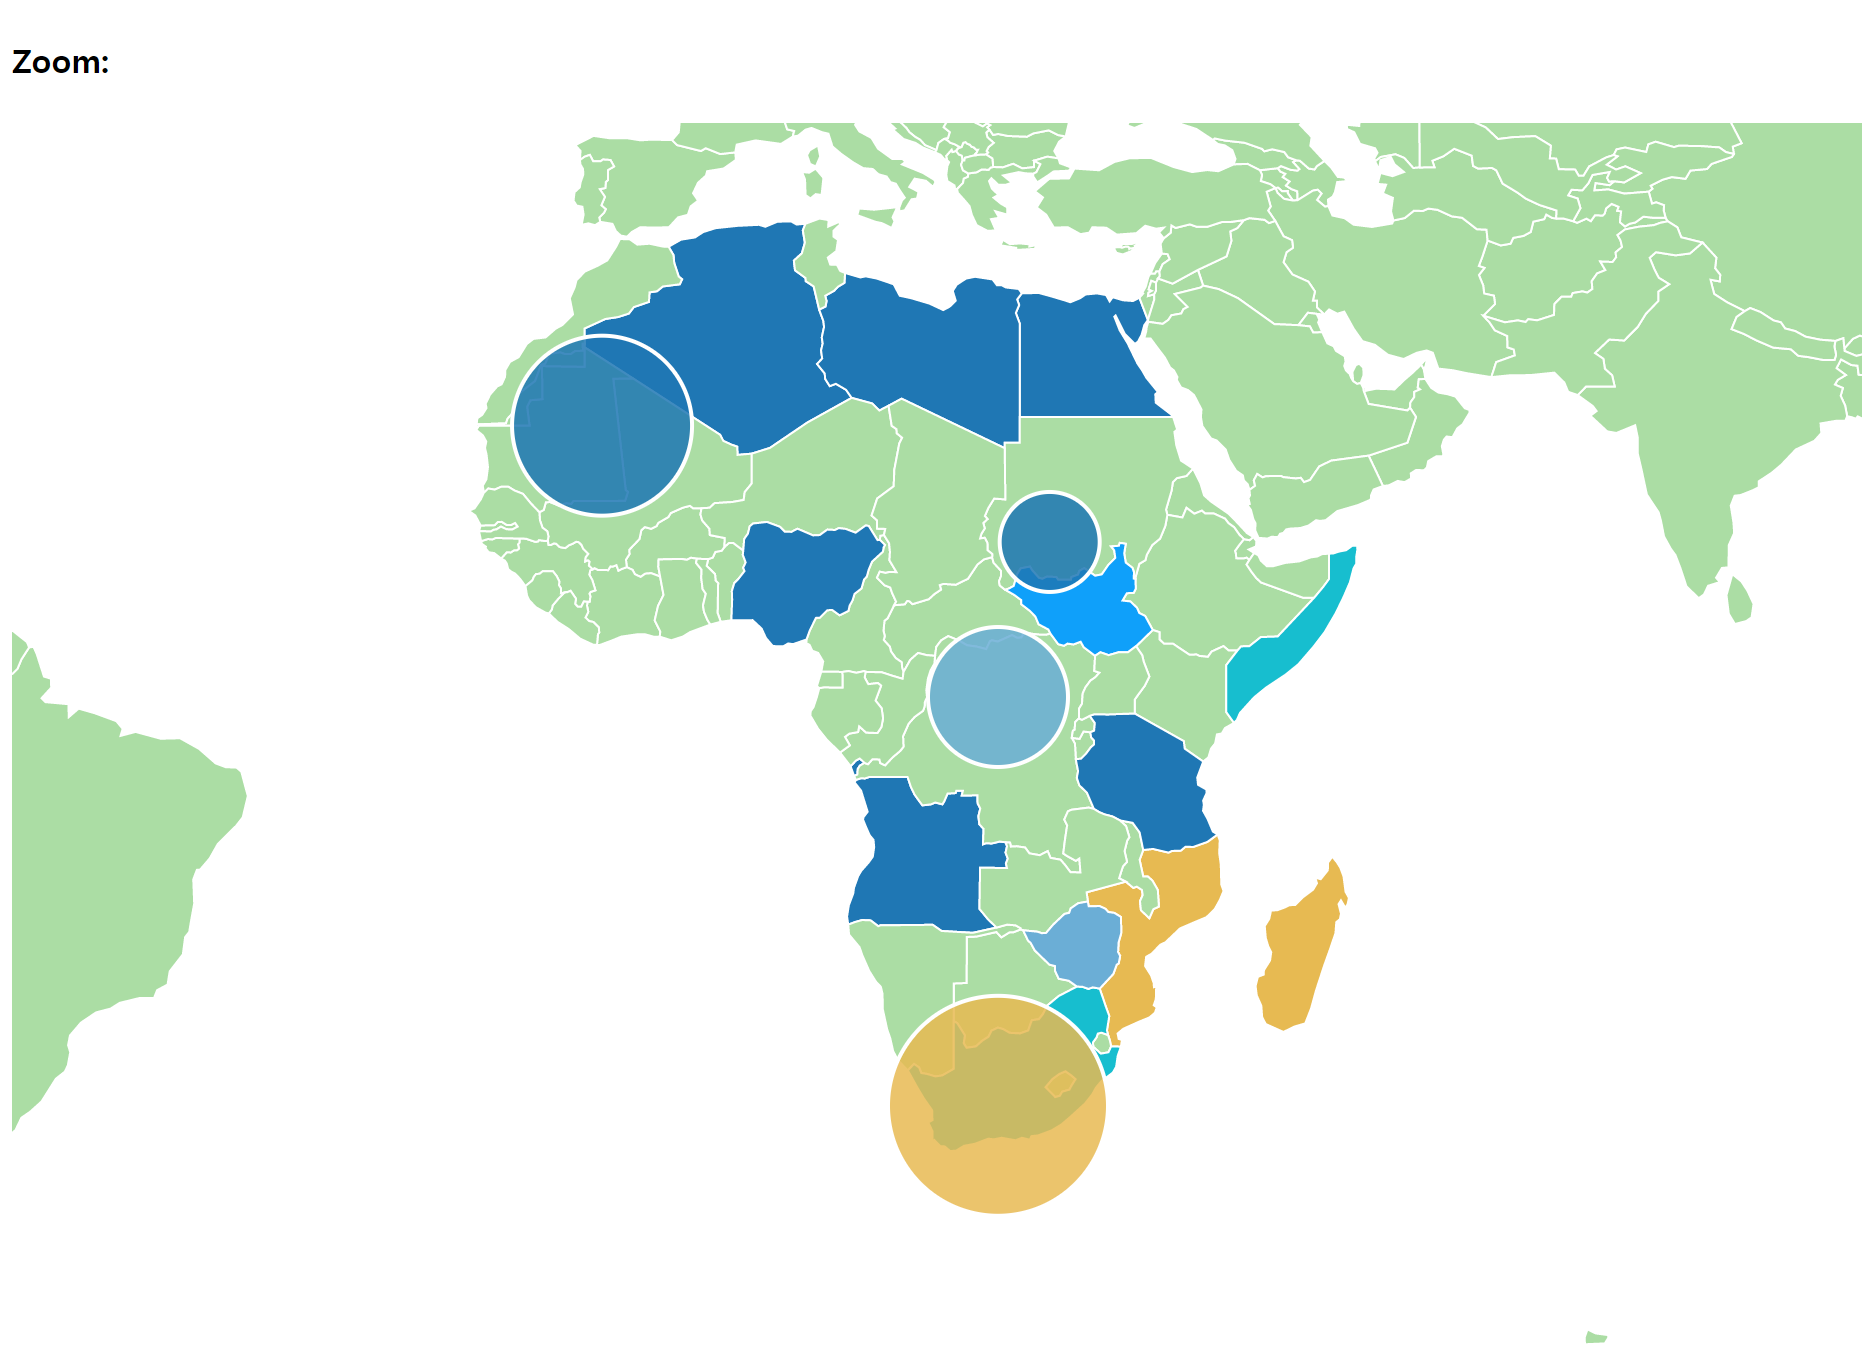
Zoom:
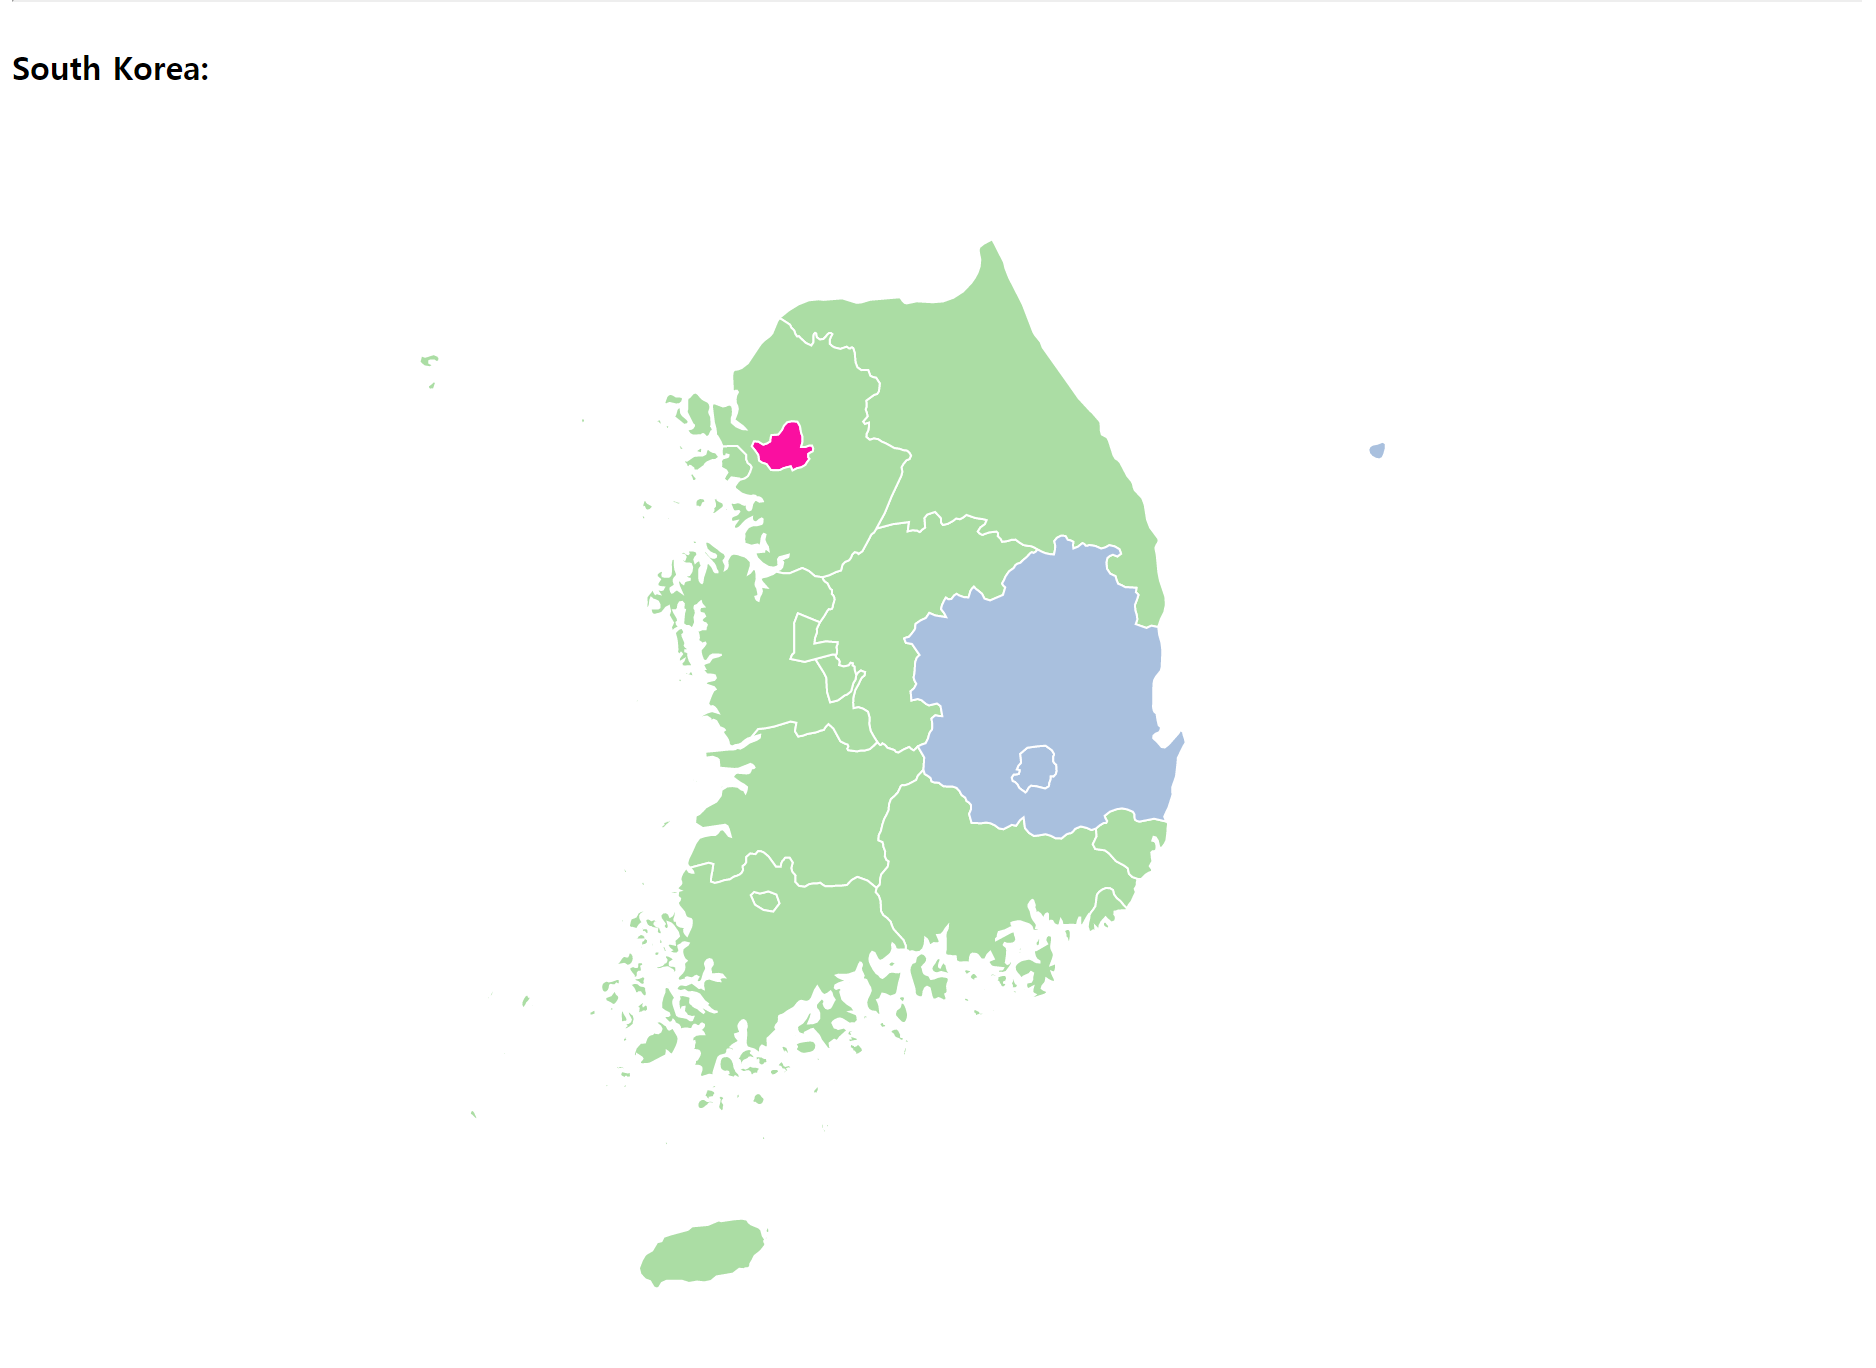
South Korea:
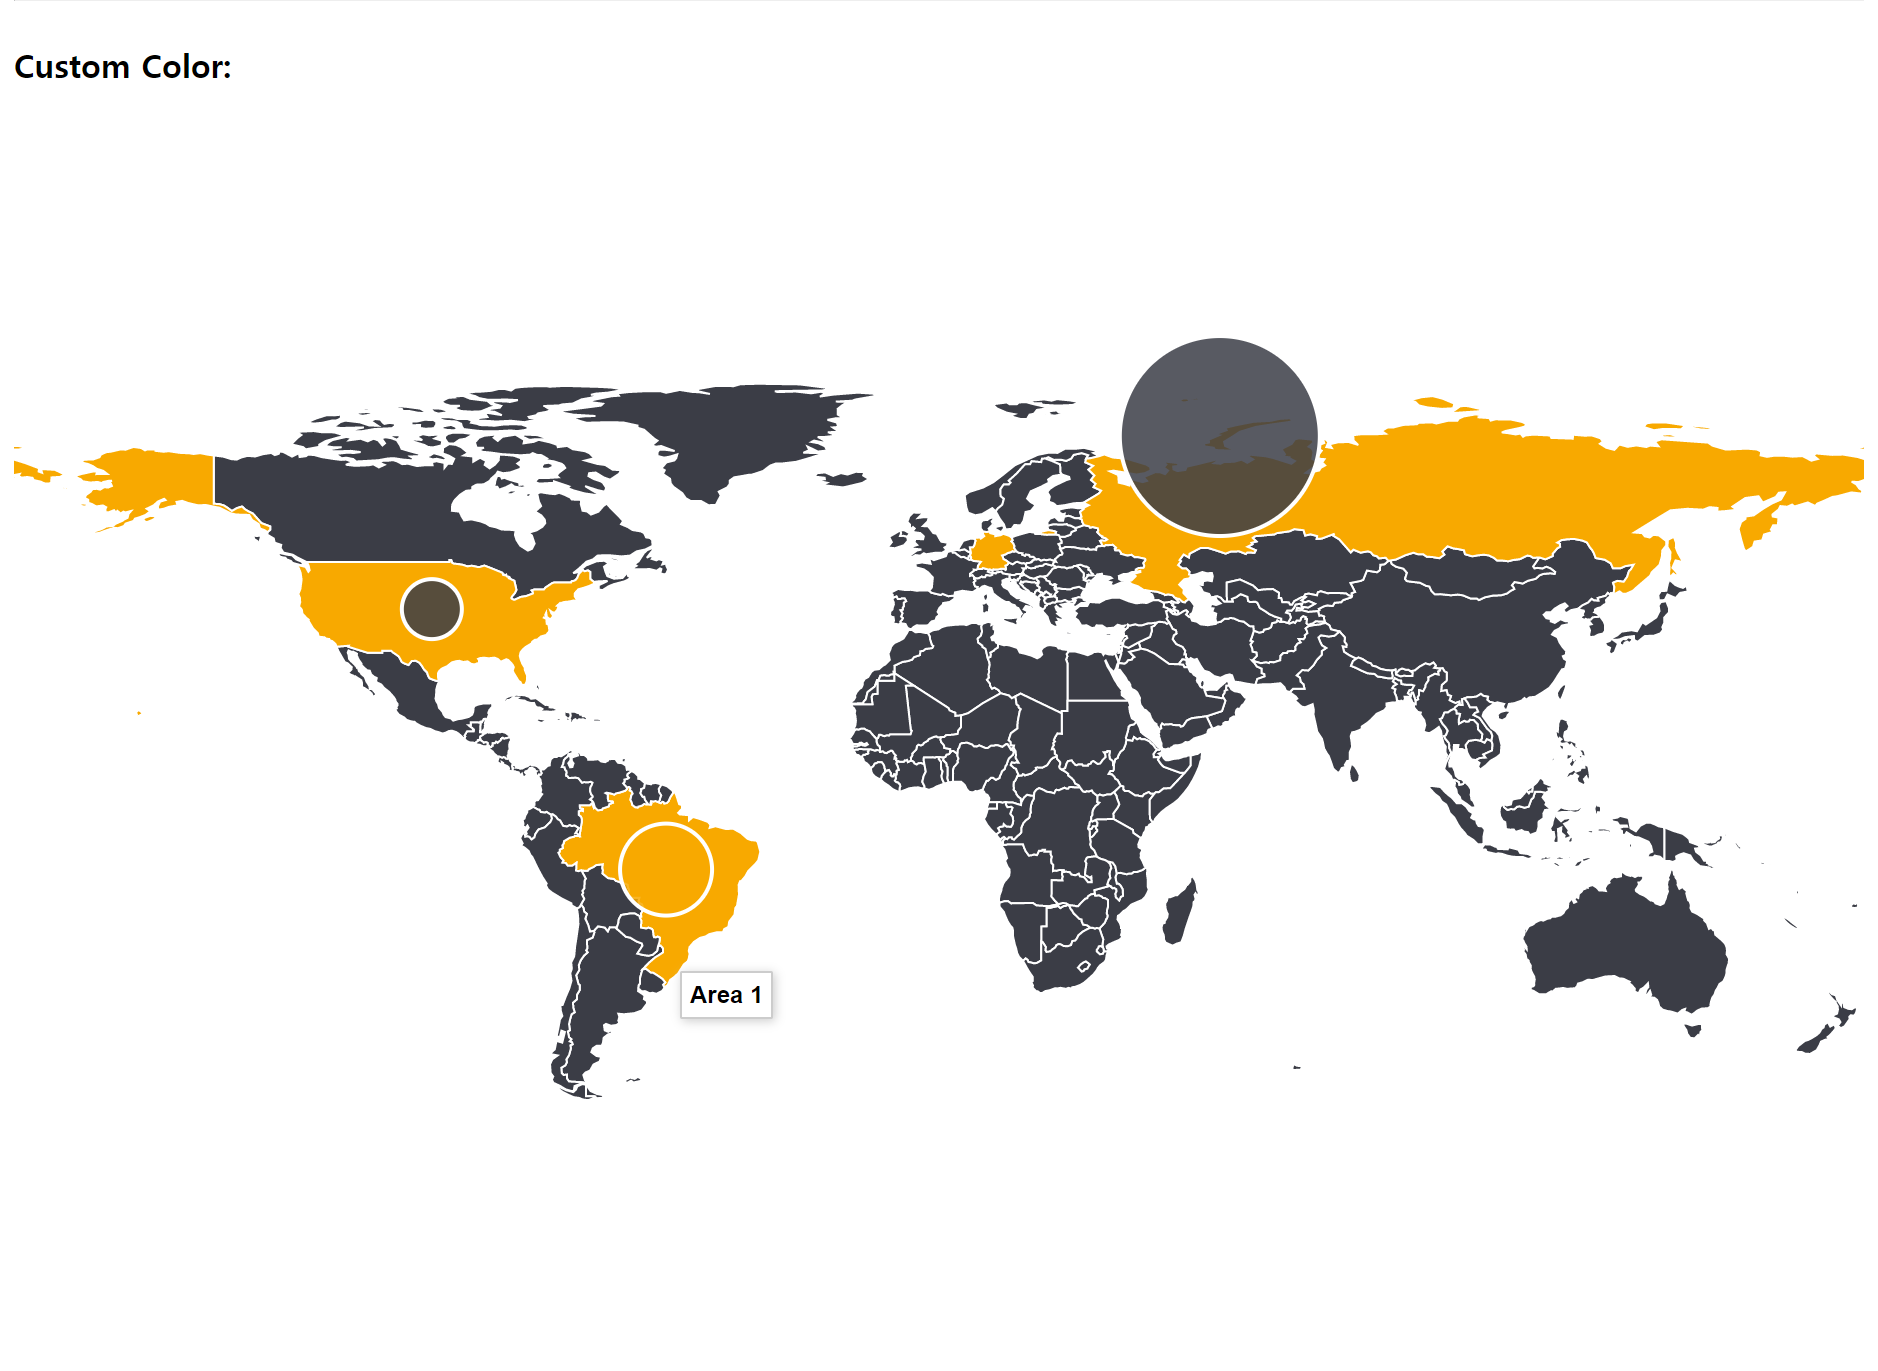
Custom Color:
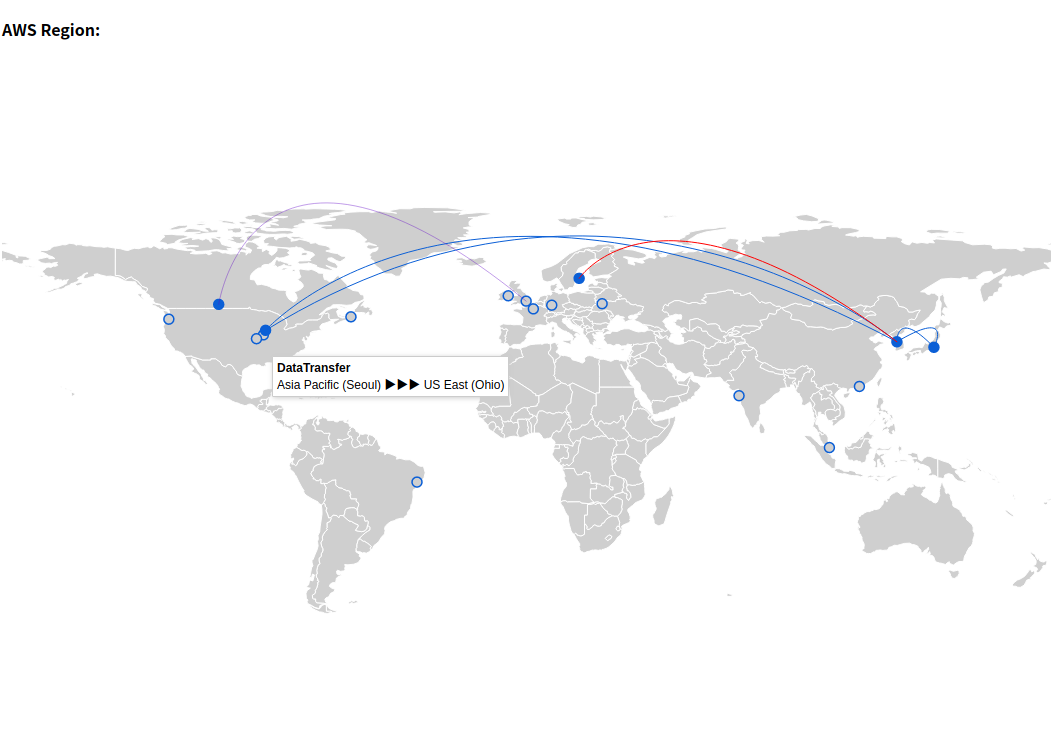
AWS Region:
{{ popupData.origin }} ▶▶▶ {{ popupData.destination }}
Available Props Option
scope
- type: String
- value: world, usa, custom_map
Same as the original.
setProjection
- type: Function
- value: See sample code.
Same as original but d3 version different.
projection
- type: String
- value: Equirectangular, Orthographic, Mercator
Same as original but PascalCase.
dataType
- type: String
- value json, csv
Same as original.
data
- type: Object
- value: See sample code.
Same as original.
done
- type: Function
Not implemented.
fills
- type: Object
- value: The keys in this object map to the "fillKey" of [data] or [data of bubbles]
Same as original.
geographyConfig
- type: Object
- value: See sample code.
Same as original but not include popupTemplate.
bubblesConfig
- type: Object
- value: See sample code.
Same as original but not include popupTemplate.
bubbles
- type: Boolean
- value: true, falseIf
bubblesConfigrequired.
arcConfig
- type: Object
- value: See sample code.
Same as original but not include popupTemplate.
arc
- type: Boolean
- value: true, false
If arcConfig required.
disableDefaultStyles
- type: Boolean
- value: true, false
Not implemented.
labelsConfig
- type: Object
- value: See sample code.
Same as original.
labels
- type: Boolean
- value: true, false
If labelsConfig required.
popupTemplate
- type: Boolean
- value: true, false
If slot hoverinfo and event custom:popup||custom:popup-bubble||custom:popup-arc||custom:popup-region|| required.
Default Props Option
{
scope: 'world',
setProjection: (d3, element) => {
let projection = null
let path = null
if (this.scope === 'usa') {
projection = d3.geoAlbersUsa()
.scale(this.svgWidth)
.translate([this.svgWidth / 2, this.svgHeight / 2])
} else if (this.scope === 'world') {
projection = d3geo${this.projection}
.scale((this.svgWidth + 1) / 2 / Math.PI)
.translate([this.svgWidth / 2, this.svgHeight / (this.projection === 'Mercator' ? 1.45 : 1.8)])
}
if (this.projection === 'Orthographic') {
this.svg.append('defs').append('path')
.datum({ type: 'Sphere' })
.attr('id', 'sphere')
.attr('d', path)
    this.svg.append('use')
        .attr('class', 'stroke')
        .attr('xlink:href', '#sphere')

    this.svg.append('use')
        .attr('class', 'fill')
        .attr('xlink:href', '#sphere')
    projection.scale(this.svgWidth / Math.PI * 0.9).clipAngle(90).rotate(this.projectionConfigOptions.rotation)
}

path = d3.geoPath()
    .projection(projection)
return { projection, path }
}, projection: 'Equirectangular', dataType: 'json', data: {}, done: function () { return {} }, fills: { authorHasTraveledTo: '#fa0fa0', defaultFill: '#ABDDA4' }, geographyConfig: { dataUrl: null, hideAntarctica: true, hideHawaiiAndAlaska: false, borderWidth: 1, borderOpacity: 1, borderColor: '#FDFDFD', popupOnHover: true, highlightOnHover: true, highlightFillColor: '#FC8D59', highlightBorderColor: 'rgba(250, 15, 160, 0.2)', highlightBorderWidth: 2, highlightBorderOpacity: 1, highlightFillOpacity: 0.85 }, projectionConfig: { rotation: [97, 0] }, bubblesConfig: { borderWidth: 2, borderOpacity: 1, borderColor: '#FFFFFF', popupOnHover: true, radius: null, fillOpacity: 0.75, animate: true, highlightOnHover: true, highlightFillColor: '#FC8D59', highlightBorderColor: 'rgba(250, 15, 160, 0.2)', highlightBorderWidth: 2, highlightBorderOpacity: 1, highlightFillOpacity: 0.85, exitDelay: 100, key: JSON.stringify, data: [] }, bubbles: false, arcConfig: { strokeColor: '#DD1C77', strokeWidth: 1, arcSharpness: 1, animationSpeed: 600, popupOnHover: false, data: [] }, arc: false, disableDefaultStyles: false, labelsConfig: { fontSize: 10, fontFamily: 'Verdana', labelColor: '#000', lineWidth: 1 }, labels: false, popupTemplate: false, awsRegions: false, awsRegionsConfig: { strokeColor: '#0b5fd6', strokeWidth: 1.5, defaultFill: 'transparent', highlightFillOpacity: 1, showPrivateRegions: false, popupOnHover: false, data: [] } }
Slot & Event for @mouseover
when geography mouse hover:
- slot:
hoverinfo - event:
custom:popup
- slot:
when bubbles mouse hover:
- slot:
hoverBubbleInfo - event:
custom:popup-bubble
- slot:
when arc mouse hover:
- slot:
hoverArcInfo - event:
custom:popup-arc
- slot:
when aws-region mouse hover
- slot:
hoverRegionInfo - event:
custom:popup-region
- slot:
Inspired
- markmarkoh/datamaps - original
- btmills/react-datamaps - React-based datamaps library
- jsonmaur/aws-regions - AWS Regions and Availability Zones
License
MIT