GitHub - ctlab/gatom: Finding an Active Metabolic Module in Atom Transition Network (original) (raw)
![]()
gatom
An R-package for finding active metabolic modules in atom transition network.
Full vignette can be foundhere.
Installation
library(devtools) install_github("ctlab/gatom")
Quick start
library(gatom) library(data.table) library(igraph) library(mwcsr)
First let’s load data with atom mappings (network object), enzyme annotations for mouse (org.Mm.eg.gatom) and metabolite annotations (met.kegg.db.rda):
data("networkEx") data("org.Mm.eg.gatom.annoEx") data("met.kegg.dbEx")
Loading input data:
data("met.de.rawEx") data("gene.de.rawEx")
Getting atom graph:
g <- makeMetabolicGraph(network=networkEx, topology = "atoms", org.gatom.anno=org.Mm.eg.gatom.annoEx, gene.de=gene.de.rawEx, met.db=met.kegg.dbEx, met.de=met.de.rawEx)
## Found DE table for genes with RefSeq IDs

## Found DE table for metabolites with HMDB IDs
## IGRAPH b23a8ad UN-- 176 190 --
## + attr: name (v/c), metabolite (v/c), element (v/c), label (v/c), url
## | (v/c), pval (v/n), origin (v/n), HMDB (v/c), log2FC (v/n), baseMean
## | (v/n), logPval (v/n), signal (v/c), label (e/c), pval (e/n), origin
## | (e/n), RefSeq (e/c), gene (e/c), enzyme (e/c), reaction_name (e/c),
## | reaction_equation (e/c), url (e/c), reaction (e/c), log2FC (e/n),
## | baseMean (e/n), logPval (e/n), signal (e/c), signalRank (e/n)
## + edges from b23a8ad (vertex names):
## [1] C00025_-0.3248_2.8125 --C00026_-0.3248_2.8125
## [2] C00025_-1.6238_3.5625 --C00026_-1.6238_3.5625
## [3] C00025_-2.9228_2.8125 --C00026_-2.9228_2.8125
## + ... omitted several edges
Scoring graph, obtaining an instance of SGMWCS (Signal Generalized Maximum Weight Subgraph) problem instance:
gs <- scoreGraph(g, k.gene=25, k.met=25)
Initialize an SMGWCS solver (a heuristic relax-and-cut solverrnc_solver is used for simplicity, check out mwcsr package documentation for more options):
Finding a module:
res <- solve_mwcsp(solver, gs) m <- res$graph
## IGRAPH e74bc24 UN-- 37 36 --
## + attr: signals (g/n), name (v/c), metabolite (v/c), element (v/c),
## | label (v/c), url (v/c), pval (v/n), origin (v/n), HMDB (v/c), log2FC
## | (v/n), baseMean (v/n), logPval (v/n), signal (v/c), score (v/n),
## | label (e/c), pval (e/n), origin (e/n), RefSeq (e/c), gene (e/c),
## | enzyme (e/c), reaction_name (e/c), reaction_equation (e/c), url
## | (e/c), reaction (e/c), log2FC (e/n), baseMean (e/n), logPval (e/n),
## | signal (e/c), signalRank (e/n), score (e/n)
## + edges from e74bc24 (vertex names):
## [1] C00025_-2.9228_2.8125 --C00026_-2.9228_2.8125
## [2] C00024_15.0644_27.8518--C00033_-1.6238_0.5625
## + ... omitted several edges
## [1] "Psat1" "Acss2" "Gpt2" "Got2" "Pkm" "Tpi1"
## [1] "Pyruvate"       "Acetyl-CoA"     "L-Glutamate"    "2-Oxoglutarate"
## [5] "Acetate"        "Oxaloacetate"
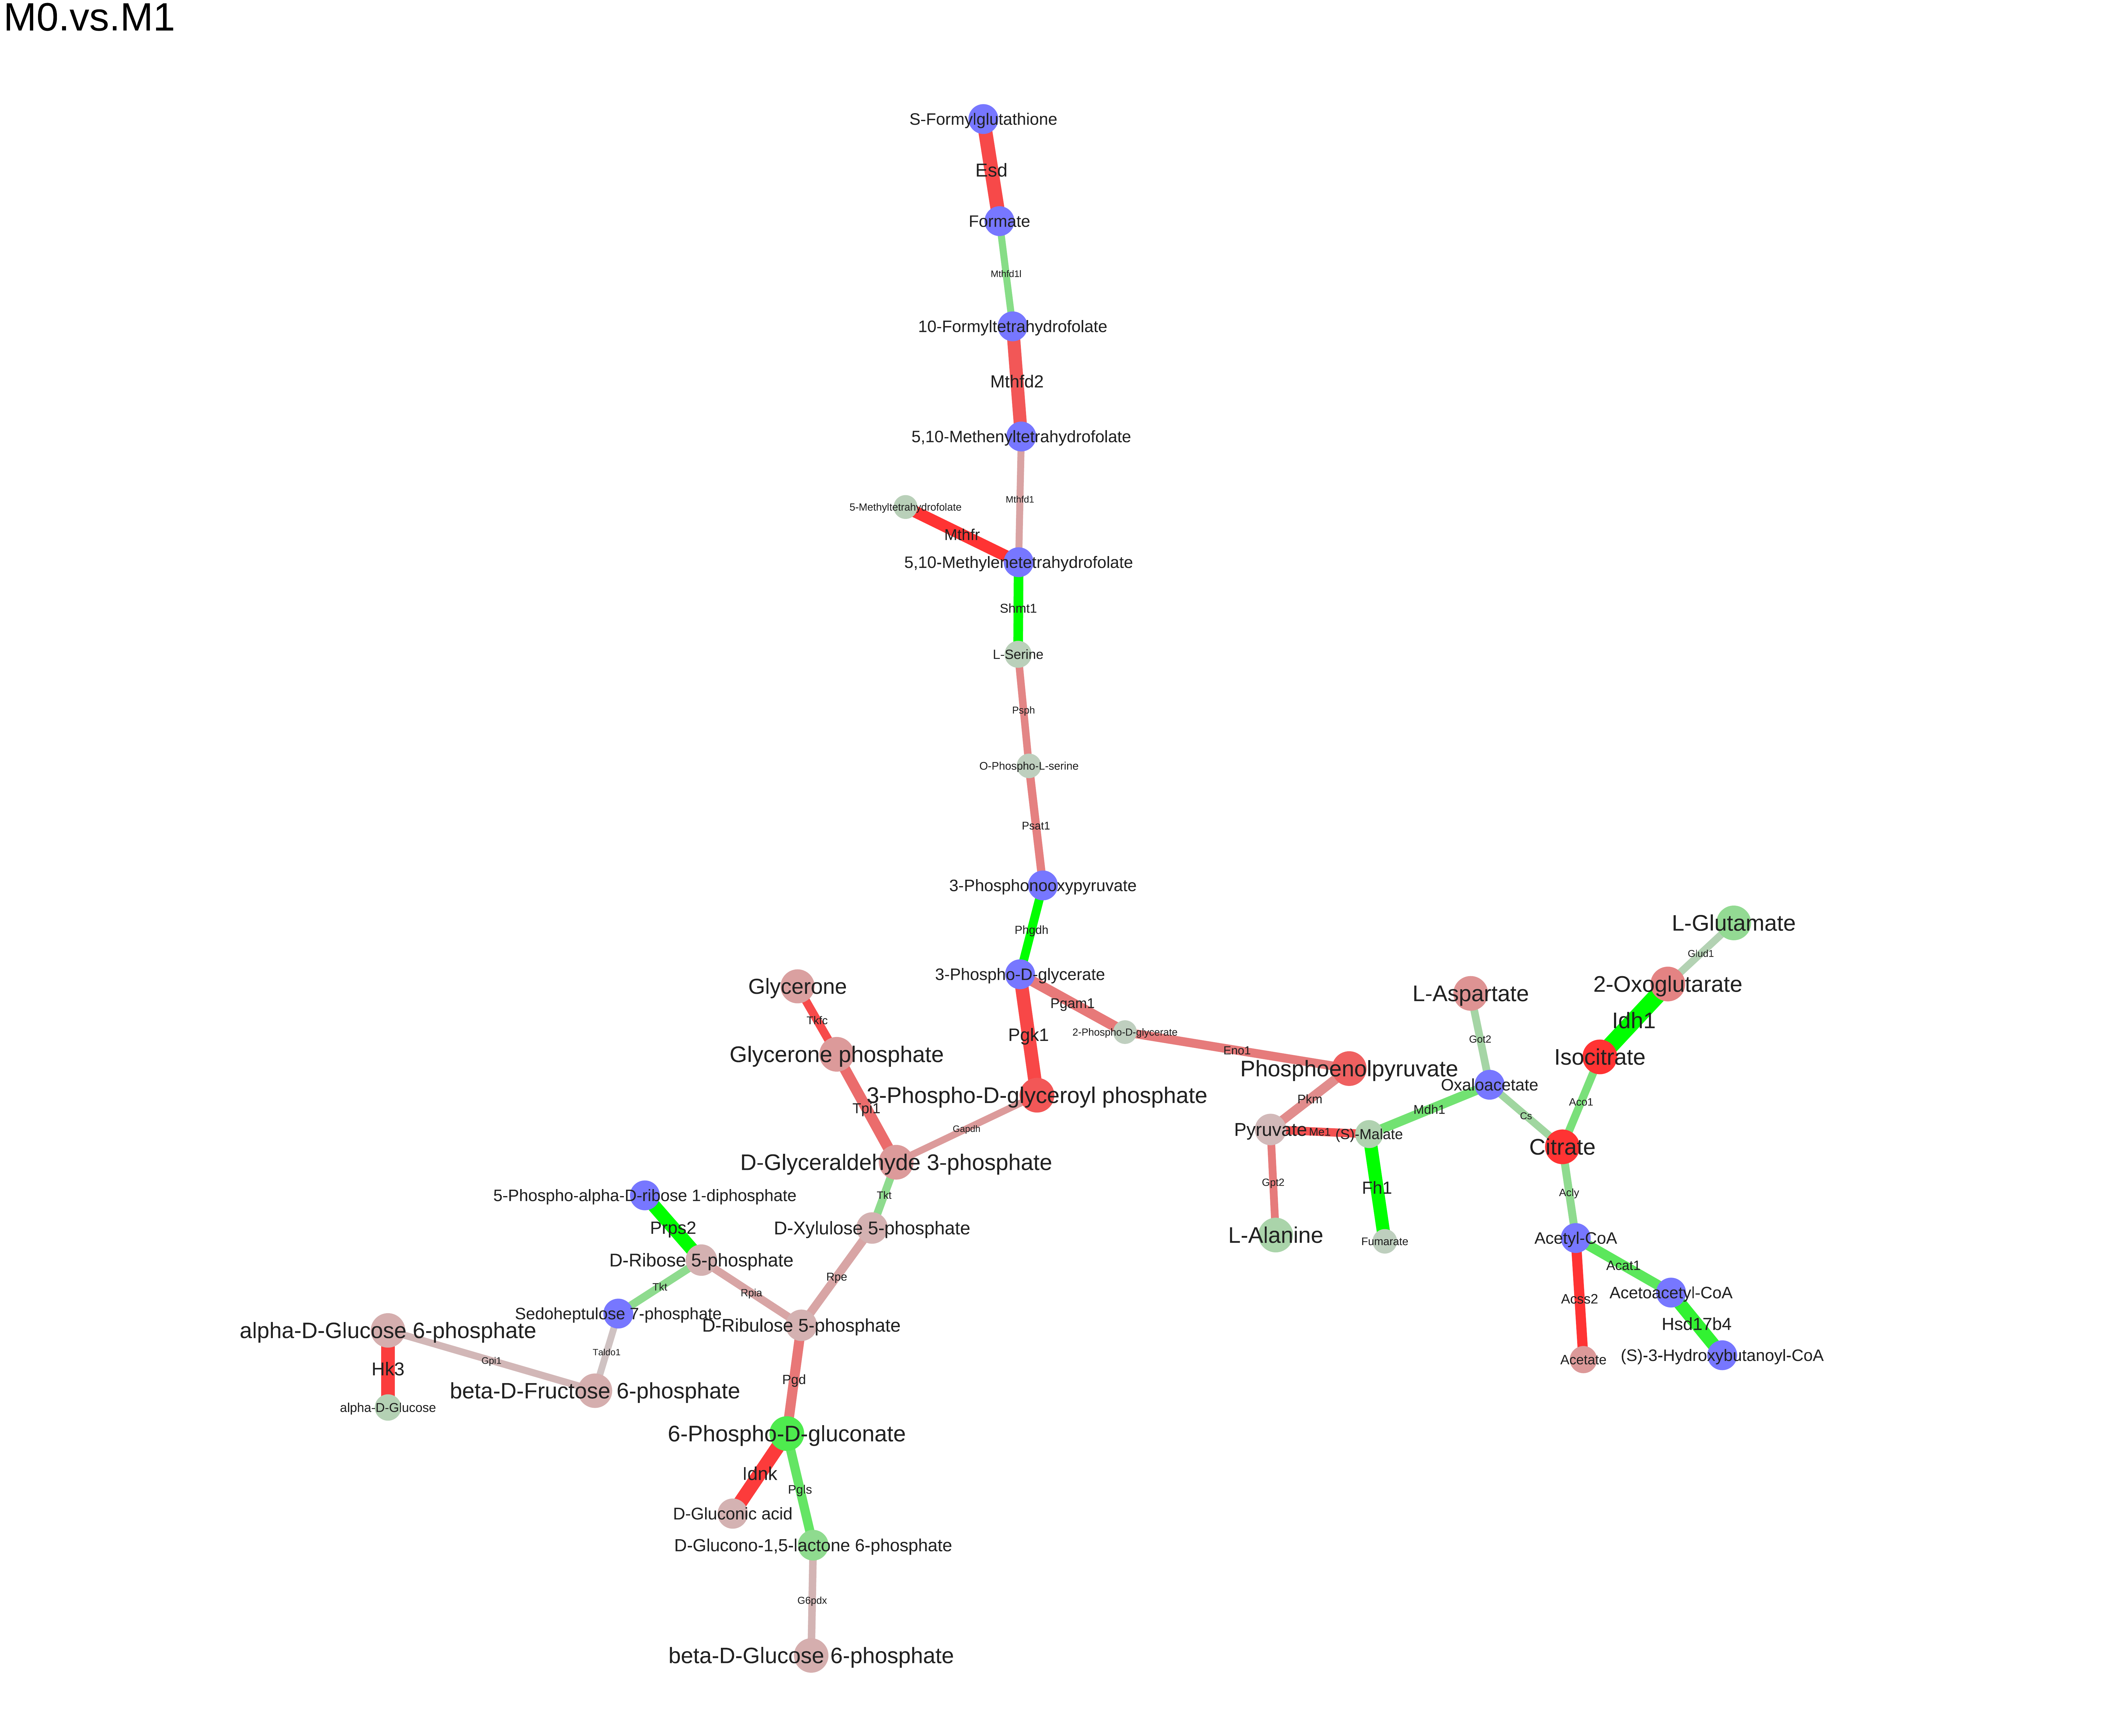
We can save the module to different formats (dot, xgmml, svg, pdf):
saveModuleToPdf(m, file="M0.vs.M1.pdf", name="M0.vs.M1", n_iter=100, force=1e-5)