FANTOM: Functional and taxonomic analysis of metagenomes (original) (raw)
Abstract
Background
Interpretation of quantitative metagenomics data is important for our understanding of ecosystem functioning and assessing differences between various environmental samples. There is a need for an easy to use tool to explore the often complex metagenomics data in taxonomic and functional context.
Results
Here we introduce FANTOM, a tool that allows for exploratory and comparative analysis of metagenomics abundance data integrated with metadata information and biological databases. Importantly, FANTOM can make use of any hierarchical database and it comes supplied with NCBI taxonomic hierarchies as well as KEGG Orthology, COG, PFAM and TIGRFAM databases.
Conclusions
The software is implemented in Python, is platform independent, and is available at http://www.sysbio.se/Fantom
Discover the latest articles and news from researchers in related subjects, suggested using machine learning.
Background
Metagenomics [[1](/article/10.1186/1471-2105-14-38#ref-CR1 "The New Science of Metagenomics: Revealing the Secrets of Our Microbial Planet. Washington (DC); 2007. http://www.ncbi.nlm.nih.gov/books/NBK54006
")\] is the culture independent study of an environmental sample by sequencing of the recovered genetic materials of targeted ribosomal RNAs (16S) through amplicon sequencing or whole genomic DNA. This allows for determining the ecosystems taxonomic diversity, functional capacity, dynamics and comparison with other environments. Typically for whole genome based metagenomics, extracted DNA from an environmental sample is a starting material to generate short reads of DNA through next generation sequencing (NGS) technologies that represent the microbiota of the sample. The generated raw sequence reads data typically contain errors that need to be eliminated before further steps using trimming and filtering processes based on a base calling quality score (Phred) \[[2](/article/10.1186/1471-2105-14-38#ref-CR2 "Cox MP, Peterson DA, Biggs PJ: SolexaQA: At-a-glance quality assessment of Illumina second-generation sequencing data. BMC Bioinforma 2010, 11: 485. 10.1186/1471-2105-11-485"), [3](/article/10.1186/1471-2105-14-38#ref-CR3 "Schmieder R, Edwards R: Quality control and preprocessing of metagenomic datasets. Bioinformatics 2011,27(6):863-864. 10.1093/bioinformatics/btr026")\]. The high quality reads can be annotated to reference taxonomic and functional features using sequence similarity based alignment methods i.e. BLAST \[[4](/article/10.1186/1471-2105-14-38#ref-CR4 "Altschul SF, Gish W, Miller W, Myers EW, Lipman DJ: Basic local alignment search tool. J Mol Biol 1990,215(3):403-410.")\], HMMER \[[5](/article/10.1186/1471-2105-14-38#ref-CR5 "Eddy SR: Accelerated Profile HMM Searches. PLoS Comput Biol 2011,7(10):e1002195. 10.1371/journal.pcbi.1002195")\], etc. against reference databases. Another approach is based on mapping high quality reads on reference genomes or well annotated genes by short read aligners \[[6](/article/10.1186/1471-2105-14-38#ref-CR6 "Li H, Homer N: A survey of sequence alignment algorithms for next-generation sequencing. Brief Bioinform 2010,11(5):473-483. 10.1093/bib/bbq015")\]. There are web services such as CAMERA \[[7](/article/10.1186/1471-2105-14-38#ref-CR7 "Seshadri R, Kravitz SA, Smarr L, Gilna P, Frazier M: CAMERA: a community resource for metagenomics. PLoS Biol 2007,5(3):e75. 10.1371/journal.pbio.0050075")\], IMG/M \[[8](/article/10.1186/1471-2105-14-38#ref-CR8 "Markowitz VM, Ivanova NN, Szeto E, Palaniappan K, Chu K, Dalevi D, Chen IM, Grechkin Y, Dubchak I, Anderson I, et al.: IMG/M: a data management and analysis system for metagenomes. Nucleic Acids Res 2008, 36: D534-D538. Database issue Database issue")\] and MG-RAST \[[9](/article/10.1186/1471-2105-14-38#ref-CR9 "Meyer F, Paarmann D, D’Souza M, Olson R, Glass EM, Kubal M, Paczian T, Rodriguez A, Stevens R, Wilke A, et al.: The metagenomics RAST server - a public resource for the automatic phylogenetic and functional analysis of metagenomes. BMC Bioinforma 2008, 9: 386. 10.1186/1471-2105-9-386")\], available for performing the above mentioned pipeline of NGS processing and annotation in an automated fashion. Depending on user-given parameters such as percentage similarity or e-value thresholds, each of these individual software tools or web services are able to report the annotated sequences in terms of abundance data for each feature in the subjected database. Further analysis of the hereby obtained quantitative abundance data of metagenomics features, in particular together with sample meta data is important for biological interpretation \[[10](/article/10.1186/1471-2105-14-38#ref-CR10 "Yilmaz P, Kottmann R, Field D, Knight R, Cole JR, Amaral-Zettler L, Gilbert JA, Karsch-Mizrachi I, Johnston A, Cochrane G, et al.: Minimum information about a marker gene sequence (MIMARKS) and minimum information about any (x) sequence (MIxS) specifications. Nat Biotechnol 2011,29(5):415-420. 10.1038/nbt.1823"), [11](/article/10.1186/1471-2105-14-38#ref-CR11 "Yilmaz P, Gilbert JA, Knight R, Amaral-Zettler L, Karsch-Mizrachi I, Cochrane G, Nakamura Y, Sansone SA, Glockner FO, Field D: The genomic standards consortium: bringing standards to life for microbial ecology. ISME J 2011,5(10):1565-1567. 10.1038/ismej.2011.39")\].Although, the above mentioned web-services can to some extent provide both analysis tools for the comparative analysis of metagenomes, these methods have some limitations; 1) statistical and visual analysis capabilities are limited, 2) functional annotation sources might not satisfy user’s demand, and 3) users may simply not want to upload their sequencing data to an online service. There are several standalone software tools available for statistical analysis and visualization of annotated metagenomics data, e.g. MEGAN [12], SmashCommunity [13], STAMP [14], shotgunFunctionalizeR [15], VEGAN [16], QIIME [17] and Mothur [18].
We identified the requirement for a user-friendly comparative analysis and data visualization tool where annotated metagenomics data can meet sample metadata and be analyzed at different hierarchy levels using a built-in or user provided biological database. This tool, FANTOM for F unctional AN notation and T axonomic analysis O f M etagenomes, is an easy installed, standalone software tool that is accessed through a graphical user interface to analyze abundance of metagenomics features that are easily integrated with NCBI taxonomy, KEGG [19], COG [20] and protein family databases PFAM [21] and TIGRFAM [22] with hierarchy information. We believe that this tool will be highly useful for a broad community of scientists desiring to analyze metagenomics data.
Implementation
The software installer, user manual and demonstration videos can be found and downloaded at the website http://www.sysbio.se/Fantom
FANTOM was implemented in Python allowing it to operate platform independent in addition to the utilization of core scientific packages including numpy, scipy and matplotlib to implement statistical functions and various plotting options. wxPython was incorporated to provide graphical user interface components and storm package was used for object relational mapping of data from the local SQLite database. The software was tested successfully on Windows, Linux and OSX operating systems and the installers are provided for the different platforms.
FANTOM requires two input files; a metagenomics abundance file, which could be derived from annotation of metagenomics data, including either taxonomic or functional annotations and another file containing the samples’ metadata (see user manual and demonstration videos). Besides, there are web services such as CAMERA [7], IMG/M [8] and MG-RAST [9] that allow the users to easily obtain metagenomics abundance from their metagenome data. Metadata can either be numerical or categorical and the software will automatically recognize the format and display options for selecting and filtering samples. Functional hierarchy information was downloaded from KEGG Orthology, COG, PFAM and TIGRFAM databases and taxonomic lineage information was downloaded from the NCBI taxonomy database and constitute the standards feature databases in the software package. Moreover, FANTOM provides the option that allows the user to create and use a custom made hierarchical database. The custom database can be easily imported as a tabular input file to analyze the abundances of corresponding database levels.
In FANTOM, the abundance can be specified at different levels in hierarchical databases, which are called nodes (e.g. pathways or Genera), the abundance of a higher node in the hiearchy is calculated by summing the abundance of all member nodes further down in the hierarchy structure (e.g. orthologs or species). The abundance of nodes that are members of more than one higher level nodes are split equally between higher nodes.
The metadata file can include both categorical and numerical properties of each sample, which can then be used in FANTOM to filter and select sample groups of interest for comparative analysis. Numerical variables can further be used for correlation analysis with the annotated features. Taxonomic or functional feature abundances can be displayed and processed either as absolute counts or as normalized relative values. After selecting relevant subsets of metagenomics data, principal component analysis can be applied to reduce the dimensionality. Furthermore, hierarchical clustering, another multivariate analysis method is implemented to evaluate high dimensional metagenomics data by drawing dendograms for features and samples as well as a heatmap with 2-dimensional clustering, reflecting abundance values.
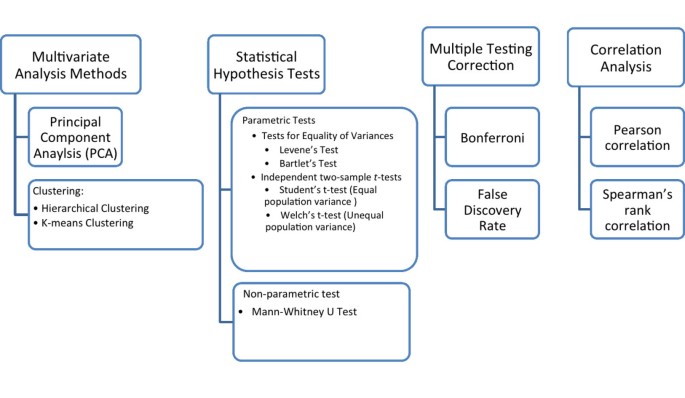
By defining groups of samples based on metadata, statistical hypothesis tests can be performed to compare metagenomics features between groups. FANTOM, currently supports two sample comparisons. Non-parametric Mann-Whitney U test was implemented in FANTOM and is encouraged because of the typically non-normally distribution of metagenomics data. Shapiro Wilk’s normalty test, Bartlett’s test and Levene’s test for equality of variances and Student’s t-test were also implemented as parametric hypothesis tests. Obtained p-values of these tests can be adjusted for multiple testing using either Bonferroni or Benjamini-Hochberg false discovery rate (fdr). Results can finally be filtered according to p-values, absolute fold change and mean relative abundance. The multivariate and statistical methods that are provided in FANTOM are summarized in Figure 1.
Figure 1
Statistical analyses provided in FANTOM.
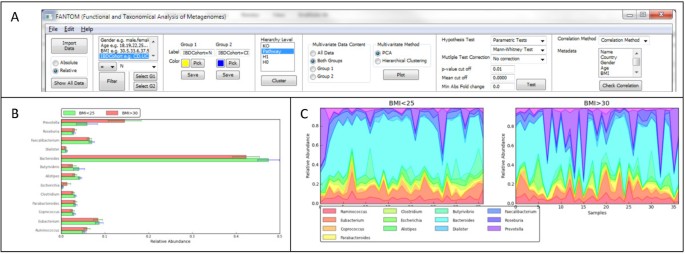
FANTOM provides several options for graphical representation of the data and comparative analysis. After hypothesis testing, significant results can be displayed by bar charts, boxplots, pie charts and area plots. Plotting options make use of the hierarchies in NCBI taxanomy, KEGG and COG, groups of metagenomics data according to the specified level and added filtering options. The software provides means to save the figures in high quality formats that can be used directly for publication. An example of a screen shot of FANTOM is shown in Figure 2.
Figure 2
Graphical user interface of FANTOM and examples of plots that can be generated. A) FANTOM data manipulation panel B) Bar graph comparing two types of patients by KEGG pathway level abundances C) Area plot showing two sets of samples and individual profiles of KEGG pathway abundance in each sample.
Results and discussion
The software was evaluated using metagenomics data from the gut microbiome of 124 subjects in the MetaHIT [23] project. Sequences were quality trimmed (SolexaQA -p 0.05) and sequences shorter than 35 bp were filtered out. High quality reads were aligned to a reference catalogue of 440 genomes to obtain taxonomic abundance. Moreover, the reads were aligned to the MetaHIT gene catalogue of 3.3 million genes to get the abundance of genes. The genes were annotated to the KEGG and COG database and this information was used to transform gene abundance to KEGG KO and COG abundances. This data are available as example files together with metadata included bundled with the software.
The MetaHIT study focused on two human diseases, obesity and inflammatory bowel disease (Crohn’s disease and ulcerative colitis), which we make use of here as example capabilities of FANTOM.
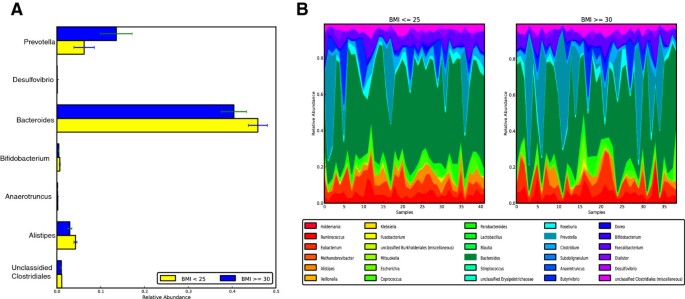
Differences based on Mann-Whitney U test (FDR < 0.2) were observed for lean (BMI < 25) and obese (BMI > 30) individuals in species and genus level taxonomy terms. At the genus level, particularily Prevotella was enriched in obese individuals whereas Bacteroides, Bifidobacterium, Alistipes and unclassified Clostridiales were enriched in normal weight subjects (Figure 3A). Previous reports have discussed the association between the ratio of Firmicutes to Bacteroidetes with obesity and came to different conclusions [24-26]. Here we observed changes within the Bacteroidetes phyla by an increase of Prevotella and a decrease in Bacteroides in obese subjects. To get an appreciation of the variability and profiles in the microbiota across individuals, the relative abundance profiles were plotted in area plots (Figure 3B).
Figure 3
Comparison of healthy lean subject with obese subjects. A) Genera with a FDR < 0.2 that are differentially abundant between lean an obese subjects. B) Area plot of the significant species in A).
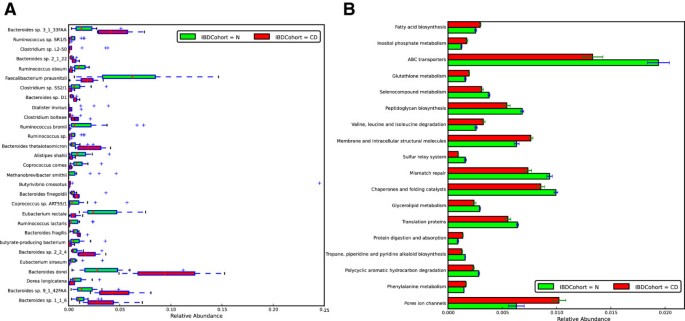
Comparisons between Spanish Crohn’s disease (CD) patients and healthy individuals in taxonomical terms are illustrated in Figure 4A. Based on Mann-Whitney U test (p-value < 0.05), it is clearly seen that there was a decrease in CD patients of several common Firmicutes species commonly known to be present in a healthy gut such as Ruminococcus sp, Faecalibacterium sp., Clostridium sp., Alistripes sp., Coprocouccus sp., Methanobrevibacter sp., Eubacterium sp. Dorea sp. and butyrate producing bacteria. The loss of Firmicutes and Faecalibacterium prausnitzii in particular has been observed previously [27] and is confirmed here. Subsequently, an increase of several Bacteroides sp. was observed in CD patients. By using the functional information and testing for differential abundance of KEGG pathways between CD patients and healthy subjects specific metabolic pathways could be identified as seen in Figure 4B. The results are consistent with the taxonomical changes as the enrichment of the Gram negative Bacteroides sp. are consistent with the decreased number of genes for peptidoglycan biosynthesis as well as ABC transporter but an increase in membrane structure and transport as well as ion channels in CD patients.
Figure 4
Taxonomic and functional differences in Crohn’s disease (CD) patients compared to healthy subjects. A) Differentially abundant species between CD and healthy subjects. B) Differentially abundant KEGG pathways between CD and healthy subjects.
Conclusion
We provide an open source standalone user-friendly software tool, FANTOM, for data analyses and data mining of read counts from whole shotgun metagenomics or amplicon sequencing studies. FANTOM allows the user to integrate sample metadata, taxonomy and gene functional profiling in the analysis, and FANTOM is supplied with access to biological databases as well as the possibility to upload custom made databases.
Availability and requirements
Project name: FANTOM : Functional and taxonomic analysis of metagenomes
Project home page: http://www.sysbio.se/Fantom
Operating system(s): Windows, Linux, Mac OSX
Programming language: python
Other requirements: -
License: GNU-GPL version 3 software license
Any restrictions to use by non-academics: No
References
- The New Science of Metagenomics: Revealing the Secrets of Our Microbial Planet. Washington (DC); 2007. http://www.ncbi.nlm.nih.gov/books/NBK54006
- Cox MP, Peterson DA, Biggs PJ: SolexaQA: At-a-glance quality assessment of Illumina second-generation sequencing data. BMC Bioinforma 2010, 11: 485. 10.1186/1471-2105-11-485
Article Google Scholar - Schmieder R, Edwards R: Quality control and preprocessing of metagenomic datasets. Bioinformatics 2011,27(6):863-864. 10.1093/bioinformatics/btr026
Article PubMed Central CAS PubMed Google Scholar - Altschul SF, Gish W, Miller W, Myers EW, Lipman DJ: Basic local alignment search tool. J Mol Biol 1990,215(3):403-410.
Article CAS PubMed Google Scholar - Eddy SR: Accelerated Profile HMM Searches. PLoS Comput Biol 2011,7(10):e1002195. 10.1371/journal.pcbi.1002195
Article PubMed Central CAS PubMed Google Scholar - Li H, Homer N: A survey of sequence alignment algorithms for next-generation sequencing. Brief Bioinform 2010,11(5):473-483. 10.1093/bib/bbq015
Article PubMed Central CAS PubMed Google Scholar - Seshadri R, Kravitz SA, Smarr L, Gilna P, Frazier M: CAMERA: a community resource for metagenomics. PLoS Biol 2007,5(3):e75. 10.1371/journal.pbio.0050075
Article PubMed Central PubMed Google Scholar - Markowitz VM, Ivanova NN, Szeto E, Palaniappan K, Chu K, Dalevi D, Chen IM, Grechkin Y, Dubchak I, Anderson I, et al.: IMG/M: a data management and analysis system for metagenomes. Nucleic Acids Res 2008, 36: D534-D538. Database issue Database issue
Article PubMed Central CAS PubMed Google Scholar - Meyer F, Paarmann D, D’Souza M, Olson R, Glass EM, Kubal M, Paczian T, Rodriguez A, Stevens R, Wilke A, et al.: The metagenomics RAST server - a public resource for the automatic phylogenetic and functional analysis of metagenomes. BMC Bioinforma 2008, 9: 386. 10.1186/1471-2105-9-386
Article CAS Google Scholar - Yilmaz P, Kottmann R, Field D, Knight R, Cole JR, Amaral-Zettler L, Gilbert JA, Karsch-Mizrachi I, Johnston A, Cochrane G, et al.: Minimum information about a marker gene sequence (MIMARKS) and minimum information about any (x) sequence (MIxS) specifications. Nat Biotechnol 2011,29(5):415-420. 10.1038/nbt.1823
Article PubMed Central CAS PubMed Google Scholar - Yilmaz P, Gilbert JA, Knight R, Amaral-Zettler L, Karsch-Mizrachi I, Cochrane G, Nakamura Y, Sansone SA, Glockner FO, Field D: The genomic standards consortium: bringing standards to life for microbial ecology. ISME J 2011,5(10):1565-1567. 10.1038/ismej.2011.39
Article PubMed Central CAS PubMed Google Scholar - Huson DH, Auch AF, Qi J, Schuster SC: MEGAN analysis of metagenomic data. Genome Res 2007,17(3):377-386. 10.1101/gr.5969107
Article PubMed Central CAS PubMed Google Scholar - Arumugam M, Harrington ED, Foerstner KU, Raes J, Bork P: SmashCommunity: a metagenomic annotation and analysis tool. Bioinformatics 2010,26(23):2977-2978. 10.1093/bioinformatics/btq536
Article CAS PubMed Google Scholar - Parks DH, Beiko RG: Identifying biologically relevant differences between metagenomic communities. Bioinformatics 2010,26(6):715-721. 10.1093/bioinformatics/btq041
Article CAS PubMed Google Scholar - Kembel SW, Cowan PD, Helmus MR, Cornwell WK, Morlon H, Ackerly DD, Blomberg SP, Webb CO: Picante: R tools for integrating phylogenies and ecology. Bioinformatics 2010,26(11):1463-1464. 10.1093/bioinformatics/btq166
Article CAS PubMed Google Scholar - Dixon P: VEGAN, a package of R functions for community ecology. J Veg Sci 2003,14(6):927-930. 10.1111/j.1654-1103.2003.tb02228.x
Article Google Scholar - Caporaso JG, Kuczynski J, Stombaugh J, Bittinger K, Bushman FD, Costello EK, Fierer N, Pena AG, Goodrich JK, Gordon JI, et al.: QIIME allows analysis of high-throughput community sequencing data. Nat Methods 2010,7(5):335-336. 10.1038/nmeth.f.303
Article PubMed Central CAS PubMed Google Scholar - Schloss PD, Westcott SL, Ryabin T, Hall JR, Hartmann M, Hollister EB, Lesniewski RA, Oakley BB, Parks DH, Robinson CJ, et al.: Introducing mothur: open-source, platform-independent, community-supported software for describing and comparing microbial communities. Appl Environ Microbiol 2009,75(23):7537-7541. 10.1128/AEM.01541-09
Article PubMed Central CAS PubMed Google Scholar - Kanehisa M, Goto S: KEGG: Kyoto Encyclopedia of Genes and Genomes. Nucleic Acids Res 2000,28(1):27-30. 10.1093/nar/28.1.27
Article PubMed Central CAS PubMed Google Scholar - Tatusov RL, Galperin MY, Natale DA, Koonin EV: The COG database: a tool for genome-scale analysis of protein functions and evolution. Nucleic Acids Res 2000,28(1):33-36. 10.1093/nar/28.1.33
Article PubMed Central CAS PubMed Google Scholar - Finn RD, Mistry J, Tate J, Coggill P, Heger A, Pollington JE, Gavin OL, Gunasekaran P, Ceric G, Forslund K, et al.: The Pfam protein families database. Nucleic Acids Res 2010, 38: D211-D222. 10.1093/nar/gkp985
Article PubMed Central CAS PubMed Google Scholar - Haft DH, Selengut JD, White O: The TIGRFAMs database of protein families. Nucleic Acids Res 2003,31(1):371-373. 10.1093/nar/gkg128
Article PubMed Central CAS PubMed Google Scholar - Qin J, Li R, Raes J, Arumugam M, Burgdorf KS, Manichanh C, Nielsen T, Pons N, Levenez F, Yamada T, et al.: A human gut microbial gene catalogue established by metagenomic sequencing. Nature 2010,464(7285):59-65. 10.1038/nature08821
Article PubMed Central CAS PubMed Google Scholar - Ley RE, Backhed F, Turnbaugh P, Lozupone CA, Knight RD, Gordon JI: Obesity alters gut microbial ecology. Proc Natl Acad Sci USA 2005,102(31):11070-11075. 10.1073/pnas.0504978102
Article PubMed Central CAS PubMed Google Scholar - Schwiertz A, Taras D, Schafer K, Beijer S, Bos NA, Donus C, Hardt PD: Microbiota and SCFA in lean and overweight healthy subjects. Obesity (Silver Spring) 2010,18(1):190-195. 10.1038/oby.2009.167
Article Google Scholar - Duncan SH, Lobley GE, Holtrop G, Ince J, Johnstone AM, Louis P, Flint HJ: Human colonic microbiota associated with diet, obesity and weight loss. Int J Obes (Lond) 2008,32(11):1720-1724. 10.1038/ijo.2008.155
Article CAS Google Scholar - Sokol H, Pigneur B, Watterlot L, Lakhdari O, Bermudez-Humaran LG, Gratadoux JJ, Blugeon S, Bridonneau C, Furet JP, Corthier G, et al.: Faecalibacterium prausnitzii is an anti-inflammatory commensal bacterium identified by gut microbiota analysis of Crohn disease patients. Proc Natl Acad Sci USA 2008,105(43):16731-16736. 10.1073/pnas.0804812105
Article PubMed Central CAS PubMed Google Scholar
Acknowledgements
We would like to thank Chalmers Foundation, Knut and Alice Wallenberg Foundation and Bioinformatics Infrastructure for Life Sciences (BILS) for financial support. The open access charge is funded by Chalmers Library.
Author information
Author notes
- Kemal Sanli
Present address: Department of Biological and Environmental Sciences, University of Gothenburg, Box 100, Gothenburg, S-405 30, Sweden
Authors and Affiliations
- Department of Chemical and Biological Engineering, Chalmers University of Technology, Kemivägen 10, Gothenburg, SE, 412 96, Sweden
Kemal Sanli, Fredrik H Karlsson, Intawat Nookaew & Jens Nielsen
Authors
- Kemal Sanli
- Fredrik H Karlsson
- Intawat Nookaew
- Jens Nielsen
Corresponding authors
Correspondence toIntawat Nookaew or Jens Nielsen.
Additional information
Competing interests
The authors declare that they have no competing interests.
Authors’ contributions
KS, FK, IN and JN designed the study. KS implemented the software. FK developed the webpage. IN coordinated the study. KS, FK and IN wrote the manuscript. All authors read and approved the final manuscript.
Kemal Sanli, Fredrik H Karlsson contributed equally to this work.
Authors’ original submitted files for images
Rights and permissions
Open Access This article is published under license to BioMed Central Ltd. This is an Open Access article is distributed under the terms of the Creative Commons Attribution License (https://creativecommons.org/licenses/by/2.0 ), which permits unrestricted use, distribution, and reproduction in any medium, provided the original work is properly cited.
About this article
Cite this article
Sanli, K., Karlsson, F.H., Nookaew, I. et al. FANTOM: Functional and taxonomic analysis of metagenomes.BMC Bioinformatics 14, 38 (2013). https://doi.org/10.1186/1471-2105-14-38
- Received: 27 September 2012
- Accepted: 29 January 2013
- Published: 01 February 2013
- DOI: https://doi.org/10.1186/1471-2105-14-38


