A simulation model of African Anopheles ecology and population dynamics for the analysis of malaria transmission (original) (raw)
The model incorporates basic biological requirements for Anopheles development on an individual basis and, using local environmental data as input, allows the simulation of the aggregate dynamics of Anopheles populations. The life cycle of each individual proceeds through four stages: three immature stages, which occur in a water body – egg, larva, pupa – and then the mature stage, a flying adult. An adult female disperses from the natal water body and begins a cycle which is maintained throughout the rest of life-alternating between obtaining a bloodmeal and ovipositing in a water body.
Five major factors are considered here as characterizing Anopheles population dynamics, by means of mechanisms detailed below (see figure 1 for a schematic):
Figure 1
Model description.
Temperature is a critical regulator of growth and development within each stage, in determining the end of one stage and the beginning of the next and in regulating the length of the gonotrophic cyle.
Moisture, in the form of precipitation and relative humidity, is a second key abiotic factor, with effects that in part interact with those of temperature.
Nutrient competition is a major potential regulator which is considered to induce mortality in the larval stage. In addition, there is a minimum weight requirement for the transition from larva to pupa, and, through its influence on adult weight, the relation of larval weight to fecundity.
Predation and Disease, in which pathogens are included, is a second important mortality-inducing factor, which is considered in local terms relative to the water body.
Dispersal, or the adult female's movement in space, is a critical factor in the cycle of seeking blood meals and oviposition sites. The model explicitly represents spatial locations of individual adults, though it does not fully engage this capacity in the analyses presented here.
The model is implemented as a software package in the C++ object-oriented programming language, in the Microsoft Windows 98 operating system, and is available from the corresponding author upon request. It was developed and run on a personal computer with a Pentium 3 processor 933 MHz and a relatively small memory of 256 Mb.
Temperature
Because malaria vectors are poikilothermic, temperature is a critical variable in malaria epidemiology. For instance, in the range of 18°C to 26°C, a change of only 1°C in temperature can change a mosquito's life span by more than a week [5].
Here, in line with the work of Focks et al. [6] on Aedes aegypti, the enzyme kinetics model derived by Sharpe and DeMichele [7] is used, based on absolute reaction rate kinetics of enzymes for the temperature-dependent developmental rates of eggs, larvae and pupae and the duration of the gonotrophic cycle, in the simplified form derived by Schoofield et al. [8].
This equation is derived on the basic assumption that poikilotherm development is regulated by a single control enzyme whose reaction rate determines the development rate of the organism [7, 8]. This is of special interest because each parameter of the equation has a biological significance that may have an epidemiologic impact.
At time step t n of t 0, t 1, ..., t n , the development within each of the four stages, during the time step Δt k = t k - t _k_-1, is defined by:
d k = r(T tk )·Δt k . (1)

is the mean temperature (°K) over the time interval k and r() the developmental rate per hour at temperature T(°K), given by the following equation:
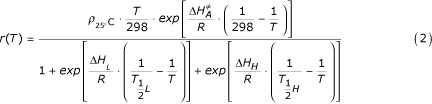
where ρ 25°C is the development rate per hour at 25°C, under the assumption that there is no temperature inactivation of the critical enzyme;  is the enthalpy of activation of the reaction catalyzed by the enzyme (cal·mol -1); ΔH L is the enthalpy change associated with low temperature inactivation of the enzyme (cal·mol -1);
  is the temperature (°K) where 50% of the enzyme is inactivated by low temperature; ΔH H is the enthalpy change associated with high temperature inactivation of the enzyme (cal·mol -1);
  is the temperature (°K) where 50% of the enzyme is inactivated by high temperature; and R is the universal gas constant (1.987_cal·mol_ -1).
The cumulative development, depending only on temperature at each time step t n , of each of the three stages (egg, larvae, pupae) and the length of the adult gonotrophic cycle is defined as:
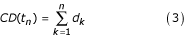
with d k defined above in equation 1.
As detailed below, other factors are also considered, including a particular case for the larval stage that takes food requirements into account.
Variability is allowed for in the cumulative development time, CD(t n ), with a default value of 10% and a stage is considered completed, such that the next stage begins when:
CD(t) >CD f = 1 + G(0,0.l) (4)
where G is a normal random variable.
A survey of the literature reveals how very little developmental-rate data is available for Anopheles, even for the most important African malaria vectors. The deficit is striking for all of the three major malaria vector species in Africa. We have fit the curve defined by equation 3 to all of the relevant published data. Those data are compiled in tables 1 and 2, for An. gambiae sensus lato.
Table 1 Published or estimated (*) An. gambiae sensu lato immature stage developmental times (in days). The last point (**) is derived from the Jepson catenary curves.
Table 2 Published or estimated (*) An. gambiae sensu lato immature stage developmental times (in days). The last point (**) is derived from the Jepson catenary curves (continuing).
One reference provided only the total An. gambiae development time from egg to adult [5], we have then estimated the development time for each of the three constituent stages in according with the other data, and also assumed longer development times at low temperatures.
The only gonotrophic cycle data available in relation to temperature was for An. arabiensis, part of the An. gambiae complex.
All three curves shown in figure 2, for different parameters of equation 2, provide similar fits to the An. gambiae data in tables 1 and 2. These different curves have important implications for vector population dynamics and reinforce the need for more data for these species, particularly at the temperature extremes (low and high), in order to fit an optimal curve. Until there is data for the extreme temperatures, any number of curves might fit the data. Three such curves are illustrated in figure 2. For the purposes of this paper the middle of these three curves has been chosen, with parameters shown in table 3. The curves for all four stages are shown in figures 3 and 4, with parameters in table 3.
Figure 2
Three possible curves fit to An. gambiae larvae development rate data.
Table 3 An. gambiae developmental rate parameters.
Figure 3
Egg and adult development rates.
Figure 4
Larvae and pupae development rates.
An. gambiae females are one-day old when they take their first blood meal, according to [9]. This greater length of the first gonotrophic cycle has been taken into account [9][10] by defining a coefficient U FirstGon which represents the time lag before the first blood meal expressed as a percentage of the gonotrophic cycle length. Therefore, the first gonotrophic cycle is considered completed if:
CD(t) >CD f = 1 + U FirstGon + G(0,0.1) (5)
U FirstGon has been set to 0.5 for An. gambiae. All subsequent gonotrophic cycles follow equation 4.
Thermal mortality
Although the range of variation of water temperature is very wide, it is rarely taken into account in the literature. Some authors have recorded temperatures close to 40°C in small pools [5, 11, 12]. Such temperatures exceed the thermal death point of many species, including An. funestus [5, 12]; this may help to explain why these species are rarely found in small pools. Based on these observations [5, 12], a daily mortality in the larval stage of 10%, 50% and 100% for a maximum water temperature of 1, 2 and 3°C above the thermal death point, respectively, has been considered. According to [5] the thermal death point for An. gambiae is set to 40°C.
Moisture
Anopheles usually develop in natural water bodies, such as puddles, pools or streams [11–14]. The model must take into account two critical parameters in a water body, the temperature and the volume of water. In this stage of the project it was not possible to develop a full water-balance model to estimate those parameters but it should be possible in the future.
Cloud coverage is likely to be relatively important because of its impact on the water temperature, but this variable is rarely available in climate data. However, it is known that a relative humidity of 100% is usually associated with complete cloud coverage and rain and a relative humidity less than 50% with dryness and almost no clouds. Hence an estimate of cloud coverage as a function of relative humidity RH was made. A clear sky, without clouds (0), for relative humidity below 50%, linearly increases to completely cloudy (1) for relative humidity above 95%, as follows:
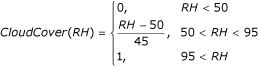
The maximum water temperature of a water body depends on the cloud coverage and a user-defined coefficient U SunExpo that describes the water body's sun exposure. This user-defined coefficient represents the coverage or shaded percentage of the particular water body, ranging from 0 for complete shade to 1 for complete sunlight exposure. By default it is set to 1.
If the maximum air temperature in degrees Celsius is T M, it is estimated that the maximum water temperature  in accord with the water volume x (in liters) is
  , where:

with C SE = U SunExpo ·CloudCover(RH). The minimum water temperature is taken as the minimum air temperature.
The following formula estimates the daily dynamics of water height W H in a water body:

where U IF is the fixed daily water intake in mm·day -1 (e.g. from a stream, pipeline, human activity, etc.); its default value is 0. U IV , the variable daily water intake in mm·day -1is set in accord with the precipitation and the surrounding area's topology. Its default value is 1, which would apply to a water body in a flat area, such that only direct rainfall fills the water body. The user can set a particular value: for a water body on a slope, this coefficient should reflect the volume of water intake given 1 ml of precipitation in the area. P is the precipitation in mm per day, and R H is the relative humidity. U O , in mm·day -1, is the daily loss of water due to soil infiltration and evapotranspiration. By default, this parameter is set to a mean value of 3 mm·day -1.
The water bodies are approximated by means of simple geometric objects, such as cubes and cylinders. The default geometric object is a box; its dimensions (length, width, depth) can be entered by the user. Therefore, the volume of water available in the water body is calculated from the particular shape of the water body and the water height calculated above (equation 6).
Aestivation and diapause
Unlike the eggs of Aedes aegypti, which, it has been shown, can survive in dry soil for more than two months [6], recent work [15] indicates that Anopheles eggs cannot survive more than 15 days on dry soil. Thus, since some African regions with endemic malaria experience drought periods longer than two months, the only plausible alternative seems to be adult aestivation. This is another aspect of Anopheles biology in which much more data is needed. The different survival probability during aestivation has been arbitrarily set as shown in table 4.
Table 4 Aestivation daily survival.
Aestivation or diapause is triggered by the non-availability of water (when water bodies are completely dry) for all stages. For the adult stage, aestivation is also triggered by a relative humidity arbitrarily chosen here at less than 40%, though even this may prove to be high in some area.
Nutrient competition
Some combination of regulatory mechanisms limits the size of any population of any species. The most important, for many species, can be described as density-dependent regulation, or competition for space and/or food, which is assumed to summarize or integrate complex, difficult-to-measure mechanisms, such as food mass conversion. For the sake of simplicity and practicality, the basic ecological concept of carrying capacity [16] has been used here. This concept has been applied primarily to the larval stage since it is the longest immature stage and is the only immature stage in which the mosquitoes feed and is, therefore, likely to be the most sensitive to competition.
For each water body i a carrying capacity K(i) (in mg) has been defined as:
K(i) = L Max ·S(i)·U Carrying (7)
where L Max is the maximum larval biomass density, defined for all species j by:

where N j is the larval population size per surface unit (m 2) for species j, and W j is the approximate mean weight of species 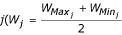 , with
  and
and  being the maximum and minimum possible weight in species j, respectively), divided by 2 in equation 8 to correct for the greater size of the low-weight larval population. L Max = 300 mg_·_m -2 has been arbitrarily set for larvae. S(i) is the available water surface in water body i, and U Carrying is a positive user-defined coefficient for each water body, to correct for particular water-body characteristics; by default it is set to 1. Thus, for each water body at peak season periods, the maximum larval biomass density L Max is estimated by measuring the larval population size at its maximum.
Density-dependent mortality
Resource competition is considered as a cause of mosquito mortality only for the larval stage. For species j [16] the natural increase of the total larval population size, N, (without mortality) can be defined by:

where p is the proportion of larvae that is newly-hatched eggs, estimated by:
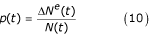
where ΔN e(t) is the number of individual eggs entering the larval stage.
The carrying capacity K(i) of a particular water body i is defined above (Equation 7). In general, the larval population increase is given by:

where W(t) is the current larval biomass overall (in contrast to W j , the approximate mean weight of species j; see equation 8).
The larval per capita density-dependent mortality rate m for all species can be approximated by:

Weight
As noted above, the larval stage is the only immature stage with food intake and, therefore, with weight changes. Thus, this stage is the key determinant of the final adult weight.

where

and

is a coefficient that describes food availability for an individual i of species j, is the maximum possible weight for species j, W(t) is the current larval biomass, K is the carrying capacity of the water body, and W i, j (t) the weight of individual i of species j at time t. For each time step k, for species j, the weight of individual i increases linearly as  , where d k is the thermal development in time period k (equation 2). The weight in the larval stage is then calculated as:

This formula allows the individual larva to have a maximum weight in accord with its species
when the larval biomass W << K. At the other extreme the weight increase will be almost zero if W ≈ K. Note that this formula allows both intra-and inter-species competition for food.
From [5, 17–19] the weight parameters for each species have been set as shown in table 5.
Table 5 Vector weight parameters.
For the purpose of stochastic simulation variability has been allowed, again with a default value of 10%, as follows:
W i, j = W i, j + G(0, 0.1) (16)
where G is a normal random variable. The larval stage is regarded as completed, such that the pupa stage begins, when the thermal development CD is completed (Eq. 4) and Weight >Weight Min .
The relative weight of an individual within its species is used as an important factor in subsequent subsections on fecundity and number of blood meals, in which the following coefficient is used:

Predation and Disease
Predators and pathogens are an important regulating factor and are sometimes reported to be the major cause of mortality [20].
Egg
Little has been reported about An. gambiae egg mortality, from predation or any other cause, beyond an observation (Beier, personal observation) that up to 83% of eggs hatch after one day of drying on sandy loam soil. Without more information, the total egg mortality for each species was arbitrarily set at 5% as a fixed pre-development mortality for the overall batch and a daily survivorship of 0.99.
Larvae and Pupae
Service [20] points out that An. gambiae population sizes rise to a peak just after a drought period and then decrease to a roughly stationary level. Life cycles of predators on immature An. gambiae are generally longer than those of their prey, and during the latter phases predators are found in non-predatory stages (i.e. not preying on immature An. gambiae) [20]. Intensity of predation appears to be highly related to the early peak in prey, but there is still a regulatory effect even in the absence of predators. Hence, it is likely that predation is not the only major cause of mosquito mortality [20].
Service [20] evaluated immature An. gambiae sensu lato mortality from predation in two experiments, one in which predator density was high and another in which spraying had reduced predator density. His results are summarized in table 6. With respect to pathogens and parasites, he found that 2.1% to 15.9% of An. gambiae were infected.
Table 6 Proportion of death attributable to predation in An. gambiae larvae and pupae.
Active predation exhibits a lag time around the mean life-cycle length of the prey [20]. During the lag period l, if t = 0 is the start of this period, a curve should show a gradual increase in predation.
The conditions leading to a new predator lag period could occur, for instance, when a dry water body gains water or after a control intervention killing the predators. If (fig. 5):
Figure 5
Predation percentage function of time (lag time).
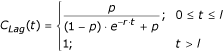
with

and p = 0.001, then the total larval and pupal mortality due to predators and pathogens for species j, can be expressed as:

Note that Δm j (t) differs from m(t) in equation 12, which represents density-dependent mortality. For all species j the following were arbitrarily set:  = 25% for larvae and = 10% for pupae. = 25% is converted to a daily mortality rate as:

where T is the individual's developmental time. Thus at t = 0, the beginning of the lag period, Δm j (t) ≈ 0, and at t ≥ l,  for species j.
On adding to the density-dependent mortality m j the mortality due to predation and pathogens Δm j (t), for each species j, we obtain a new equilibrium K p <K, given K in equation 11, where

where N j is the larval population size for species j (N(t) =  .
.
Adult
There are several published studies of adult mortality rates [9, 21] for An. gambiae and An. funestus. The causal mechanisms are not clear, but some authors report adult predators preying on adult mosquitoes at oviposition sites [20]. It is assumed that predation-related adult mortality is focused at the water body and that survivorship is greater with fewer predators present.
Oviposition typically occurs every two to three days (see above). Accounting for the low predation during the previously-defined predator lag time, the daily adult survival probability is taken to be 0.911 for a non-ovipositing day and 0.911 - 0.1·C Lag (t) for An. gambiae sensus lato.
Dispersal
The mechanisms governing mosquito dispersal in general remain unknown. Wind strength and direction are likely to be important factors, for instance, but relevant data are rarely reported. Very little is known about the relative attractiveness of individual humans and individual water bodies to Anopheles, but these cues, along with distance, must be key factors in dispersal.
In most tropical regions, bloodmeals are taken at night, between 6:00 pm and 6:00 am. As the mosquitoes are active during the night, for simplicity bites were modelled only in houses. Bloodmeal source selection is modelled by a two-step process, first a choice of house and second a choice of individual human within the house. Anthropophily, the proportion of bites taken on humans, can be set for each Anopheles species overall; the default value of this parameter is 1. Exophily is expressed as the proportion of fed mosquitoes that leave the house during the first half of the gonotrophic cycle. For An. gambiae the default value of this parameter is 75%.
The model explicitly, dynamically represents individual locations in space, but at this stage the adult female alternately chooses at random among some number of water bodies for an oviposition site, and at random among some number of houses and individuals within the chosen house, for a bloodmeal. That is, the choices do not reflect relative distance, attractiveness, wind or other features the model is designed to address in future phases of development.
Multiple bloodmeals and multiple bites
In addition to the greater length of the first gonotrophic cycle (Equation 5), Brengues [9] has shown that, to complete their first gonotrophic cycle, 42% of female An. gambiae and 63% of female An. funestus require a second bloodmeal one day after the first one. Here the probability of having a second bloodmeal within the first gonotrophic cycle is related to the weight of the individuals: there is a second bloodmeal when the coefficient C weight is less than 0.4 for An. gambiae.
For multiparous females, there is a second bloodmeal when C weight is less than 0.1.
According to [22], 14% of female An. funestus and 19% of female An. gambiae that had just fed had taken only a partial bloodmeal. These figures are used to represent the proportion of females that take a subsequent bite within what is considered the same bloodmeal.
Fecundity
The number of eggs oviposited by individuals shows a wide range of variation, both within and between experiments [17, 18, 23, 24]. The mean number of eggs oviposited is defined by m = 100, with a standard deviation s = 50. In the absence of more precise information these values are assumed. The number of eggs oviposited is simulated as:
N = _G(m, s)·_U Egg (21)
where U Egg is a positive user-defined coefficient set to fit local observations, by default set to 1, and G is a normal random variable. Because fecundity is closely tied to body size, a variability of 50% of the number of eggs is allowed as a function of the individual's weight, as follows (see [18][23]):
N' = N_·(0.5 + 0.5·_C weight ) (22)
The male-female ratio at emergence from the pupa stage is assumed to be 1:1.